 2019, Vol. 37
Institute of Oceanology, Chinese Academy of Sciences
Article Information
- WANG Yanping, LIU Yongling, MAO Xinyan, CHI Yutao, JIANG Wensheng
- Long-term variation of storm surge-associated waves in the Bohai Sea
- Journal of Oceanology and Limnology, 37(6): 1868-1878
- http://dx.doi.org/10.1007/s00343-019-8257-z
Article History
- Received Sep. 22, 2018
- accepted in principle Mar. 11, 2019
- accepted for publication Apr. 19, 2019


2 College of Oceanic and Atmospheric Sciences, Ocean University of China, Qingdao 266100, China;
3 Laboratory of Marine Environment and Ecology, Ocean University of China, Qingdao 266100, China
Waves that generated by winds include wind waves, surges, and the mixed waves, are one of the most important dynamic processes in the ocean. Storm surges are a process when abnormally high or low sea surface levels are reached because of severe atmospheric disturbances, such as strong winds and abrupt changes in air pressure (Feng, 1982). Storm surges, caused by strong winds such as typhoons, extratropical cyclones, and cold air, are often accompanied by billowing waves. Furthermore, the interaction between currents and waves during storm surges is stronger, which should be considered in wave processes simulation (Xia et al., 2006). In recent years, more and more studies use the coupled model to simulate wave to consider hydrodynamics effects (e.g. Feng et al., 2016b; Xie et al., 2016; Ji et al., 2018). When a storm surge and a peak astronomical tide coincide, the result will be a powerful destructive surge that could endanger human life and cause serious economic loss to coastal cities. Some figures indicate that the disaster losses caused by waves in the world can account up for 10% of natural disaster losses (Yang et al., 1993). In general, when the height of waves reaches 4 to 5 m, major sea accidents may easily occur (Yang et al., 1993). Furthermore, the waves caused by storm surges can often overturn ships at the sea and block sea traffic, and powerful waves may reach the coast and destroy coastal engineering structures.
China is located on the west shore of the Pacific Ocean, and throughout history, her coast has frequently been affected by storm surges (Yang, 2000). The Bohai Sea (Fig. 1) is a semi-closed continental shallow sea and lies between 117°35′E– 122°10′E and 37°07′N–41°00′N. It is surrounded by Liaoning Province, Hebei Province, Tianjin, and Shandong Province to the north, west, and south, and connected to the Yellow Sea through the Bohai Strait. It covers nearly 78 000 km2 and reaches a maximum depth of 85 m. Its average depth is 18 m, though more than half of the total area is deeper than 20 m. Due to its mid-latitude, the Bohai Sea is not only affected by tropical storm surges caused by typhoons, but also by extratropical storm surges induced by the extratropical cyclones and cold air outbreaks. Moreover, the frequency of extratropical storm surges is higher than that for tropical storm surges (Zhao and Jiang, 2011; Feng et al., 2016a). As the waves of the Bohai Sea are driven by wind, almost all the billows occurring there are caused by cold air and typhoons (Xin, 1991; Yan et al., 1993; Deng et al., 2007).

|
| Fig.1 The bathymetry of the Bohai Sea Red dots denote the stations studied. |
Most coastal researches investigating the effects of extreme events focused on cold air and typhoons pay attention to the surge but ignore the role of billows. However, wave characteristics, especially the maximum height of waves, are important factors to be taken into account when designing coastal engineering projects and constructing waterways (Lü et al., 2014). Accurate wave prediction can provide early warning for navigation and marine fishing activities. Therefore, studying the wave characteristics associated with the storm surge process is very important for port navigation, disaster prevention and reduction, marine energy development, and marine engineering construction (Lü et al., 2014; Li et al., 2016). In previous studies, the wave characteristics of the Bohai Sea have been examined, but there is no conclusion about the long-term variation of waves associated with storm surge processes.
In Wang et al. (2018), the Simulating Waves Nearshore (SWAN) model of the third-generation wave simulation and the ADvanced CIRCulation (ADCIRC) model of the storm surge was coupled to establish a refined wave-current model in the Bohai Sea, and hazard analysis of destructive storm surges from 1985 to 2014 was presented. In this paper, we focus on the long-term analysis of wave characteristics using the same coupled model results.
A simple introduction to the coupled SWANADCIRC model is given in Section 2. Model setup, wind field, and wave model validation are described in Section 3. In Section 4, the trends of the waves with storm surge processes are shown, as well as the analysis of return periods and conditional probability. Finally, conclusions are drawn in Section 5.
2 MODEL DESCRIPTION 2.1 SWAN modelThe SWAN is a third-generation wave model designed for shallow water areas, developed by Booij et al. (1999). The model describes the temporal and spatial evolution of waves in the nearshore area. It has been widely used in recent years (Mazaheri et al., 2013; Akpınar et al., 2016).
Its basic equation in the Cartesian coordinate is (Booij et al., 1999):
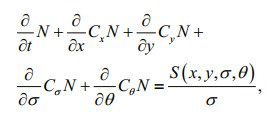 (1)
(1)where (x, y) is Cartesian coordinate; N(σ, θ) represents energy density, σ is relative frequency, θ is propagation direction; Cx, Cy are propagation velocities in physical space; Cσ, Cθ represent propagation velocities in spectral space; S(x, y, σ, θ) is an energy source term that consists of different sources.
 (2)
(2)where Sin stands for wind energy input; Sds consists of white capping Swc, bottom friction Sbot and depthinduced breaking Sbrk; Snl stands for wave energy transfer caused by nonlinear wave-wave interaction (Lü et al., 2014).
The model has the flexibility to allow researchers to choose the physical processes that the model needs, as well as the parameters of each physical process. The model can be solved by the fully implicit finite difference scheme, so it is unconditionally stable, and its time step can be larger, which enhances its ability to quickly obtain results when used for wave forecasting.
2.2 ADCIRC modelADCIRC model is a hydrodynamic model developed by the University of North Carolina, combined with unstructured grids, which can be applied to ocean, coast and estuary areas (Westerink et al., 1992).
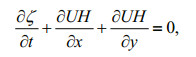
The ADCIRC basic equations in the Cartesian coordinate are:
 (3)
(3) (4)
(4)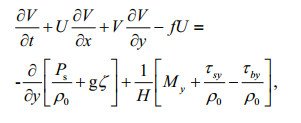 (5)
(5)where (x, y) is the Cartesian coordinate; ζ is the water surface elevation; U and V are the depth averaged velocities in the x and y directions; H=h+ζ represents total water depth, h is water depth relative to datum; f is the Coriolis parameter; Ps is the sea surface pressure; ρ0 is seawater density; g is the gravitational acceleration; Mx and My are horizontal momentum diffusion in x and y directions; τsx and τsy are the wind stress; τbx and τby are the bottom stress (Luettich and Westerink, 2004).
The ADCIRC adopts the Galerkin finite element method for spatial discretization and the finite difference method for time discretization, which significantly improves computational efficiency.
3 MODEL SETUP AND VALIDATION 3.1 Model setupFor the simulation, we adopted the calculation method of the two-way coupling between the ADCIRC and the SWAN model (Wang et al., 2018). In other words, the ADCIRC model calculates the hydrodynamic parameters and then passes them to the SWAN model, which calculates the waves according to the hydrodynamic parameters. After the calculation of the waves, the wave parameters are passed to the ADCIRC model and so on until the calculation is complete. In this way, the wave-current interaction is fully considered.
The model grid is nested including "parent" and "child" (Fig. 2). Both "parent" and "child" are forced by water levels. It is noticeable that the "parent" simulation is run by ADCIRC and driven by wind stress. The water level time-series at the "child" open boundary is then saved and used as a part of open boundary forcing in the coupled "child" simulation. In addition, the tidal elevation is also imposed at the open boundary of "child", which includes eight tidal constituents (M2, S2, N2, K2, K1, O1, P1, and Q1) from the OSU Tidal Prediction Software (Egbert et al., 1994); more information is available in Wang et al. (2018).

|
| Fig.2 The model grid a. "parent"; b. "child". |
As for the parameters in the SWAN model, there are 36 grids in the θ space, i.e. the resolution in spectral direction is 10°. The frequency is set in the range of 0.03–1.0 Hz, and the time step is 1 800 s. Apart from these, default values are adopted for the other relevant parameters.
3.2 Wind fieldIn this paper, we simulated 32 disaster storm surge processes that consisted of 22 extratropical cyclones or cold air fronts, and 10 typhoons from 1985 to 2014.
For the 22 processes of extratropical cyclones or cold air outbreaks, the ERA-Interim dataset in spatial resolution of 0.125°×0.125° and time resolution of 6 h is applied (http://apps.ecmwf.int/datasets/). It is found in Lü et al. (2014) and Wang (2013) that the ERA-Interim data underestimates the wind speed and stress in the Bohai Sea. The wind speed data were therefore increased by a factor of 1.38 following Wang (2013) and Wang et al. (2018).
It is also presented in Wang et al. (2018) that the wind field from the ERA-Interim dataset cannot depict exactly the typhoon event. Therefore, we chose Jelesnianski's circular typhoon model (Jelesnianski, 1965) to simulate 10 typhoon-induced surge processes. The relevant typhoon data were downloaded from the CMA-STI Best Track Database (tcdata.typhoon.org.cn, Ying et al., 2014). For details please refer to Wang et al. (2018).
3.3 Wave model validationBecause the validation of storm surge has been given in Wang et al. (2018), we simply present the validation of wave characteristics in this paper. Two strong extratropical storm surges and a typhoon storm surge occurred along the coast of the Bohai Sea are simulated. For extratropical storm surges, one occurred between August 31 and September 1, 2011, while the other lasted from September 30 to October 2, 2015. For typhoon storm surge, the 10th typhoon Matmo in 2014 was simulated, which occurred in July. The simulation of both waves and flow field were started two days earlier.
From Fig. 3a–d, it can be seen that the simulated SWH and mean wave period agree well with the observations at both Beihuangcheng and Dongyinggang stations. The maximum absolute error of the maximum SWH was 24.9 cm at Dongyinggang. Additionally, the SWH correlation coefficients of Beihuangcheng and Dongyinggang were 0.91 and 0.93 respectively. As for the mean wave period from 00:00, 2011-08-31 to 23:00, 2011-9-2, the maximum absolute error was 0.9 s at Beihuangcheng. Meanwhile, the simulated results of SWH and the mean wave period from 00:00, 2015-09-29 to 23:00, 2015-10-2 are consistent with the observation. The maximum absolute error of the simulated maximum SWH was 50.7 cm at the Longkou station. Furthermore, the SWH correlation coefficients of Longkou and Dongyinggang were 0.90 and 0.85. As for the mean wave period, the maximum absolute error was 0.7 s at Longkou. In addition, Fig. 3i–l shows the wave characteristics of simulation and observation during a typhoon storm surge Matmo. It can be seen that variations in SWH and mean wave period were consistent for both Beihuangcheng and Dongyinggang. For the Beihuangcheng station and Dongyinggang station, the maximum absolute error of the maximum SWH was 53.0 cm at Beihuangcheng. Furthermore, the SWH correlation coefficients of Beihuangcheng and Dongyinggang were 0.96 and 0.78, respectively. As for the mean wave period during a typhoon, the maximum absolute error was 0.5 s at Beihuangcheng. Therefore, it is believed that the wave-current coupled model can well reproduce the wave features associated with storm surge events.

|
| Fig.3 Wave characteristics of simulation (blue dotted line) and observation (orange dot) Beihuangcheng (a, c) and Dongyinggang (b, d) stations from 00:00, 2011-08-31; Longkou (e, g) and Dongyinggang (f, h) from 00:00 2015-09-30; Beihuangcheng (i, k) and Dongyinggang (j, l) stations from 00:00, 2014-07-23 for the typhoon process Matmo. |
The distribution of SWH extremes is of great importance to engineering construction. In this section, trends in SWH extremes along the Bohai Sea coast are calculated and analyzed. Because the waves associated with extratropical storm surges and those associated with tropical storm surges take on different features and have different effects on the Bohai Sea, trends in SWH extremes are calculated according to extratropical storm surges, tropical storm surges and all storm surges. It should be noted that some of the 22 extratropical storm surges occurred in the same year. Consequently, we chose the annual maximum SWH at one station as its extreme SWH for that year. The 175 red dots marked in Fig. 4 refer to the measuring stations used to study the trends in SWH extremes associated with storm surges.

|
| Fig.4 Distribution of stations that used to study trends in SHW extremes Point 1 to Point 175 along the Bohai Sea are the order of the x-axis in Fig. 5. |
According to Feng et al. (2018), we used a similar regression analysis to calculate trends in SWH extremes around the Bohai Sea.
The regression model is:
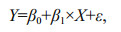 (6)
(6)where Y represents the SWH extreme at corresponding year X; β0 is intercept; slope β1 is the trend of SWH extreme; ε is the error term. The confidence level of the corresponding trends can be obtained by statistical significant tests.
From Fig. 5a, we see that there is a negative trend of SWH with a confidence level more than 50% and that the largest negative trend of the SWH extreme is -0.03 m/a at the 99% confidence level at the west of Liaodong Bay (40.6°N, 120.8°E). However, there are also some areas where there is a positive trend of the SWH, and the largest positive trend of the SWH extreme is 0.01 m/a at the 24% confidence level at the northwest of Laizhou Bay (37.8°N, 119.2°E). The trend of SWH extremes in Fig. 5c has the same trend as in Fig. 5a, and there is only a slight difference at individual points. Almost all stations' show a negative trend of SWH extremes, and the largest negative trend of the SWH extreme is -0.04 m/a at 99% confidence level. The SWH extreme induced by extratropical storm surge processes presents a trend where the SWH has been decreasing year by year. The position of the largest negative trend of the SWH extreme associated with extratropical storm surges is also located in the west of Liaodong Bay. As for Fig. 5e, the trend of SWH extremes associated with tropical storm surge processes is different from the former. The trend of SWH extremes with a confidence level greater than 50% is positive, and the largest positive trend is 0.04 m/a at a 63% confidence level at the northwest of Laizhou Bay.

|
| Fig.5 Trends in SWH extremes (a, c, e) and the corresponding significance test results (b, d, f) for the 175 selected stations around the Bohai Sea The upper panel is the result of all the storm surges; the middle one is that of extratropical storm surges; and the lower is that of tropical storm surges. |
In order to better show the trend of the SWH extremes of the Bohai Sea coast, we selected the data points with more than 95% confidence in the 175 points, and after averaging and linear regression, we got the time series plots of the mean SWH extremes induced by all storm surge (Fig. 6a) or by only extratropical storm surge (Fig. 6b). The trend of the SWH extremes in the former condition is -0.03 m/a, while in the latter one is -0.04 m/a. Overall, we can find that the negative trend is obvious, and the negative trend of the SWH extremes caused by the extratropical storm surges storm is greater than the SWH extreme trend caused by all storm surges.

|
| Fig.6 Linear regression analysis for SWH extremes from 1985 to 2014 a. the red dots are the mean SWH extremes with a confidence level of more than 95%. The red linear trend is the results from the regression equation induced by all storm surges; b. the black dots are the mean SWH extremes with a confidence level of more than 95%. The black linear trend is the results from the regression equation induced by extratropical storm surges. |
From the above results, the trend of SWH extremes associated with extratropical storm surges is significantly different from the trend of SWH extremes associated with tropical storm surges. Most trends of SWH extremes associated with tropical storm surge processes are positive with the confidence level more than 50%; however, most trends of SWH extremes associated with extratropical storm surge processes are negative with the confidence level of 90%. The correlation coefficient between the trend induced by storm surge processes and that induced by extratropical storm surge processes is 0.74. It is suggested that SWH extremes along the Bohai Sea coast was mainly affected by cold air and extratropical cyclones, and tended to fall year by year.
4.2 Calculation of significant wave height extremesIn this part, the Gumbel method was used to calculate the 100-year return period of the SWH. In order to compare the most probable distribution of SWH caused by different types of storm surge processes in the Bohai Sea, we respectively calculated the 100-year return period SWH extreme distribution induced by tropical storm surge processes (Fig. 7a), induced by the extratropical storm surge processes (Fig. 7b), and induced by all storm surge processes (Fig. 7c). Furthermore, in order to better compare the 100-year return period SWH extreme distribution caused by the extratropical storm surge with that caused by the tropical storm surge, we plotted the difference between them (Fig. 7d).

|
| Fig.7 The 100-year return SWH distribution a. caused by tropical storm surges; b. caused by extratropical storm surges; c. caused by all of the storm surges; d. the SWH difference between extratropical and tropical storm surges. |
From Fig. 7a, we find that the 100-year return SWH extreme decreases from the Bohai Strait fanning out to the coast of the Bohai Sea. The SHW extreme of Bohai Bay, Laizhou Bay, and Liaodong Bay is 1 m, significantly lower than that of the Bohai Strait (8 m). However, the 100-year return SWH distribution (Fig. 7b) caused by extratropical storm surges is noticeably different from the former. The maximum SWH extreme is about 9 m in the central Bohai Sea, and the SHW then decreases from the central Bohai Sea to the shore. Although there are differences in the location of maximum SWH extremes, the variation trend of the SWH along the coast of the Bohai Sea is similar to that of tropical storm surges. Figure 7d shows the 100-year return SWH difference between extratropical and tropical storm surges. It is found that most of the Bohai Sea area shows a cold color, which means, the 100-year return SWH extreme caused by the extratropical storm surge is greater than that caused by the tropical storm surge, but in the coastal area of the three bays, the former SWH extremes are weaker than the latter one. As for the SWH extreme distribution during all storm surges (Fig. 7c), it is largely the same as Fig. 7b except for the difference in the central Bohai Sea.
The distribution features obtained for all SWH extremes agree well with previous studies (Deng et al., 2007; Sun et al., 2013): SWH extremes gradually decrease from the middle of the Bohai Sea to the coast. The contours are overall parallel to the shoreline. However, extreme SWH values are different when compared. For example, our maximum SWH extreme is approximately 8 m in the southeastern part of the central Bohai Sea, which is 1.3 m higher than the calculation made by Deng et al. (2007). The difference in numerical values may be due to the following factors. First, the time range and length of the simulation are different. Sun et al. (2013) and Deng et al. (2007) simulated waves in the Bohai Sea for 20 years from 1985 to 2004; we simulated waves for 30 years from 1985 to 2014. It is also important to note that we simulated waves during disastrous storm surges only and emphasized the waves associated with storm surges, while Sun et al. (2013) and Deng et al. (2007) simply simulated waves for 20 consecutive years. The result of this is that the annual maximum values of SWH may be different. Second, mathematical statistical analysis used to calculate return periods is different. We used the Gumbel method, while Sun et al. (2013) used the Weibull distribution to calculate the 100-year return period SWH extreme.
A comprehensive comparison of the 100-year return SWH distribution results of the three scenarios (Fig. 7a–c) shows that the 100-year return SWH extremes caused by tropical storm surges are significantly smaller than that caused by extratropical storm surges. In other words, the impact of typhoons on the Bohai Sea is much less than that of cold air and extratropical cyclones. This is mainly because the Bohai Sea is located in higher extratropical latitudes, and typhoons have a difficulty going far into the Bohai Sea. Even though some individual typhoons can reach the Bohai Sea, their intensities have greatly weakened. In contrast, the Bohai Sea is close to the source of cold air, so extratropical cyclones and cold air can have a great influence on the Bohai Sea. Moreover, the SWH extremes caused by typhoons are concentrated near the Bohai Strait, while the SWH extremes caused by cold air and extratropical cyclones are mainly concentrated in the central Bohai Sea.
4.3 Conditional probability distributionMany studies have proposed that hydrodynamics have an influence on wave propagation (Tolman, 1991; Dietrich et al., 2011, 2012; Feng et al., 2012; Bhaskaran et al., 2013). As for the storm surge process, there are two particularly important factors: waves and surges, and the interaction between hydrodynamic forces and waves during storm surges are stronger than such interactions when there are no storm surge events. Therefore, we further calculated the wave-surge joint probability distribution using the Gumbel-logistic method (Wang et al., 2018) to yield the SWH extreme distribution of the 100-year return period in the Bohai Sea when the surge elevation is 1 m.
From Fig. 8, we can find that the higher SWH extreme is near the Huanghe (Yellow) River estuary and in the northern Bohai Sea Strait when the surge elevation reaches 1 m. The maximum value of extreme SWH can reach 8 m. Due to the maximum surge elevation being set as 1m for the entire Bohai Sea, the higher SWH extremes in Fig. 8 means that in the joint probability of wave and surge, waves have a greater impact. Consequently, waves have been most significant in the area near the Huanghe River estuary and the northern Bohai Strait. This is because the main factors affecting the waves in the Bohai Sea are the water depth and the wind field (Deng et al., 2007). The water depth of about 80 m in the northern Bohai Strait is deeper than the water in other areas, and the SWH extremes in the Bohai Strait are dominated by typhoon storm surge processes as described in Section 4.2. Because of this, waves dominate there. As for the Huanghe River estuary, which is shallow with water only 5 m deep, the frequent high winds from the northeast due to the flow of cold air will induce waves to build at the area near the Huanghe River estuary, causing the area to be more affected by waves. Thus, the winds caused by cold air and extratropical cyclones may be the main reason that waves dominate the wave-surge joint probability in the Huanghe River estuary.

|
| Fig.8 The SWH extreme distribution in the Bohai Sea when the maximum surge elevation reaches 1 m |
To study the long-term wave characteristics associated with storm surges in the Bohai Sea, data of 1985–2014 were analyzed in an unstructured grid wave-current coupled model, and 32 storm surges including 22 extratropical ones and 10 tropical ones were simulated, and the wave model SWAN and the hydrodynamic model ADCIRC were validated. The results of the simulation agree well with actual measurements.
By analyzing the trends of SWH extremes along the Bohai Sea coast, we find that the trend in SWH caused by extratropical storm surges is remarkably different from that caused by tropical storm surges. Most trends of SWH associated with tropical storm surges are positive in confidence level greater than 50%. However, most trends of SWH associated with extratropical storm surges are negative in confidence level of 90%. The trends of SWH along the Bohai Sea coast are mainly affected by cold air and extratropical cyclones, which shows a falling trend year by year.
Moreover, the 100-year return period SWH extremes associated with extratropical, tropical, and all storm surges were obtained using the Gumbel method. In general, the 100-year return period for SWH extremes caused by typhoons decreases from the Bohai Strait to the coast of the Bohai Sea, while that caused by cold air and extratropical cyclones decreases from the central Bohai Sea to the shore. The typhoon-induced maximum SWH extreme of about 8 m is located in the Bohai Strait, while that caused by cold air and extratropical cyclones is located in the central Bohai Sea and is about 9 m. Compared with typhoons, cold air and extratropical cyclones have a greater impact on the SWH extremes in Bohai Sea.
The 100-year return period joint probability in the northern Bohai Sea Strait is dominated by waves due to depth of water and typhoon wind field, and that in the area near the Huanghe River estuary is dominated by waves due to wind field of cold air and extratropical cyclones. The SWH extremes in Laizhou Bay, Bohai Bay, and Liaodong Bay are relatively small, and the joint probability is dominated by wave and surge.
The knowledge of the SWH extremes obtained in this study shall be useful for port navigation, disaster prevention, and reduction, marine energy development, and marine engineering construction.
6 DATA AVAILABILITY STATEMENTAll data generated and/or analyzed during this study are available from the corresponding author on reasonable request.
Akpınar A, Bingölbali B, van Vledder G P. 2016. Wind and wave characteristics in the Black Sea based on the SWAN wave model forced with the CFSR winds. Ocean Eng., 126: 276-298.
DOI:10.1016/j.oceaneng.2016.09.026 |
Bhaskaran P K, Nayak S, Bonthu S R, Murty P L N, Sen D. 2013. Performance and validation of a coupled parallel ADCIRC-SWAN model for THANE cyclone in the Bay of Bengal. Environ. Fluid Mech., 13(6): 601-623.
DOI:10.1007/s10652-013-9284-5 |
Booij N, Ris R C, Holthuijsen L H. 1999. A third-generation wave model for coastal regions:1. Model description and validation. J. Geophys. Res.:Oceans, 104(C4): 7 649-7 666.
DOI:10.1029/98JC02622 |
Deng Z Q, Zhou L M, Wu L Y, Guo P F. 2007. Numerical computation of wave heights of multiyear return periods in the Bohai Sea. Trans. Oceanol. Limnol., (S1): 8-14.
(in Chinese with English abstract) |
Dietrich J C, Tanaka S, Westerink J J, Dawson C N, Luettich Jr R A, Zijlema M, Holthuijsen L H, Smith J M, Westerink L G, Westerink H J. 2012. Performance of the unstructuredmesh, SWAN+ADCIRC model in computing hurricane waves and surge. J. Sci. Comput., 52(2): 468-497.
DOI:10.1007/s10915-011-9555-6 |
Dietrich J C, Zijlema M, Westerink J J, Holthuijsen L H, Dawson C, Luettich R A, Jensen R E, Smith J M, Stelling G S, Stone G W. 2011. Modeling hurricane waves and storm surge using integrally-coupled, scalable computations. Coast Eng., 58(1): 45-65.
DOI:10.1016/j.coastaleng.2010.08.001 |
Egbert G D, Bennett A F, Foreman M G G. 1994. TOPEX/POSEIDON tides estimated using a global inverse model. J. Geophys. Res. Oceans, 99(C12): 24 821-24 852.
DOI:10.1029/94JC01894 |
Feng J L, von Storch H, Weisse R, Jiang W S. 2016a. Changes of storm surges in the Bohai Sea derived from a numerical model simulation, 1961-2006. Ocean Dyn., 66(10): 1 301-1 315.
DOI:10.1007/s10236-016-0986-3 |
Feng S Z. 1982. Introduction to Storm Surge. Science Press, Beijing. 241p. (in Chinese)
|
Feng X B, Zheng J H, Yan Y X. 2012. Wave spectra assimilation in typhoon wave modeling for the East China Sea. Coast Eng., 69: 29-41.
DOI:10.1016/j.coastaleng.2012.05.007 |
Feng X R, Li M J, Yin B S, Yang D Z, Yang H W. 2018. Study of storm surge trends in typhoon-prone coastal areas based on observations and surge-wave coupled simulations. Int. J. Appl. Earth Obs. Geoinf., 68: 272-278.
DOI:10.1016/j.jag.2018.01.006 |
Feng X R, Yin B S, Yang D Z. 2016b. Development of an unstructured-grid wave-current coupled model and its application. Ocean Model., 104: 213-225.
DOI:10.1016/j.ocemod.2016.06.007 |
Jelesnianski C P. 1965. A numerical calculation of storm tides induced by a tropical storm impinging on a continental shelf. Mon. Wea. Rev., 93(6): 343-358.
DOI:10.1175/1520-0493(1993)093<0343:ANCOS>2.3.CO;2 |
Ji C, Zhang Q H, Wu Y S. 2018. An empirical formula for maximum wave setup based on a coupled wave-current model. Ocean Eng., 147: 215-226.
DOI:10.1016/j.oceaneng.2017.10.021 |
Li X, Wang Z F, Wu S Q, Dong S, Jia J, Zhang X S, Wu H. 2016. Application of the surface wave and storm surge coupled model in Tianjin coastal areas. Mar. Sci. Bull., 35(6): 657-665.
(in Chinese with English abstract) |
Lü X C, Yuan D K, Ma X D, Tao J H. 2014. Wave characteristics analysis in Bohai Sea based on ECMWF wind field. Ocean Eng., 91: 159-171.
DOI:10.1016/j.oceaneng.2014.09.010 |
Luettich R A, Westerink J J. 2004. Formulation and numerical implementation of the 2D/3D ADCIRC finite element model version 44.XX. https://adcirc.org/files/2018/11/adcirc_theory_2004_12_08.pdf. Accessed on 2019-06-04.
|
Mazaheri S, Kamranzad B, Hajivalie F. 2013. Modification of 32 years ECMWF wind field using QuikSCAT data for wave hindcasting in Iranian Seas. J. Coast. Res., 65(sp1): 344-349.
|
Sun X J, Zhou L M, Wang A F, Wang Z F, Wu L Y. 2013. Study on the wave extreme parameters of the Bohai Sea with the numerical simulation using SWAN. Mar. Sci. Bull., 15(1): 16-26.
|
Tolman H L. 1991. Effects of tides and storm surges on North Sea wind waves. J. Phys. Oceangr., 21(6): 766-781.
DOI:10.1175/1520-0485(1991)021<0766:EOTASS>2.0.CO;2 |
Wang D S. 2013. Numerical Study on Characteristics of Water Exchange and Sediment Transport in Bohai Bay. Tianjin University, Tianjin. 86p. (in Chinese with English abstract)
|
Wang Y P, Mao X Y, Jiang W S. 2018. Long-term hazard analysis of destructive storm surges using the ADCIRCSWAN model:a case study of Bohai Sea, China. Int. J.Appl. Earth Obs. Geoinf., 73: 52-62.
DOI:10.1016/j.jag.2018.03.013 |
Westerink J J, Luettich R A, Baptists A M, Scheffner N W, Farrar P. 1992. Tide and storm surge predictions using finite element model. J. Hydraul. Eng., 118(10): 1 373--1 390.
DOI:10.1061/(ASCE)0733-9429(1992)118:10(1373) |
Xia B, Zhang Q H, Yang H. 2006. Influence of hydrodynamic factors on nearshore wind waves-the southwest coast of the Bohai Bay as an example. Mar. Sci. Bull., 25(5): 1-8.
(in Chinese with English abstract) |
Xie D M, Zou Q P, Cannon J W. 2016. Application of SWAN+ADCIRC to tide-surge and wave simulation in Gulf of Maine during Patriot's Day storm. Water Sci.Eng., 9(1): 33-41.
|
Xin B H. 1991. Introduction to High Winds in the Yellow and Bohai Seas. China Meteorological Press, Beijing. 192p.(in Chinese)
|
Yan J Y, Chen C J, Zhang X Z, Huang A F. 1993. China Offshore Climate. Science Press, Beijing. 600p. (in Chinese)
|
Yang G S. 2000. Historical change and future trends of storm surge disaster in China's coastal area. J. Nat. Dis., 9(3): 23-30.
(in Chinese with English abstract) |
Yang H T, Tian S Z. 1993. The Compilation of 40 Years of Marine Disasters in China (1949-1990). Ocean Press, Beijing. 288p. (in Chinese)
|
Ying M, Zhang W, Yu H, Lu X Q, Feng J X, Fan Y X, Zhu Y T, Chen D Q. 2014. An overview of the China meteorological administration tropical cyclone database. J. Atmos.Oceanic Technol., 31(2): 287-301.
DOI:10.1175/JTECH-D-12-00119.1 |
Zhao P, Jiang W S. 2011. A numerical study of storm surges caused by cold-air outbreaks in the Bohai Sea. Nat.Hazards., 59(1): 1-15.
DOI:10.1007/s11069-010-9690-7 |