 2019, Vol. 37
Institute of Oceanology, Chinese Academy of Sciences
Article Information
- LIU Yueming, YANG Xiaomei, WANG Zhihua, LU Chen, LI Zhi, YANG Fengshuo
- Aquaculture area extraction and vulnerability assessment in Sanduao based on richer convolutional features network model
- Journal of Oceanology and Limnology, 37(6): 1941-1954
- http://dx.doi.org/10.1007/s00343-019-8265-z
Article History
- Received Sep. 25, 2018
- accepted in principle Jan. 11, 2019
- accepted for publication Mar. 18, 2019


2 State Key Laboratory of Desert and Oasis Ecology, Xinjiang Institute of Ecology and Geography, Chinese Academy of Sciences, Urumqi 830011, China;
3 University of Chinese Academy of Sciences, Beijing 100049, China;
4 Jiangsu Center for Collaborative Innovation in Geographical Information Resource Development and Application, Nanjing 210023, China
China's sea area is very large, with a coastline of 18 400 km, including tropical and subtropical waters (Guan and Wang, 2005). About 8 346.3 thousand hectares of aquaculture waters exist within this coastline and provide huge economic benefits for China. Basic information, such as spatial distribution and area of the aquaculture area, can be used to estimate the aquaculture production value in a given year, which informs governmental planning and adjustment of the aquaculture industry. These basic data also provide background information for future investigations and may help management cope more effectively with sudden water quality and storm surge disasters. For aquaculture areas, the most threatening natural disasters are storm surges. The storms and huge waves caused by storm surges may cause devastating blows to aquaculture areas, seriously threatening the lives and economic assets of coastal residents. Accurately grasping the distribution and quantity of the aquaculture area can classify the vulnerability of the aquaculture area, and focus on the protection of the highly vulnerable areas, which can effectively reduce the damage caused by the storm surge disaster to the marine aquaculture area. The distribution of aquaculture areas is generally extensive, and it is difficult to obtain complete and accurate information by using conventional manual survey methods. High-scoring remote-sensing technology is capable of covering a wide observation area with high imaging precision and thus is suitable for extraction of aquaculture areas.
At present, research regarding the recognition and extraction of aquaculture areas based on highresolution remote-sensing images can be divided into several categories (Cheng et al., 2012): visual interpretation based on expert experience (Li et al., 2006; Fan et al., 2005), extraction based on texture information (Zhu et al., 2011; Liu and Du, 2012), extraction based on ratio index analysis (Lu et al., 2015; Wang et al., 2018), extraction based on correspondence analysis (Wang and Gao, 2008), extraction based on spatial structure and shape analysis (Zhou et al., 2006; Wang et al., 2017), objectoriented extraction (Xie et al., 2009), and data mining and artificial intelligence methods (Chu et al., 2012), among others.
The above methods have high extraction precision for a certain range of aquaculture areas. It performs well when applied to small-scale identification of types of aquaculture areas and their distribution and area. In practical application, however, it is often necessary to investigate and analyze all aquaculture areas throughout the region. As the application area expands, complications arise. In general, three complications arise with large-scale extraction of aquaculture areas. (1) The type of aquaculture is not singular, and more than one type of aquaculture exists in a large range of cultured sea areas. This can arise, for example, if one part of the aquaculture area is characterized by the presence of rafts, whereas another part is characterized by cages. The farming principles and construction materials of the two aquaculture areas are different, resulting in large differences in remote-sensing images, and extracting these two different aquaculture types by a single highprecision method is difficult. (2) The seawater background becomes more complex. Aquaculture areas are mostly distributed in the coastal areas, such as the bay and the estuary. Although this proximity to land makes it is easy to manage, coastal conditions are naturally more complex, particularly when natural terrain is used as a barrier to resist wind and waves. In windy and wavy conditions, sediment and chlorophyll content around the aquaculture area are high and affect the spectrum of seawater. This is then reflected in the remote-sensing image as a color tone change of the seawater background. Additionally, very windy conditions cause swells in the seawater, and these waves cause local specular reflection, resulting in small dense and dark stripes on the remote-sensing image. Because of the wide distribution area, these image distortions tend to occur locally. If threshold segmentation is used to extract the aquaculture area, these distortions can make it more difficult to determine an appropriate threshold and can affect the extraction accuracy. (3) The spectrum of the crops in the aquaculture area is temporally variable. Although it is easy to distinguish the difference between the background and agriculture area at different growth stages for farmland crops, raft aquaculture areas are located below the water surface. When these crops are immature, the difference between the raft aquaculture area and the background seawater is small and hard to discern. As the crop matures, the difference between its spectral characteristics and seawater gradually increases, reaching a maximum at harvest. The general approach is to use the remote-sensing image at harvest to identify and extract the aquaculture area. However, this necessity imposes higher requirements on the phase of remote-sensing images. When the remote-sensing images are acquired too far ahead of harvest time when the crops are not mature, the extraction accuracy will be reduced significantly. Moreover, because of large-scale breeding, raft aquaculture areas are often at different growth stages within a single aquaculture area, which can cause the same objects (i.e., raft aquaculture areas) to exhibit different spectra because of their different growth stages, thus making it difficult to identify and extract the true aquaculture area.
Because of these problems, most of the methods mentioned earlier cannot achieve sufficient extraction results. Among the available methods, there is only one object-oriented method. Separating the target object by applying select conditions in advance can overcome the noted complications to a certain extent, but the scale and parameters of the segmentation remain difficult to determine (Wang et al., 2016; Zhang et al., 2016). In the extraction stage after segmentation, it is also necessary to define the extracted features. To achieve good results, it is often necessary to make several adjustments, which can make the process cumbersome (Blaschke et al., 2014; Chen et al., 2018).
In recent years, with advancements in big data and the development of high-performance computing, deep-learning has gradually become more visible, achieving high-level results in the fields of computer vision, speech recognition, and natural language processing. The accuracy of deep learning in image recognition has surpassed that of humans (He et al., 2015) and high-performance deep-learning applications to image recognition provide new opportunities to improve remote-sensing image extraction of aquaculture areas. Deep-learning models simulate the process of the human brain to identify objects without the need to define features in advance. Through samples iterations that train the model parameters, the computer automatically learns the characteristics of a given object and thus can learn to identify the target object. Therefore, it is not necessary to divide the aquaculture areas according to sea state and growth phase, but rather, as long as samples of each aquaculture area are correctly labeled, the automatic extraction of the aquaculture area can be realized by computer iterative training. The spectral characteristics of the aquaculture area vary with the growth state, but the edge characteristics are obvious in different seawater backgrounds and during different growth phases. Cage aquaculture areas are above the water surface and the boundaries are more obvious. This study first extracted the edge of the aquaculture area and then acquired the target of the aquaculture area. Among deep-learning models, the Richer Convolutional Features (RCF) network model performs excellently in image edge detection in both speed and accuracy (Liu et al., 2017). Therefore, in this study, we used the RCF model to extract the aquaculture area in the entire sea area of Sanduao, Ningde City, Fujian Province, China and conducted vulnerability analysis to obtain a vulnerability distribution map. The specific operation process and final extraction results and precision are explained in detail in the following section.
The objectives of this study mainly include the following two points: (1) using RCF to achieve largescale high-precision automatic extraction of aquaculture areas, and (2) conduct aquaculture area vulnerability assessment in Sanduao.
2 DATA 2.1 Study areaSanduao is located in the southeastern part of Ningde City, Fujian Province, in southern China at 26°30′-26°58′N and 119°26′–120°10′E. It is a semi-closed harbor with a sea area of 714 km2 (Huang et al., 2002). Sanduao is China's largest cage aquaculture base for Pseudosciaena crocea. It also houses the large-scale breeding of kelp, abalone, and is an important aquaculture area in China (Ji and Zhou, 2012).
There are two types of aquaculture areas in the experimental area: cage and raft. Cage aquaculture areas are characterized by cages floating above the water surface in Fig. 1; they are a grayish-white color and mainly are used for fish and shrimp. Raft aquaculture areas mainly culture kelp, seaweed, and mussels, and they are composed of two parts: floating rafts and underwater cables. The floats on the water surface are connected by ropes to form a floating raft. One end of the underwater cable is connected to the floating raft, and the other end is connected to a sinker to keep sufficient distance between the cables to prevent entanglement and knotting. The crops in the raft culture areas are attached to the underwater cable, the reflectivity is lower than that of the seawater background, and the rafts often are arranged together. The raft aquaculture area has a dark rectangular strip on the image as a whole, and the color tone is uniform.

|
| Fig.1 Sanduao aquaculture area, Ningde City, Fujian Province, China |
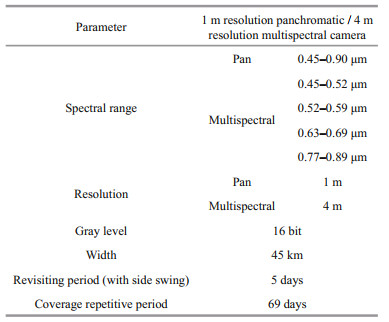
The data used in this paper are image data captured by China's high-resolution satellite, GF-2, and satellite parameters are shown in Table 1. The full coverage of Sanduao waters requires nine scenes of GF-2 images. The acquisition time of the images is six scenes on April 14, 2017, and three scenes on May 28, 2017. After fusion processing, the resolution is 1 m, which clearly identified the target of the aquaculture area in the image.
The overall operation process is shown in Fig. 2. It can be summarized in three stages: sample making, model training, and post-processing. After data preprocessing, the first stage of sample making consisted of sample selection, truth production creation, sample augmentation, and matching of samples to true values. During the model stage, after the parameters were set, the model was trained and then applied to the remotesensing image to obtain a boundary probability map of the aquaculture area. During the post-processing stage, the boundary probability map was transformed into the boundary of the vector aquaculture area in ArcGIS, and then the boundary of the aquaculture area was transformed into the area object to obtain the final seawater aquaculture area extraction result. After post-processing, the accuracy of the extraction results was verified.

|
| Fig.2 Flow chart of aquaculture area extraction using RCF model |
The reason for extracting the boundaries of the aquaculture area at the beginning without extracting the polygons is that the background of the aquaculture areas is seawater, and the spectrum of seawater is relatively uniform. The spectral information changes greatly at the boundary of the aquaculture areas, and the gradient changes obviously. Therefore, this study mainly uses the edge features of the aquaculture areas to extract it.
3.2 Data pre-processingTo apply satellite data to the model, the data need to be pre-processed, including image correction, image fusion, image cropping, and image normalization and band selection. First, we used the Rational Polynomial Coefficient model to spatially correct the image. Second, we used the Pansharp model to fuse the pan and multispectral data of GF-2 and to adjust the spatial resolution of the image after fusion reached 1 m, which was inclusive of blue, green, red, and near-infrared bands. The deep-learning model originally had been used to process computer images, so we converted the satellite image to 8-bit format, and the image of the input model contained only three RGB channels. Therefore, we had to screen the four bands of the original image and select the three bands with the largest amount of information on the aquaculture area. Through the band analysis, this study selected the green band, red band, and a nearinfrared band of GF-2 satellite data as the input bands of the deep-learning model.
3.3 Deep learningDeep learning is a deep structured neural network that can extract image features better than shallow neural structures, such as artificial neural networks and support vector machines (SVMs). In remotesensing image interpretation and classification, the quality of features often determines the quality of classification results, and the high-quality features obtained by deep learning are the key to achieving high-precision classification results.
3.4 The RCF modelRCF model is a deep-learning network model for identifying edges. Its prototype is the classical convolutional neural network model VGG16 (Simonyan and Zisserman, 2014). The RCF consists of five stages, each of which contains multiple convolutional layers for extracting features, and each stratum is connected by a pooling layer (Fig. 3). By using the convolutional layer and the pooling layer, parameters and calculations can be reduced while retaining the main features of the original data, thus preventing overfitting and improving the generalization ability of the model. More important, it guarantees the invariance of features in translation, rotation, and scale. After the sample is input into the model, it is transmitted from the first stage through the fifth stage. After each stage, one edge feature map with the same size as the input image is obtained, and the loss function of the edge map and the true value is calculated. Finally, the model fuses the edge features of the five stages to obtain a comprehensive edge feature map and calculates the total loss function. Through repeated parameter iteration (training), the value of the loss function (i.e., the difference between the extracted edge feature and the sample's true value) is reduced to its smallest possible value to determine the model parameters, and the model then is used to extract the edge of the aquaculture area.

|
| Fig.3 RCF model structure diagram |
We took a sample at a size of 1 000×1 000 pixels, performed a human visual interpretation, and used the boundary of the hand-painted aquaculture area in ArcGIS as the true value. In this study, the edge of the aquaculture area was selected as the extraction object. Compared with the sample data of the polygons object, the sample size for the edge was smaller, so the relatively larger sample size could be selected to ensure the integrity of the edge and the diversity of the sea background. Ensuring that the extraction results are more reliable and more accurate, so the size of 1 000×1 000 was chosen, and excellent results were obtained in this study. When making samples, it is also because the idea of this study is to extract the edges of the aquaculture area, and RCF is a model of edge detection, so the sample is the edges of the aquaculture area instead of the polygons.
The quality of the deep-learning model training was closely related to the quality of the sample. The higher the sample quality, the sooner, and more easily the model converged, thus reducing training time. Conversely, when the sample quality was poor, the training time increased and high-precision extraction results may not be obtained. Therefore, the selection of high-quality samples was important. We divided the samples into positive samples and negative samples. A positive sample contained the extraction target (i.e., the target of the aquaculture area included in this study). Positive samples should include as many different seawater background features found in the study area as possible, including possible areas of sediment, chlorophyll, waves, and other factors. If the boundary of an aquaculture area is hand-painted, the remote-sensing image should be zoomed, and the sample should be constructed with an error not exceeding 3–5 pixels. A negative sample should not contain an aquaculture area. The main function of the negative sample was to distinguish nonculture area targets from the culture area and to prevent the trained model from misidentifying the nonculture areas as targets because of similar spectral characteristics. With the negative sample, the water and land separation operations required in the general method of extracting marine aquaculture areas could be omitted. It not only eliminated the need for water-land boundary data but also avoided the misidentification of aquaculture areas that are easily caused when water and land separation is incomplete. In this experiment, we took samples of the aquaculture area with two scenes in the nine-scene high-resolution remotesensing image and used the remaining images for the recognition and extraction of the aquaculture area using the trained deep-learning model. We took 41 positive samples from the raft aquaculture areas (red boxes in Fig. 4) and 15 positive samples from the cage aquaculture areas (yellow box in Fig. 4), and we took 29 negative samples (green box in Fig. 4). The sample distribution is shown in Fig. 4.

|
| Fig.4 Aquaculture area samples distribution map |
For the deep-learning model, the actual number of samples taken is much smaller than the number of samples required for model training. To prevent overfitting of the model, we augmented the samples. The augmentation method was as follows: all samples and their corresponding true values are scaled (magnified to 1.5 times the original size and reduced to 0.5 times the original size), horizontally flipped, and rotated (0°, 90°, 180°, 270°). After augmentation, the final number of samples in this study totaled 2 040 (85 original samples × 3 scaling factor × 2 flipping factor × 4 rotational factor, Fig. 5).

|
| Fig.5 Aquaculture samples augmentation map |
Before we input the image into the model, we calculated the mean of all the pixels for each of the three channels and subtracted the mean of the pixels of the respective band need to be subtracted. We implemented the model using the deep-learning platform, Caffe. We set several key initial parameters, as follows: the initial learning rate was set to 1e-6, with a learning rate adjustment strategy of "step", a learning rate decay rate gamma of 0.1, a step size of 10 000, and a gradient update weight momentum of 0.9. To prevent overfitting, the weight attenuation ("weight_decay") was set to 0.000 2. The number of iterations was 20 000 times after the loss was observed and the training time was about 36 h. The hardware configuration was a single graphics card, with a type of GTX1070 GPU.
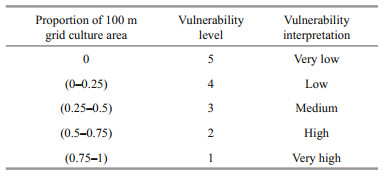
3.7 Vulnerability classification methodThe term vulnerability was first applied in the field of geosciences and natural disaster research and was interpreted as the extent to which a system suffered from catastrophic events (Lahsen et al., 2010; Romieu et al., 2010). In this paper, based on the density, thevulnerability of aquaculture areas is divided. The classification principle is as Table 2.
Taking the raft aquaculture area as an example, Fig. 6 shows the results of various stages of marine aquaculture area extraction using RCF. The boundary of the aquaculture area extracted by the model is shown in Fig. 6c as a probability gray scale of the boundary of the aquaculture area. The gray value range is 0–255. The larger the gray value of the pixel, the more likely the pixel is the boundary of the aquaculture area. The gray-scale boundary was vectorized and superimposed on the original data and the effect is shown in Fig. 6e. To verify the accuracy of the extraction results, we converted the vectorized linear aquaculture area boundary to a planar aquaculture area object in ArcGIS, and the surface aquaculture area object extraction result is shown in Fig. 6f.

|
| Fig.6 The process map of raft aquaculture area extraction a. Sanduao aquaculture area, Ningde City, Fujian Province, China; b. Green rectangular box area in (a); c. boundary probability map of raft aquaculture area in (b); d. boundary vectorization; e. raft aquaculture boundary; f. raft aquaculture area extraction result. |
The results of the marine aquaculture area in the entire bay of Sanduao are shown in Fig. 7. Yellow coloring denotes the raft aquaculture areas, and purple coloring denotes the cage aquaculture areas. It can be seen that the overall distribution of the Sanduao marine aquaculture area was characterized by more in the east, less in the west and intensive in the east, sparse in the west. Raft aquaculture covered a much larger area than cage aquaculture. The raft aquaculture areas mostly were located in open water surface, whereas the cage aquaculture areas tended to be closer to land.

|
| Fig.7 The extraction result of aquaculture areas in Sanduao |
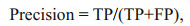
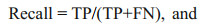
For accuracy verification, we selected eight rectangles of A–H, each of which was 3 000×3 000 pixels. To determine the true value of the sample, we visually interpreted the objects in these rectangles. The literature review did not find the specific aquaculture area information data in the experimental area. Therefore, the verification data in this paper is based on field research, combined with higherresolution Google satellite imagery, and obtained by visual interpretation. Ensure the authenticity and reliability of the verification data through the above methods. We tested the accuracy of the extraction results using three commonly used precision indicators, Precision, Recall, and F-measure, as follows:
 (1)
(1) (2)
(2) (3)
(3)where TP is the number of pixels in the aquaculture area that were correctly extracted, FP is the number of pixels in the aquaculture area that were not extracted, and FN is the number of pixels in the aquaculture area that was misidentified. In practice, the Precision and the Recall will conflict with each other to some extent, and so we introduced the F-measure. The F-measure is a combination of the Precision and the Recall. It is the harmonic average of the two evaluation methods and can be used to comprehensively evaluate the extraction results.
Table 3 shows the extraction accuracy of the two marine aquaculture areas in eight regions. The extraction Precision is >94%, the Recall is >90%, and the Precision is generally slightly higher than that of the Recall.

Figure 8 shows the extraction result and the accuracy map of the raft aquaculture area of four rectangular areas. The green part of the accuracy map represents the correctly extracted raft aquaculture areas, the red part represents the non-raft culture areas extracted by mistake, and the blue part represents aquaculture areas that were missed. It can be seen that among four areas, misidentification was rare, and the loss of precision was mainly caused by missed detection. The rectangular areas of A, B, and C in Fig. 8 are located in the remote-sensing image with the same scene as the sample collection, with higher precision and fewer missed detections. The missed detections mainly were caused by sediment interference in the water, immature crops in the aquaculture area, and weak spectral characteristics. Rectangular area D is located in a different remotesensing image than the sample collection area, and we extracted the raft aquaculture area in that scene solely by the trained RCF deep-learning model. Although the crops in the culture area were relatively mature and there was no sediment interference, it is evident that there was still a large leakage phenomenon.

|
| Fig.8 The accuracy map of the raft aquaculture area extraction A–D is the corresponding area in Fig. 7, mainly including the raft aquaculture area. |
Figure 9 shows the extraction results and accuracy of the cage aquaculture areas in E–H. The overall extraction accuracy exceeded 93%. As with the raft culture areas, error mostly was caused by missed detections, and misidentification was rare. The cage aquaculture area in area E of Fig. 9 was close to the coast, and a small number of cages were connected to the coast. For this cage target, the model failed to extract the complete aquaculture area edge, and some of the coastlines were misidentified as the boundary of the cage aquaculture area.

|
| Fig.9 The accuracy map of cage aquaculture area extraction E–H is the corresponding area in Fig. 7, mainly including the cage aquaculture area. |
Note that the quality of the boundary probability image output by the RCF model was high for both the raft aquaculture area and the cage aquaculture area. Even in the missed-detection area of the final result, a clear boundary line could be seen on the boundary probability map. The vector boundary superimposed in the extraction result graph also showed the boundary of the misidentified aquaculture area, and the boundary was not lost in vectorization. Further analysis found a small break in the vectorization boundary of the aquaculture area of the missing part. As a result, the closed boundary was not formed on the boundary of the aquaculture area, thus causing missed detections. The boundary of the boundary probability map output may have had a point with a small gray value, which caused a boundary break in the vectorization process. If so, when the vector boundary was transformed into a planar culture area object, the culture area surrounded by unclosed borderlines could be lost. To address this problem, the extraction result and the boundary vector could be superimposed or the topology relationship could be verified in ArcGIS to monitor and repair it.
4.2 Vulnerability analysisAfter the aquaculture area is extracted, a grid is constructed based on the data of the aquaculture area, and the basic grid size is 100 m×100 m. The proportion of the area of aquaculture in each grid is calculated, and the aquaculture area in Sanduao according to the vulnerability level is classified as shown in Table 2. The results are presented in Fig. 10.

|
| Fig.10 Aquaculture areas vulnerability map The scale of vulnerability: 5: very low; 4: low; 3: medium; 2: high; 1: very high. |
In Sanduao, the aquaculture area in the east has the highest level of vulnerability, followed by the middle part, and the western part has a lower density and a lower level of vulnerability. Most of the fragile areas in the raft aquaculture area are concentrated in open areas, while the areas with high vulnerability in the cage culture area are close to the land. The reason for this difference is related to their respective farming principles. In order to make the kelp and other crops grow sufficiently, raft aquaculture requires a certain space and water depth. Space and water depth required for the cage is different from that of the raft aquaculture area. For the convenience of management, it is concentrated in the relatively nearshore area. According to the difference in vulnerability distribution, it is possible to take more targeted measures against disasters such as storm surges and reduce disaster losses.
4.3 Analysis and discussionThe use of the RCF deep-learning method to extract the Sanduao marine aquaculture area offered several advantages. First, based on edge extraction, we did not have to distinguish the type of aquaculture area in advance of the model run. The target of the RCF model detection was the boundary, so the identification process was the same for both of the aquaculture area types (raft and cage) in this study area. That is, the model was trained through the boundary sample of the aquaculture area, and then the trained model was used to identify the target of the large-scale aquaculture area. This model was easier to operate than object-oriented methods because it was not necessary to set different extraction features for different objects.
Second, the false alarm rate of the extraction result was low. Among the eight regions, both Precision and Recall were greater than 90%, with Precision greater than 94%. This performance indicated a low false alarm rate of the marine aquaculture area extracted by deep learning (i.e., misidentification was low). This is a distinct advantage over conventional methods that use threshold extraction because the interference of sediment, chlorophyll, and other substances in the background seawater make it difficult to effectively distinguish aquaculture areas from the background seawater and generally result in a high false alarm rate, even if the aquaculture area is enhanced by the ratio index.
Third, high-precision extraction of targets in a wide range of aquaculture areas can be achieved. For many conventional methods, the size of the target area is proportional to the difficulty of the extraction. The smaller the area, the more unique the type of features in the area, and the spectral fluctuations of the same species type are smaller. As the area increases, the types of features contained in the area increase; different objects with the same spectrum and the same objects with different spectra are more likely to occur, making it difficult to extract the target. Many methods that perform well in a small area experience a significant decrease in accuracy as the area increases. The area of Sanduao's sea is 714 km2, a relatively wide sea area. All areas covering this area require nine GF-2 remote-sensing images. There are many estuaries in the sea area, and the sediments near the coast and the estuary are relatively high. The sea area bordering the outer sea is more likely to produce large waves. For these reasons, the watercolor of the entire Sanduao sea is variable. It is difficult to use conventional methods to obtain good extraction results under this large area with an uneven background.
Using deep learning, we used sample learning to overcome these problems. For the aquaculture area in the sea area, we selected samples of the aquaculture area under various conditions (e.g., sand or swell), and because we obtained the true value of the sample by manual visual interpretation, the same process can be used for two different samples, and no further distinction is needed. For areas that were more likely to be confused with the aquaculture area because of different objects with similar spectra, we suppressed negative identification by adding negative samples. Therefore, as long as the sample selection is reasonable, through the training of the model, highprecision extraction of the breeding area target under complex background conditions can be realized without a manual setting.
Finally, the separation of water and land was not required, and external data were not required. Based on deep learning, we extracted marine aquaculture areas by collecting training samples and iterative model training. Compared with the method of threshold segmentation or SVM classification, our method eliminates the pre-processing steps of waterland separation of data in advance, no additional sealand boundary vector data are needed, and there is no need to use a water body ratio index to separate water and land. Instead, selecting a negative sample automatically removes the influence of the land area, simplifies the operation steps, and avoids the possibility of interference in the extraction of the target area as a result of incomplete separation of the water and land boundaries.
The methods in this study, however, do have some shortcomings. First, the boundary of the aquaculture area is not closed. Because the RCF generates a probability map of the boundaries of the aquaculture area rather than a continuous aquaculture area boundary, the boundary of the aquaculture area can be broken during vectorization at points at which the probability is low and the gray value is small. The state of discontinuity failed to form a closed aquaculture area boundary. The boundary of this fracture could not be successfully converted into a planar aquaculture area object, and results were missed in that location. As shown in region D in Fig. 8, the target of the aquaculture area was obvious in one case, and the boundary was successfully extracted, but the object of the aquaculture area could not be extracted because that boundary was not closed. In practical application, it would be necessary to perform a topology check on the extracted vector boundaries, detect breakpoints, and perform repair processing. Since we extracted the culture area based on the edge features in this paper, some problems arise in the boundary closure. The use of deep learning models such as FCN (Long et al., 2014) for extracting planar objects may improve such problems, but it may also weaken the edge features and ultimately reduce the accuracy. This requires us to carry out detailed experiments to prove, so compare various deep learning models and verifying their applicability to various features is our next research direction.
Second, the training samples determine the potential for high precision, and good training samples and improved model training rely on human input. Because deep learning is the extraction of features from multiple targets, for each layer, the extracted features are ambiguous, and it is currently impossible to impart human knowledge to guide the model training (e.g., by telling the model which features are more suitable for the currently extracted objects) and to improve training efficiency. In addition, model training carries inherent randomness. The parameters taken by each training computer are different. Therefore, there will be subtle differences in the training results and there will be some small fluctuations in the accuracy of the final results. Model training depends on the quality of the sample. If the quality of the sample is high, the accuracy of the final result is high and the training time of the model is relatively short. If the quality of the sample is low, or the sample does not cover all the objects to be extracted, then it is difficult to produce high-quality extraction results and the model training time is long. Therefore, in the sample production stage, it is necessary to pay special attention to the choice of samples and the accuracy of true values.
Third, the data verification in this paper is completed by comparing the RCF extraction results and the visual interpretation results in the same image. It is acceptable only from the field of image recognition, but the remote sensing image is a true reflection of the target of a specific region. To verify the effectiveness of the interpretation, it is still necessary to combine some field measurement data for verification, which is one of our follow-up work.
5 SUMMARY AND OUTLOOKIn this study, we used the RCF deep-learning model to extract large-scale marine aquaculture areas in the Sanduao area of Fujian Province from April 2017 to May 2017. Moreover, we carried out a vulnerability analysis of marine aquaculture areas in the area. Marine aquaculture areas are susceptible to suspended sediment and chlorophyll in background seawater. It is difficult to extract areas at a large scale using threshold methods and object-oriented SVM classification. By selecting appropriate samples, we used the RCF model to extract the boundaries of marine aquaculture areas, obtain marine aquaculture area objects, and obtain high-quality extraction results with an accuracy of >93%. In areas where the model fails and partial fracture of the extracted culture areas exists, we plan to use the object-oriented method. The RCF model is a deep-learning model used to extract object boundaries. In this study, we used it to extract marine aquaculture areas and achieved success. For other land types with obvious boundaries and linear features, such as roads and farmland, RCF also is expected to perform well. The types of features on land are even more complex; however, with more potential interferences from the background that features in marine target areas. Therefore, successfully applying RCF to more fields is our next research direction.
6 DADA AVAILABILITY STATEMENTThe data that support the findings of this study are available from the corresponding author upon reasonable request.
Blaschke T, Hay G J, Kelly M, Lang S, Hofmann P, Addink E, Feitosa R Q, van der Meer F, van der Werff H, van Coillie F, Tiede D. 2014. Geographic object-based image analysis-towards a new paradigm. ISPRS Journal of Photogrammetry and Remote Sensing, 87: 180-191.
DOI:10.1016/j.isprsjprs.2013.09.014 |
Chen G, Weng Q H, Hay G J, He Y N. 2018. Geographic Object-Based Image Analysis (GEOBIA):emerging trends and future opportunities. GIScience & Remote Sensing, 55(2): 159-182.
DOI:10.1080/15481603.2018.1426092 |
Cheng T F, Zhou W F, Fan W. 2012. Progress in the methods for extracting aquaculture areas from remote sensing data. Remote Sensing for Land & Resources, 24(3): 1-5.
(in Chinese with English abstract) |
Chu J L, Zhao D Z, Zhang F S. 2012. Wakame raft interpretation method of remote sensing based on association rules. Remote Sensing Technology and Application, 27(6): 941-946.
(in Chinese with English abstract) |
Fan J Y, Huang H J, Fan H, Gao A. 2005. Extracting aquaculture area with RADASAT-1. Marine Sciences, 29(10): 44-47.
(in Chinese with English abstract) |
Guan C T, Wang Q Y. 2005. Development and prospect of marine net cage technology in China. Fishery Modernization, 3: 5-7.
(in Chinese) |
He K M, Zhang X Y, Ren S Q, Su J. 2015. Delving deep into rectifiers: surpassing human-level performance on imagenet classification. arXiv: 1502.01852.
|
Huang B, Qian L M, Liu J F. 2002. Nutrient salts content and eutrophication assessment For Sanduao sea area, Fujian. Journal of Oceanography in Taiwan Strait, 21(4): 411-415.
(in Chinese with English abstract) |
Ji W W, Zhou J. 2012. Community structure of macrobenthos in response to mariculture practices in Sandu Bay. Journal of Fishery Sciences of China, 19(3): 491-499.
(in Chinese with English abstract) |
Lahsen M, Sanchez-Rodriguez R, Lankao P R, Dube P, Leemans R, Gaffney O, Mirza M, Pinho P, Osman-Elasha B, Smith M S. 2010. Impacts, adaptation and vulnerability to global environmental change:challenges and pathways for an action-oriented research agenda for middle-income and low-income countries. Current Opinion in Environmental Sustainability, 2(5-6): 364-374.
DOI:10.1016/j.cosust.2010.10.009 |
Li X G, Jiang N, Yang Y B, Yin L Q. 2006. Remote sensing investigation and survey of lake reclamation and enclosure aquaculture in Lake Taihu. Transactions of Oceanology and Limnology, (1): 93-99.
(in Chinese with English abstract) |
Liu P, Du Y Y. 2012. A CBR approach for extracting coastal aquaculture area. Remote Sensing Technology and Application, 27(6): 857-864.
(in Chinese with English abstract) |
Liu Y, Cheng M M, Hu X W, Wang K, Bai X. 2017. Richer convolutional features for edge detection. In: Proceedings of 2017 IEEE Conference on Computer Vision and Pattern Recognition (CVPR). IEEE, Honolulu, HI, https://doi.org/10.1109/CVPR.2017.622.
|
Lu Y W, Li Q Z, Du X, Wang H Y, Liu J L. 2015. A Method of coastal aquaculture area Automatic Extraction with high spatial resolution images. Remote Sensing Technology and Application, 30(3): 486-494.
(in Chinese with English abstract) |
Romieu E, Welle T, Schneiderbauer S, Pelling M, Vinchon C. 2010. Vulnerability assessment within climate change and natural hazard contexts:revealing gaps and synergies through coastal applications. Sustainability Science, 5(2): 159-170.
DOI:10.1007/s11625-010-0112-2 |
Shelhamer E, Long J, Darrell T. 2017. Fully convolutional networks for semantic segmentation. IEEE Transactions on Pattern Analysis and Machine Intelligence, 39(4): 640-651.
DOI:10.1109/TPAMI.2016.2572683 |
Simonyan K, Zisserman Z. 2014. Very deep convolutional networks for large-scale image recognition. arXiv: 1409.1556.
|
Wang J, Gao J F. 2008. Extraction of enclosure culture in Gehu Lake based on correspondence analysis. Journal of Remote Sensing, 12(5): 716-723.
(in Chinese with English abstract) |
Wang M, Cui Q, Wang J, Ming D P, Lv G N. 2017. Raft cultivation area extraction from high resolution remote sensing imagery by fusing multi-scale region-line primitive association features. ISPRS Journal of Photogrammetry and Remote Sensing, 123: 104-113.
DOI:10.1016/j.isprsjprs.2016.10.008 |
Wang Z H, Meng F, Yang X M, Yang F S, Fang Y. 2016. Study on the automatic selection of segmentation scale parameters for high spatial resolution remote sensing images. Journal of Geo-information Science, 18(5): 639-648.
DOI:10.3724/SP.J.1047.2016.00639 |
Wang Z H, Yang X M, Liu Y M, Lu C. 2018. Extraction of coastal raft cultivation area with heterogeneous water background by thresholding object-based visually salient NDVI from high spatial resolution imagery. Remote Sensing Letters, 9(9): 839-846.
DOI:10.1080/2150704X.2018.1468103 |
Xie Y L, Wang M, Zhang X Y. 2009. An object-oriented approach for extracting farm waters within coastal belts. Remote Sensing Technology and Application, 24(1): 68-72.
(in Chinese with English abstract) |
Zhang T, Yang X M, Tong L Q, He P. 2016. Selection of bestfitting scale parameters in image segmentation based on multiscale segmentation image database. Remote Sensing for Land & Resources, 28(4): 59-63.
DOI:10.6046/gtzyyg.2016.04.09 |
Zhou X C, Wang X Q, Xiang T L, Jiang H. 2006. Method of automatic extracting seaside aquaculture land based on ASTER remote sensing image. Wetland Science, 4(1): 64-68.
(in Chinese with English abstract) |
Zhu C M, Luo J C, Shen Z F, Li J L, Hu X D. 2011. Extract enclosure culture in coastal waters based on high spatial resolution remote sensing image. Journal of Dalian Maritime University, 37(3): 66-69.
(in Chinese with English abstract) |