 2019, Vol. 37
Institute of Oceanology, Chinese Academy of Sciences
Article Information
- YANG Wankang, FENG Xingru, YIN Baoshu
- The impact of coastal reclamation on tidal and storm surge level in Sanmen Bay, China
- Journal of Oceanology and Limnology, 37(6): 1971-1982
- http://dx.doi.org/10.1007/s00343-019-8247-1
Article History
- Received Sep. 14, 2018
- accepted in principle Jan. 22, 2019
- accepted for publication Mar. 18, 2019


2 University of Chinese Academy of Sciences, Beijing 100049, China;
3 Second Institute of Oceanography, Ministry of Natural Resources, Hangzhou 310012, China;
4 Center for Ocean Mega-Science, Chinese Academy of Sciences, Qingdao 266071, China;
5 Laboratory for Ocean Dynamics and Climate, Qingdao National Laboratory for Marine Science and Technology, Qingdao 266237, China
Sanmen Bay of Zhejiang Province is a semi-closed bay of the East China Sea, which is about 40 km long from the mouth to the head, and this palm-shaped bay has several fingers with an average width of ~4 km (Fig. 1). Semidiurnal tides are dominant in Sanmen Bay and the mean tidal range exceeds 4.2 m. The harmonic analysis of tidal currents has shown that the major axis of the current ellipse is in a SE-NW direction. Thus, the tidal currents flow mainly towards the northwest during flood tides and the southeast during ebb tides (Zhu et al., 2015). The Sanmen Bay region suffers from severe damages from strong winds, storm surges, and inland flooding induced by tropical cyclones. According to the 1949–2017 statistics, about three to four typhoons affect the bay every year. The storm surges in Sanmen Bay are significantly enhanced due to its trumpet-like geometry and funneling effects.

|
| Fig.1 The location of Sanmen Bay and the land reclamation projects (orange area) Red stars are tidal stations and black dots are ports in Sanmen Bay. |
In the last 30 years, many coastal reclamation projects are initiated for agricultural, industrial, and recreational uses in the world (Kennish, 2001; Hoeksema, 2007; Tian et al., 2008). Coastal reclamation projects have resulted in a rapid loss of vegetated coastal wetlands and coastline change. The morphology, hydrodynamics, sediment transportation, and landscape of coastal areas have been altered significantly (Cearreta et al., 2002; Arkema et al., 2013; Cheong et al., 2013). From 2004 to 2017, reclamation projects in an area of exceeding 110 km2 have been carried out in Sanmen Bay (Chen et al., 2015), which have reduced the estuary area significantly (Fig. 1).
The reclamation projects have a great influence on tidal and storm surge levels. Coastal wetlands act as natural buffers to reduce wave height and weaken storm surges (Crain et al., 2009; Duarte et al., 2013; Yu et al., 2016). However, dikes, levees, and other coastal engineering structures prevent coastal wetlands from migrating inland, leading to the exposure of low-lying coastal areas to storm surges (Temmerman et al., 2013; Tian et al., 2016). Benavente et al. (2006) studied two types of storm surges and found that a long-term coastline change could increase exposure to storm surges and waves. Guo et al. (2009) applied the unstructured grid finite volume coastal ocean model (FVCOM) to investigate the response of Hangzhou Bay to tropical typhoons. The results show that shoreline relocation and seabed deformation resulted in higher storm surges near reclamation areas. Xie et al. (2007) performed depth-averaged storm surge modeling and found that shoreline replacement had the most notable impacts on local flooding. Ding and Wei (2017) found that land reclamation in the Bohai Sea altered natural coastline structure and increased the maximum sea level by 0.1–0.2 m.
Previous studies show that numerical models are widely used for evaluating the impact of reclamation (Liu et al., 2006; Du et al., 2007). However, there are few studies considering the impact of coastal reclamation on both tidal and storm surge levels in Sanmen Bay. The reclamation projects mainly affect tidal and storm surge levels through shoreline relocation and bed topography deformation. Thus, after extensive land reclamation in Sanmen Bay, the tidal and storm surge levels need to be reassessed. The change of tidal and storm surge levels should also be considered for engineering design and coastal protection. In this paper, a two-dimensional (2D) model with unstructured mesh was established, which suits the complex coastline in Sanmen Bay. This model was validated with observed tidal constituents and storm surge levels and applied to investigate the impact of shoreline relocation and bed topography change on both tidal and storm surge levels.
This paper is organized as follows. The numerical model is described and validated in Section 2. In Section 3, the impact of shoreline relocation and bed topographic change on both tidal and storm surge levels are examined. The conclusions are presented in Section 4.
2 METHOD 2.1 Model descriptionA 2D advanced circulation model (ADCIRC) developed by Luettich et al. (1993) is used to simulate the tide and storm surge in Sanmen Bay. ADCIRC uses unstructured triangular grids in the horizontal plane to resolve dynamics on complex shorelines. Primitive equations are formulated using traditional hydrostatic pressure and the Boussinesq approximations. ADCIRC solves the primitive equations with the finite element method in space and with the finite difference method in time. ADCIRC can be run either as a 2D depth-integrated model or as a three-dimensional (3D) model. The 2D model calculates bottom stress as a quadratic function of depth-averaged currents while the 3D model usually considers vertically sheared currents that enable a more sophisticated estimation of bottom stress. In this paper, our emphasis is on surface elevations forced by tide and storm surge. Thus, 2D model is used for tidal and storm simulation in our study, which is sufficient to reproduce storm surges and tide level and makes the computation process more efficient (Proctor and Flather, 1989; Tang et al., 1996; Idier et al., 2012). The 2D shallow water equations are:
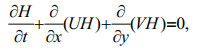 (1)
(1) (2)
(2)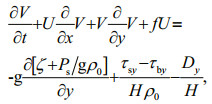 (3)
(3)where (U, V) are the x and y depth-averaged velocity components; ζ is free surface elevation; h is the still water depth; H=h+ζ is the total water level; f is the Coriolis force parameter; g is gravitational acceleration; Ps is sea surface atmospheric pressure; ρ0 is seawater density; (τsx, τsy) are the x and y components of surface wind stress; (τbx, τby) are the x and y components of bottom stress; and (Dx, Dy) are the horizontal momentum diffusion terms.
The surface wind stress parameters (τsx, τsy) are computed as follows:
 (4)
(4)where ρa is air density; (Wx, Wy) are the x and y components of wind speed and Cd is the wind drag coefficient. Following Garratt (1977), the drag coefficient is calculated as follows:
 (5)
(5)Bottom stress components (τbx, τby) are computed using the quadratic law:
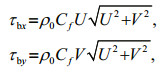 (6)
(6)where Cf is bottom drag coefficient and determined by model calibration.
2.2 Wind field of typhoonsThe analytical wind model from Holland (1980) was applied to reconstruct the wind field for calculating storm surges. The pressure and wind profile are calculated as follows:
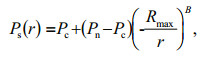 (7)
(7)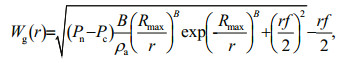 (8)
(8)where r is the distance from the typhoon center; Pn is the ambient pressure; Pc is the central pressure; Rmax is the maximum wind radius; and Wg is wind speed. The B parameter is defined by
 (9)
(9)The Rmax is calculated by the following formula developed from Willoughby and Rahn (2004):
Rmax=51.6exp(-0.0223Vmax+0.0281φ),
where Vmax is the maximum wind and φ is latitude.
As B increases, the wind becomes stronger near the radius of maximum winds. For larger B, the wind drops off more abruptly both inside and outside the radius of maximum wind (Hubbert et al., 1991). The inflow angle caused by friction contributes to wind field asymmetry and a constant angle of 25° was used in this study. The central pressure and position data were retrieved from the China Meteorological Administration tropical cyclone database (Ying et al., 2014).
Due to the lack of observed wind data in Sanmen Bay, the wind field from the Holland model cannot be verified directly. However, the Holland wind model is widely applied in storm surge calculation and reproduces the wind profiles accurately in previous studies. Furthermore, the surge elevation forced by Holland wind model is verified by measured data from a tidal station in the next section, which ensures the reliability and accuracy of storm surge model.
2.3 Model setupIn this study, the computational domain covered the Bohai Sea, Yellow Sea, and the East China Sea, with a range of 114°–130°E and 20°–41°N (Fig. 2). The grid size ranged from 25 km at the open boundary to 200 m in Sanmen Bay. The domain space was discretized into 140 079 triangular cells with 98 200 nodes. The bathymetry data were obtained from GEBCO's gridded bathymetric data sets at 30 arcsecond intervals (available online from https://www.gebco.net/) and were interpolated into each grid point. Mean sea level was used as the model datum. The model was forced at open boundaries by nine tidal constituents extracted from the global tidal model TPXO7.2 (available online from http://volkov.oce.orst.edu/tides/otps.html), including M2, S2, N2, K2, K1, O1, P1, Q1, and M4. The typhoon wind field was generated by the Holland wind model and imposed through surface boundary conditions. The model was run with a cold start when the currents and water level at the initial time are set to zero. The initial shoreline without considering reclamation projects was used for model calibration for tide and storm surge. A wetting and drying algorithm is included in the ADCIRC model. Total water elevation at each node is checked against a minimum wetness height. If the water elevation is larger than the minimum value, the node remains active in the model calculations. However, if the total elevation falls below this minimum value, the node is removed from the calculations. In this paper, the minimum wetness height is set to 0.05 m. There is no river flowing into Sanmen Bay. So the effect of river flow is not considered in our model simulation.

|
| Fig.2 The model domain and grids |
The model was run for 70 days by tidal forcing, without considering wind forcing. Model results from the last 60 days were used for harmonic analysis of tidal constituents. The observed tidal constituents were calculated from measured data from the Jiantiao and L1 stations in Sanmen Bay (Fig. 1). The comparison of four main tidal constituents (M2, S2, K1, and O1) is presented in Table 1. Amplitude errors of tidal constituents were less than 0.04 m while tidal phase errors were within 5°. Overall, the model reproduced the tide satisfactorily in Sanmen Bay. The amplitudes of M2, S2, K1, and O1 in Sanmen Bay were obtained by applying harmonic analysis to a time series of elevation in each model grid. Figure 3 shows the distribution of amplitudes for the main tidal constituents. The results suggest that semidiurnal tides are dominant in Sanmen Bay where amplitudes of the M2 and M2 constituents are much larger than those of K1 and O1. The amplitude of the M2 constituent gradually increased from 1.6 m at the bay mouth to 2.1 m at the top of the bay while M2 constituent amplitude increased from 0.7 m to 0.9 m. However, the tidal amplitudes of the K1 and O1 constituents were almost consistent across Sanmen Bay. The mean tidal amplitudes of K1 and O1 were 0.3 m and 0.2 m, respectively.


|
| Fig.3 The distribution of amplitudes for main tidal constituents a. M2 constituent; b. S2 constituent; c. K1 constituent; d. O1 constituent. |
Based on the sea level records from Jiantiao station, the typhoon paths that caused surge levels exceeding for 0.8 m are plotted in Fig. 4a. They can be classified into three categories according to the direction of the typhoon movement. The three typhoons (Ted in September 1992, Rammasun in July 2002, Khanun in September 2005) that cause the highest surge level from each type of path category were selected for the case study. Their paths are shown in Fig. 4b.

|
| Fig.4 The typhoon paths causing surge levels larger than 0.8 m (a) and selected typhoon paths for the study case (b) Sanmen Bay is located in the red box. The numbers Ⅰ, Ⅱ, Ⅲ and purple arrows represent three main types of typhoon paths. |
L1 was a temporary station that worked for one month only, so measured hourly data from Jiantiao station was used for storm surge validation. The time series of surge levels at Jiantiao station for each typhoon case was obtained by subtracting the astronomical tide from the total level. Figure 5 shows a comparison between the observed and modeled data. The storm peaks were in good agreement with observations for the three typhoon cases. Typhoon Khanun caused the highest surge level among the three typhoon paths, with the peak level value reaching 2.48 m. When typhoon Khanun approached Sanmen Bay, seawater rapidly poured into the bay due to the strong southeast wind. The funneling effect also strengthened the surge level. The peak levels of typhoon Ted and Rammasun were 0.96 m and 0.98 m, respectively, much lower than typhoon Khanun. When typhoons Ted and Rammasun passed through Sanmen Bay, there was a large angle between the wind vectors and the orientation of Sanmen Bay, precluding seawater from pouring into the bay.

|
| Fig.5 The comparison between simulated and observed surge levels at Jiantiao station a. typhoon Ted; b. typhoon Rammasun; c. typhoon Khanun. |
First, the effect of shoreline change due to land reclamation on tidal amplitude was examined by comparing the amplitudes of four main tidal constituents using the initial shoreline and the new shoreline following reclamation. The differences of amplitudes for the four tidal constituents in the Sanmen Bay are shown in Fig. 6. The shoreline relocation mainly affected the semidiurnal tidal constituents. The amplitudes of the M2 and M2 constituents decreased by 0.08–0.12 m and 0.03–0.06 m from the bay mouth to the top of the bay, respectively. The effect on diurnal tidal constituents is very minor and the amplitude differences for the K1 and O1 constituents were less than 0.02 m.

|
| Fig.6 The differences of tidal amplitudes due to shoreline relocation a. M2 constituent; b. S2 constituent; c. K1 constituent; d. O1 constituent. |
Reclamation projects not only affect tidal heights through shoreline relocation but also have a series of additional effects. Serious siltation can be caused after the reclamation construction, leading to changes of topography in Sanmen Bay. As is known, there is a dynamic equilibrium between sediment moving and hydrodynamic process. The sediment deposition and erosion affected by tides, currents, and waves can significantly modify the shoreline and topography. After massive land reclamation projects, the currents are impeded by a seawall and the probability of sediment deposition increases. The tidal-duration asymmetry due to the reclamation projects also changes the net sediment transport (Kumar and Jayappa, 2009; Yu et al., 2012; Gao et al., 2014). Thus, serious silting occurred as a result of currents and flux affected by reclamation and both the tidal heights and the depths are changed according to Eqs.2 and 3. Several numerical experiments were used to investigate the influence of topographic change on tidal heights. The specific experimental schemes are shown in Table 2.
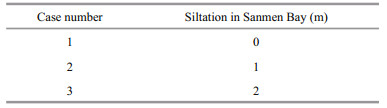
Based on the experimental schemes above, three numerical cases were run using the new shoreline with land reclamation. Figure 7 shows the amplitude differences of the four main tidal constituents between case 1 and case 2. The amplitude differences of the tidal constituents between case 1 and case 3 are shown in Fig. 8. As shown in Fig. 7, when the siltation in the Sanmen Bay reached 1 m, the amplitude of the M2 constituent increased by 0.02–0.03 m, mainly at the Baijiao waterway, Jiantiao waterway and the top of the bay. There were almost no effects on the other constituents. With siltation up to 2 m, the main effects were on the amplitudes of the semidiurnal constituents. The amplitude of the M2 constituent increased by 0.05–0.06 m at the top of the bay and by 0.03–0.04 m in the Baijiao waterway and Jiantiao waterway. The differences in the M2 constituent amplitude in other regions such as the Shipu waterway and the bay mouth were not obvious. For the M2 constituent, the amplitude increased in the range of 0.02–0.03 m at the top of Sanmen Bay. The effects on the amplitudes of diurnal constituents were minor.

|
| Fig.7 The differences in tidal amplitudes due to topographic change at 1 m a. M2 constituent; b. S2 constituent; c. K1 constituent; d. O1 constituent. |

|
| Fig.8 The differences in tidal amplitudes due to topographic change at 2 m a. M2 constituent; b. S2 constituent; c. K1 constituent; d. O1 constituent. |
In general, shoreline relocation and topographic change had opposite effects on tidal heights. Shoreline relocation caused the tidal amplitude to decrease, however, topographic change due to siltation led to an increase in amplitude. The reduction in amplitude was larger than the increase. Significant variations of amplitude mainly occurred at the top of Sanmen Bay. The effect on diurnal constituents was minor and can be ignored. The results suggested that the tidal heights in Sanmen Bay will decrease at first, and then increase due to siltation over time.
3.2 Influence of land reclamation on storm surgeSimilar to the study in Section 3.1, the effect of shoreline relocation due to land reclamation on storm surge was investigated by comparing the simulated peak surge levels between the initial shoreline and the new shoreline with the implementation of reclamation for each typhoon case. The simulation schemes are shown in Table 3.

|
The six numerical experiments were run and the differences in peak surge levels due to shoreline relocation for each typhoon case are presented in Fig. 9. As seen from Fig. 9, variations of peak surge levels were quite different for the three typhoon cases. For typhoon Ted, the peak surge levels were lower by 0.08–0.12 m, especially at the top of Sanmen Bay. The surge levels in the middle of Sanmen Bay and the Baijiao waterway also decreased by 0.04 m. For typhoon Rammasun, the shoreline change has some effect in the Baijiao waterway and caused the peak surge levels to increase by 0.04 m. However, the variations of surge levels during typhoon Khanun were complex. The surge levels near Qingshan Port and Liyang Port deceased by 0.06 m while the levels at the Jiaotiao waterway and Shepan waterway increased by 0.04–0.06 m.

|
| Fig.9 Peak surge level variations due to shoreline relocation a. typhoon Ted; b. typhoon Rammasun; c. typhoon Khanun. |
In general, the effects of shoreline change on surge levels were quite different depending on the typhoon paths. Surge levels decreased significantly at the top of Sanmen Bay for the path of typhoon Ted. There was little effect on peak surge levels for the path of typhoon Rammasun. Both an increase and a reduction of surge levels occurred for the path of typhoon Khanun. Increases of surge levels are more important because they can overtop the dikes and cause flooding to coastal areas. From this point of view, shoreline relocation has had a limited effect on storm surge levels, since the maximum increase in surge levels was less than 0.06 m.
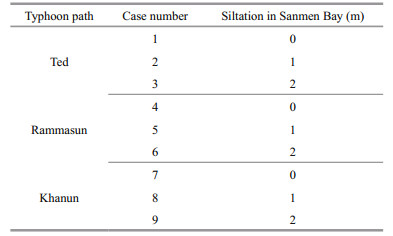
As mentioned in Section 3.1, the topographic change due to siltation may also affect the storm surge levels in Sanmen Bay. Nine numerical experiments using the new shoreline were carried out to predict the variations of storm surge levels due to topographic change. The numerical schemes are shown in Table 4.
|
The differences in peak surge level due to topographic change for the three types of typhoon paths are plotted in Fig. 10.

|
| Fig.10 The differences of peak surge levels due to topographic change (a) and (b): siltation at 1 m and 2 m on path of typhoon Ted; (c) and (d): siltation at 1 m and 2 m on path of typhoon Rammasun; (e) and (f): siltation at 1 m and 2 m on path of typhoon Khanun. |
For typhoon Ted, a decrease of ~0.03 m in the peak surge levels occurred at the top of Sanmen Bay when siltation reached 1 m. However, the peak surge level increased when siltation reached 2 m. The peak surge levels in the Baijiao and Jiantiao waterways rose by ~0.06 m. An increase in peak levels of 0.12–0.16 m occurred in Qingshan Port, Liyang Port, and Shepan waterway near the top of the bay. There was also an increase of ~0.08 m near Xiayangtu.
The differences in peak surge levels for typhoon Rammasun were quite small. The peak surge levels increased by 0.04 m in the Baijiao waterway and decreased by 0.04 m near Liyang Port and Qingshan Port when the siltation level was 1 m. Even when the siltation reached 2 m, the peak surge levels in the Baijiao waterway increased by 0.07 m only. Thus, the path of Rammasun had only a small effect on storm surge after the reclamation of land.
For typhoon Khanun, the surge levels changed significantly due to siltation. The surge levels in the whole Sanmen Bay mainly increased. When siltation reached 1 m, an increase in peak levels by 0.10–0.14 m occurred in the Jiantiao waterway and Shepan waterway near the top of the bay. The rise of peak surge levels was much higher in the southwest part of Sanmen Bay. When the siltation reached 2 m, the rise of peak surge levels was more obvious. The change of topography caused an increase of 0.20–0.24 m at the top of the bay and the Jiantiao waterway. Peak surge levels near the Xiayangtu reclamation also increased by 0.15 m. There was an increase of ~0.08 m in the Baijiao waterway.
As discussed above, the rise of peak surge level due to the change of topography in the path of Khanun was much larger than that of the other typhoon paths. The maximum increase in surge levels exceeded 0.24 m and a significant rise in surge levels mainly occurred at the top of the bay, Jiantiao waterway and near the Xiayangtu reclamation. The peak surge levels were intensified when siltation increased. Taking the combined effects of shoreline relocation and topographic change into consideration, the rise of surge levels could exceed 0.30 m for the path of typhoon Khanun.
4 CONCLUSIONIn this study, a 2D numerical model based on the ADCIRC model is established to evaluate the impact of the reclamation project on tidal and storm surge level in the Sanmen Bay. The results show that shoreline relocation and topographic change had opposite effects on tidal heights. Shoreline relocation decreased the tidal amplitudes, while topographic change due to siltation increased the amplitudes, which is more significant at the top of Sanmen Bay. Three types of typhoon paths were applied for simulation, showing that the effects of shoreline relocation on surge levels were quite different depending on the typhoon paths, and the maximum increase in surge level was no more than 0.06 m. On the other hand, the rise of surge peak levels due to the change of topography was more significant and the peak surge levels were intensified when siltation increased. The maximum surge level rise occurred in the path of the northwest landing typhoons and exceeded 0.24 m at the top of the bay. When the combined effects of shoreline relocation and topographic change were considered, the maximum rise of surge-level could exceed 0.30 m. The effect of land reclamation on tides and storm surges should be considered in engineering design and coastal protection in the future since it could potentially lead to serious damage and losses in Sanmen Bay.
5 DATA AVAILABILITY STATEMENTThe datasets analyzed during the current study are available from the corresponding author on reasonable request.
6 ACKNOWLEDGMENTThe authors thank Dr. Leonie Seabrook from Liwen Bianji, Edanz Group China (www.liwenbianji.cn/ac) for English editing of the manuscript draft.
Arkema K K, Guannel G, Verutes G, Wood S A, Guerry A, Ruckelshaus M, Kareiva P, Lacayo M, Silver J M. 2013. Coastal habitats shield people and property from sea-level rise and storms. Nature Climate Change, 3(10): 913-918.
DOI:10.1038/nclimate1944 |
Benavente J, Del Río L, Gracia F J, Martínez-del-Pozo J A. 2006. Coastal flooding hazard related to storms and coastal evolution in Valdelagrana spit (Cadiz Bay Natural Park, SW Spain). Continental Shelf Research, 26(9): 1061-1076.
DOI:10.1016/j.csr.2005.12.015 |
Cearreta A, Irabien M J, Ulibarri I, Yusta I, Croudace I W, Cundy A B. 2002. Recent salt marsh development and natural regeneration of reclaimed areas in the Plentzia estuary, N. Spain. Estuarine, Coastal and Shelf Science, 54(5): 863-886.
DOI:10.1006/ecss.2001.0862 |
Chen X Y, Zhang J, Ma Y, Cui T W. 2015. Monitoring and analysis of coastline changes of the Sanmen Bay with remote sensing during the past 40 years. Marine Sciences, 39(2): 43-48.
(in Chinese with English abstract) |
Cheong S M, Silliman B, Wong P P, Van Wesenbeeck B, Kim C K, Guannel G. 2013. Coastal adaptation with ecological engineering. Nature Climate Change, 3(9): 787-791.
DOI:10.1038/nclimate1854 |
Crain C M, Halpern B S, Beck M W, Kappel C V. 2009. Understanding and managing human threats to the coastal marine environment. Annals of the New York Academy of Sciences, 1162(1): 39-62.
DOI:10.1111/j.1749-6632.2009.04496.x |
Ding Y M, Wei H. 2017. Modeling the impact of land reclamation on storm surges in Bohai Sea, China. Natural Hazards, 85(1): 559-573.
DOI:10.1007/s11069-016-2586-4 |
Du P J, Hu K L, Kong Y Z, Ding P X. 2007. Application of ECOMSED model to the simulation of Hangzhou Bay tide current. Acta Oceanologica Sinica, 29(1): 1-16.
(in Chinese with English abstract) |
Duarte C M, Kennedy H, Marbà N, Hendriks I. 2013. Assessing the capacity of seagrass meadows for carbon burial: current limitations and future strategies. Ocean & Coastal Management, 83: 32-38.
|
Gao G D, Wang X H, Bao X W. 2014. Land reclamation and its impact on tidal dynamics in Jiaozhou Bay, Qingdao, China. Estuarine, Coastal and Shelf Science, 151: 285-294.
DOI:10.1016/j.ecss.2014.07.017 |
Garratt J R. 1977. Review of drag coefficients over oceans and continents. Monthly Weather Review, 105(7): 915-929.
DOI:10.1175/1520-0493(1977)105<0915:RODCOO>2.0.CO;2 |
Guo Y K, Zhang J S, Zhang L X, Shen Y M. 2009. Computational investigation of typhoon-induced storm surge in Hangzhou Bay, China. Estuarine, Coastal and Shelf Science, 85(4): 530-536.
DOI:10.1016/j.ecss.2009.09.021 |
Hoeksema R J. 2007. Three stages in the history of land reclamation in the Netherlands. Irrigation and Drainage, 56(S1): S113-S126.
|
Holland G J. 1980. An analytic model of the wind and pressure profiles in hurricanes. Monthly Weather Review, 108(8): 1212-1218.
DOI:10.1175/1520-0493(1980)108<1212:AAMOTW>2.0.CO;2 |
Hubbert G D, Holland G J, Leslie L M, Manton M J. 1991. A real-time system for forecasting tropical cyclone storm surges. Weather and Forecasting, 6(1): 86-97.
DOI:10.1175/1520-0434(1991)006<0086:ARTSFF>2.0.CO;2 |
Idier D, Dumas F, Muller H. 2012. Tide-surge interaction in the English Channel. Natural Hazards and Earth System Sciences, 12(12): 3709-3718.
DOI:10.5194/nhess-12-3709-2012 |
Kennish M J. 2001. Coastal salt marsh systems in the U.S.: a review of anthropogenic impacts. Journal of Coastal Research, 17(3): 731-748.
|
Kumar A, Jayappa K S. 2009. Long and short-term shoreline changes along Mangalore Coast, India. International Journal of Environmental Research, 3(2): 177-188.
|
Liu X C, Lu Y J, Pan L H, Wu J W. 2006. Tidal current numerical simulating and water exchange research in Yangtze Estuary and Hangzhou Bay. Journal of Hydrodynamics, 21(2): 171-180.
(in Chinese with English abstract) |
Proctor R, Flather R A. 1989. Storm surge prediction in the Bristol Channel—the floods of 13 December 1981. Continental Shelf Research, 9(10): 889-918.
DOI:10.1016/0278-4343(89)90064-2 |
Tang Y M, Sanderson B, Holland G, Grimshaw R. 1996. A numerical study of storm surges and tides, with application to the North Queensland Coast. Journal of Physical Oceanography, 26(12): 2700-2711.
DOI:10.1175/1520-0485(1996)026<2700:ANSOSS>2.0.CO;2 |
Temmerman S, Meire P, Bouma T J, Herman P M J, Ysebaert T, De Vriend H J. 2013. Ecosystem-based coastal defence in the face of global change. Nature, 504(7478): 79-83.
DOI:10.1038/nature12859 |
Tian B, Wu W T, Yang Z Q, Zhou Y X. 2016. Drivers, trends, and potential impacts of long-term coastal reclamation in China from 1985 to 2010. Estuarine, Coastal and Shelf Science, 170: 83-90.
DOI:10.1016/j.ecss.2016.01.006 |
Tian B, Zhou Y X, Zhang L Q, Yuan L. 2008. Analyzing the habitat suitability for migratory birds at the Chongming Dongtan nature reserve in Shanghai, China. Estuarine, Coastal and Shelf Science, 80(2): 296-302.
DOI:10.1016/j.ecss.2008.08.014 |
Westerink J J, Luettich R A, Blain C A, Scheffner N W. 1993. ADCIRC: an advanced three-dimensional circulation model for shelves, coasts, and estuaries. Report 2: user's manual for ADCIRC-2DDI. Coastal Engineering Research Center, Vicksburg, Mississippi, USA.
|
Willoughby H E, Rahn M E. 2004. Parametric representation of the primary hurricane vortex. Part Ⅰ: observations and evaluation of the Holland (1980) modeltex. Monthly Weather Review, 132(12): 3033-3048.
DOI:10.1175/MWR2831.1 |
Xie Y L, Huang S C, Wang R F, Zhao X. 2007. Numerical simulation of effects of reclamation in Qiantang Estuary on storm surge at Hangzhou Bay. The Ocean Engineering, 25(3): 61-67.
(in Chinese with English abstract) |
Ying M, Zhang W, Yu H, Lu X Q, Feng J X, Fan Y X, Zhu Y T, Chen D Q. 2014. An overview of the China meteorological administration tropical cyclone database. Journal of Atmospheric and Oceanic Technology, 31(2): 287-301.
DOI:10.1175/JTECH-D-12-00119.1 |
Yu J, Bao X W, Ding Y, Zhang W, Zhou L L. 2016. The impact of large-scale reclamation on hydro-dynamic environment-A case study of Xinghua Bay. Journal of Ocean University of China, 15(4): 583-592.
DOI:10.1007/s11802-016-2911-2 |
Zhu Z N, Zhu X H, Zhang C Z, Fan X P, Liao G H, Xuan J L, Long Y, Ma Y L, Zhao R X, He Z G, Zhang T, Zhang X M. 2015. An observational experiment of coastal acoustic tomography to map the structure of tidal currents in Sanmen Bay, China. Chinese Journal of Geophysics, 58(5): 1742-1753.
(in Chinese with English abstract) |