 2019, Vol. 37
Institute of Oceanology, Chinese Academy of Sciences
Article Information
- LIU Qingrong, LI Jian, RUAN Chengqing, YIN Zhonghui, JIAO Yan, SUN Qing, LIAN Xihu, ZHONG Shan
- Risk assessment and zoning of sea level rise in Shandong Province
- Journal of Oceanology and Limnology, 37(6): 2014-2024
- http://dx.doi.org/10.1007/s00343-019-8233-7
Article History
- Received Sep. 7, 2018
- accepted in principle Nov. 1, 2018
- accepted for publication Dec. 5, 2018


Sea level rise is a slow-onset disaster that has become one of the main threats to humanity as the world experiences warming. Sustained sea level rise will cause flooding of coastal lowland areas, aggravate storm tides and floods, reduce the resistance of coastal cities to disaster, aggravate the salinity in soil, cause water resource shortages, threaten ecological resources in coastal areas, and compromise the safety of coastal buildings, thereby indirectly affecting the normal lives of people (Xu et al., 2006; Nicholls and Cazenave, 2010; Hallegatte et al., 2011; Sahin and Mohamed, 2014).
Gornitz (1991), the first to assess the risks of sea level rise in coastal areas, introduced the concepts of coastal vulnerability indexes and risk classes. Since then, other coastal risk assessment methods have been developed and used to assess the vulnerability of the Pacific and Atlantic coastlines of the United States. Bryan et al. (2001) built distributed process models and assessed the regional vulnerability of coastal areas to sea-level rise using four parameters that described the physical environment, namely elevation, exposure, aspect, and slope. Nicholls et al. (1999) pointed out that the risk of flooding was rising because of global sea-level rise and they predicted that wetlands might be lost and coastal areas would be at risk from storm surges. Researchers in China have also assessed the risks to coastal areas under a changing climate (Wang et al., 2012), but most studies have been at the large scale, and the findings have not been either useful or relevant for local governments.
Because of socio-economic variability at the geographical level, the sensitivity and vulnerability to global change vary greatly across different regions. Local governments and decision-makers, therefore, must take different precautionary measures against change and adapt their management accordingly.
Risk assessment at the national scale is not sufficient to protect individual regions, so risks need to be assessed at regional and local scales (Li et al., 2014a; Bao et al., 2015). Such risk assessments should consider regional and local socio-economic development and should examine how natural systems change in response to interactions between global change and regional and local human activities. The effect of sea level change should be assessed under a range of different future climate change scenarios and with different models. In addition, to ensure resources are used effectively, risk assessments of sea level change should be included in regional or local management systems (Cui et al., 2014; Cheng et al., 2015; Wang et al., 2016).
The geography of Shandong is complicated. Areas of water that are less than 15 m deep extend across 13 000 km2, mudflats cover 3 000 km2, and coastal areas cover 170 000 km2. Salt industries and agriculture, both of which are susceptible to sea level rise, are distributed throughout the province. In the recent past, parts of the coastline and mud flats have been modified by development and reclamation, which may increase the risks from sea level rise under global warming. We believe therefore that the risks of sea level rise across Shandong Province need to be assessed. In this study, the spatial distribution of sea level rise around the coast of Shandong Province was analyzed, increases in sea level were predicted, and the possible impacts and risks were assessed. The findings from this study may contribute to the coastal development plan and to ongoing economic growth and benefits for the inhabitants of Shandong Province (Duan and Xu, 2008; Wen et al., 2016).
2 DATA AND METHOD 2.1 DataData of the natural environment and socioeconomic attributes of the assessment area are needed to assess the risks of sea-level-rise disasters. The socio-economic data included information about the GDP, population, and employment of each county and city for the year of interest (Binzhou Municipal Bureau of Statistics, 2014; Dongying Municipal Bureau of Statistics, 2014; Qingdao Municipal Bureau of Statistics, 2014; Rizhao Municipal Bureau of Statistics, 2014; Weifang Municipal Bureau of Statistics, 2014; Weihai Municipal Bureau of Statistics, 2014; Yantai Municipal Bureau of Statistics, 2014).
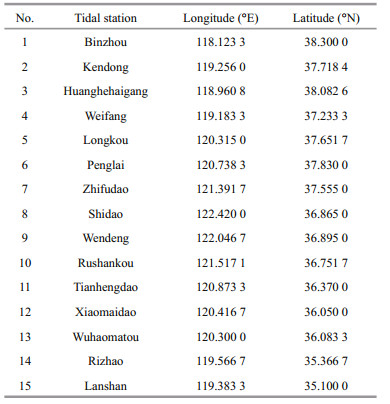
The natural environmental attributes included observations from tidal monitoring stations in each city. In this study, data were collected from 15 tidal stations, including Binzhou, Kendong, Huanghehaigang, Weifang, Longkou, Penglai, Zhifudao, Shidao, Wendeng, Rushankou, Tianhengdao, Xiaomaidao, Wuhaomatou, Rizhao, and Lanshan (details in Table 1 and Fig. 1).

|
| Fig.1 Positions of tidal stations around Shandong Province |
In these stations, nine tidal monitoring stations were more than 10 years old, and 3 were more than 30 years old (Longkou, Zhifu, and Rizhao stations). The tidal data were calibrated to avoid possible errors and maximize accuracy.
2.2 Random dynamical modelStatistical methods, including stochastic dynamics, empirical modal analysis, and gray scale, and Barnett models are generally used to analyze sea level change. The stochastic dynamic model used in this study is very practical and efficient; it is particularly useful for processing long time series of sea level and has been used frequently to analyze and predict sea surface changes (Tian and Chen, 1998; Wang et al., 1999; Ding et al., 2013). The method uses power spectrum analysis to identify the period over which the sealevel changes and the F-test to determine the significance of the period. The model that predicts and analyzes the sea-level rise is established from the pattern in the residuals.
The random dynamic model is a method to get the variability of sea level change. A time series denoted as Y(t) was set as the sea level averaged over N months and was decomposed into the following superposition form:
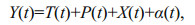 (1)
(1)in which Y(t) is the monthly sea level value; T(t), the deterministic trend term; P(t), a definite periodic term; X(t), a residual random sequence; and α(t), the white noise sequence.
The deterministic trend term was calculated by linear regression and the definite periodic term was estimated using maximum entropy spectrum analysis. As long as the specific expressions and coefficients of the deterministic and random parts are found in the sequence, the original data can be simulated and merged by extrapolation and the rate of sea level rise can be inferred from the trend term.
2.3 Analytical hierarchy processThe Analytical Hierarchy Process (AHP) is used to support decision making and to determine the significance of a set of criteria and sub-criteria of multi-criteria problems (Saaty, 1980; Al-Harbi, 2001; Wei et al., 2005). The aim of the process is to quantify the relative priorities of a given set of alternatives on a ratio scale, based on the judgment of the decisionmaker; the intuitive judgments of a decision-maker and the consistency of the comparisons of alternatives are very important in the decision-making process. By gradually breaking a large problem down in a logical fashion to smaller and smaller problems, the small problems can be connected to the larger problems through simple paired comparison judgments.
2.4 Risk assessment model of sea level riseTo assess the risk of sea level rise, we used a method based on the regional disaster system that uses the results from the hazard, exposure, vulnerability, and response assessments (Fang et al., 2011; Shi, 2011; Wu et al., 2017; Liu et al., 2018). In our assessment of the risk to coastal areas of Shandong Province from sea level rise, we calculated the risk, exposure, vulnerability, and the ability to prevent disasters from data about tides, the natural environment, and the socio-economic situation.
The risk assessment model was built as follows (Li et al., 2014a, b):
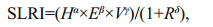 (2)
(2)where SLRI was the sea level rise index and α, β, γ, and δ are the weighting coefficients of hazard (H), exposure (E), vulnerability (V), and response (R), respectively. The values of α, β, γ, and δ are shown in Section 3.2.1. If there is no hazard, exposure or vulnerability in a region, i.e., if H=0, E=0 or V=0, there is no risk in the region (SLRI=0). If people do not respond to defend the region from sea level rise (R=0), the risk depends on the hazard, exposure, and vulnerability (SLRI=Hα×Eβ×Vγ).
The indices of hazard, exposure, vulnerability, response, and risk are calculated with the risk assessment model. This model describes the relationship among risk and hazard, exposure, vulnerability, and response. The risk of sea level rise is proportional to the hazard, exposure, and the vulnerability and inversely proportional to the response. When the values of SLRI are high, the risks of sea level rise for a given region are high.
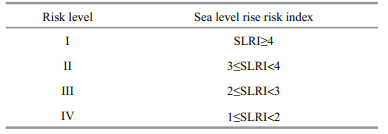
The risk levels of different regions are assessed from the SLRI value in Table 2 and are ranked as level Ⅰ, Ⅱ (high risk), Ⅲ (medium risk), or Ⅳ (low risk) (Li et al., 2014b). From the perspective of risk management, different risk levels need to be addressed and dealt with in different ways. In high-risk regions, developments should be carefully planned and longterm strategies should be formulated. In low-risk regions, there is limited danger from sea level rise and no special measures are needed.
To effectively assess the risk of sea level rise, we selected various indices to describe the hazard, exposure, vulnerability, and response. The hazard related to the risk of sea level rise was assessed from changes in sea level, topography, and the tidal level. Sea level rise and associated secondary disasters mainly affect industrial productivity, and people's lives and social activities, so the exposure and vulnerability were assessed from the population and economic data. By applying a scientifically robust approach to sea level rise, the rate of relative sea level rise can be reduced and the damage caused by disasters can be decreased, with effects on the socioeconomic aspects. Where local funding is available, resources can be used for disaster relief; also, large numbers of young and middle-aged people can join the relief effort in places where a high percentage of the total population is employed.
The SLRI was determined from the data that were available for the coastal cities in Shandong. This was a three-tier index, constructed from various indicators that were grouped into sub-indexes, and the sub-indexes were in turn integrated into a single index. The eleven indicators selected to describe the risk of sea level rise are described below and in Table 3.
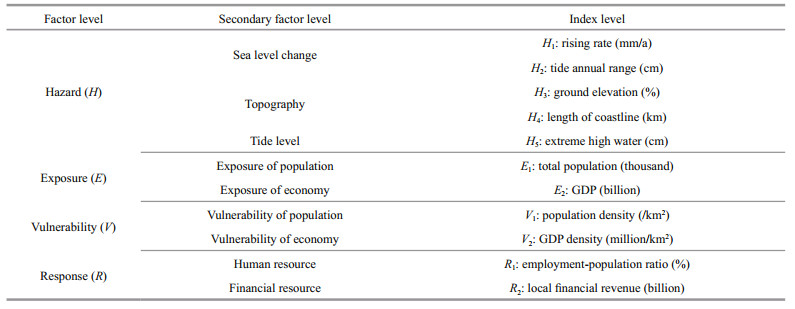
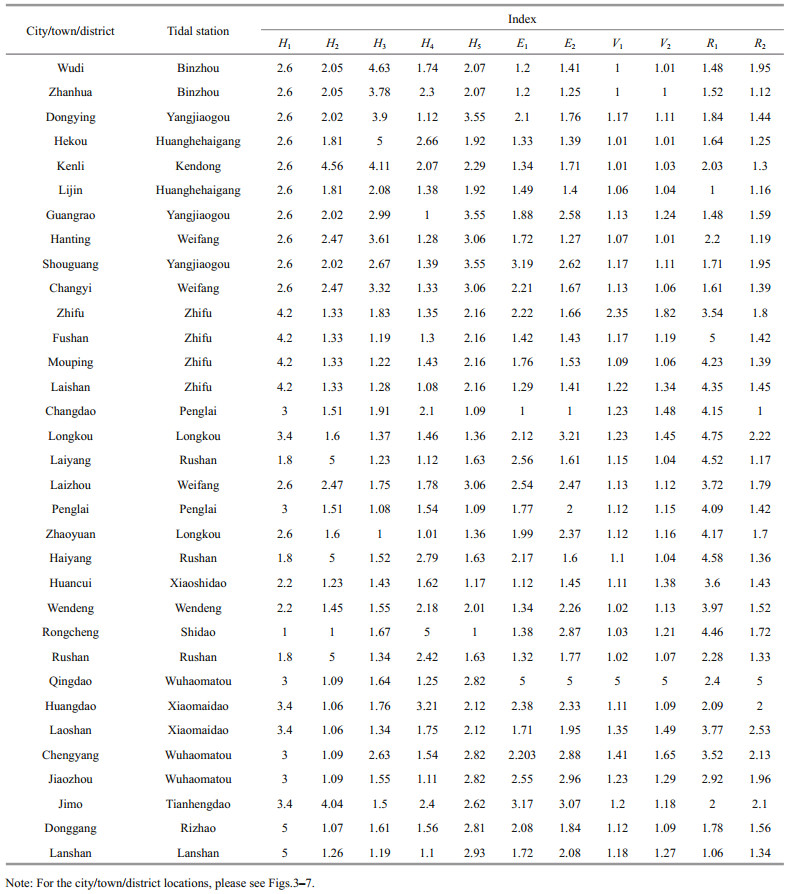
In Table 3, the rising rate (H1, mm/a) is calculated from the observation data from coastal tidal stations. The tidal data were input into the random dynamic model, and the rate of sea level rise was described by the deterministic trend term. The annual tidal range (H2, cm) is calculated from the tidal station data and was the difference between the highest and lowest monthly average tide levels. The ground elevation (H3, %) is the ratio of the areas that are less than 5 m above sea level to the total region. The length of the coastline (H4, km) is the length of the coastline around the region. The extreme high-water level (H5, cm) is obtained from the tidal data. The values are the maximum tide relative to the local mean sea level. The total population (E1, thousand) is the total population living in the region. The GDP (E2, billion) is the gross domestic product in the region. The population density (V1, /km2) of an area is the population divided by the area of the region. The GDP density (V2, million/km2) is the GDP divided by the area of the region. The E1, E2, V1, and V2 indices are quite similar, but in different aspects of risk from sea level rise. E1 and E2 show the total possible losses sustained by personnel and property while V1 and V2 show the density over the study regions. The employment-population ratio (R1, %) is the working population divided by the total population. Local financial revenue (R2, billion) is the general budget revenue of the local region.
The data for assessing the risk of sea level rise were collated. The sea level and tidal level data were calculated from the tidal station data, terrain data were obtained from high-resolution maps, and the socio-economic data were obtained from the statistical yearbooks of various cities.
3.1.2 Standardizing the indicesIndexes have different units and magnitudes and cannot be compared directly. The raw indexes from each assessment region were therefore normalized so that the risks of sea level rise could be compared between the regions.
The raw indexes (p) in each assessment region were sorted and numbered as p1, p2, …, pn, where n was the total number of assessment regions. The indexes were processed as follows:
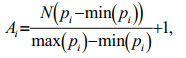 (3)
(3)in which Ai=the normalized index p of the ith region; i=sequence number, i=1, 2, …, n; N=quantization parameter, and pi=the index of the ith region.
The quantization parameter (N) was given a value of 4, so the value range was between 1 and 5. The normalized indexes are shown in Table 4.
The characteristics and degree of influence of each index are different, so the indexes were allocated different weighting coefficients using the AHP method (Jiang et al., 2008; Hu et al., 2010; Zhang et al., 2015). The index weights were calculated from the subindex and index layers.
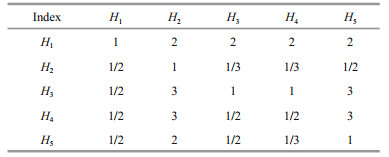
We used the judgment matrix from Li et al. (2014a) and Li et al. (2014b) to calculate the weights of the four sub-indexes, namely hazard (H), exposure (E), vulnerability (V), and disaster prevention and reduction capability (R). This matrix was previously used to analyze questionnaires from risk management and marine disaster experts. The values used to calculate the sub-index weights are shown in Table 5.
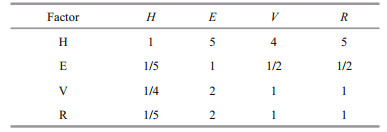
The maximum eigenvalue (λmax) and the eigenvector (W) were calculated with the sum-product method. The λmax was 0.404 73 and the values of W were 0.58, 0.11, 0.16, and 0.15. The coincident indicator (CI) and the consistency ratio (CR) were used to check the matrix for consistency. Values of 0.015 8 and 0.017 5 < 0.1 for CI and CR, respectively, indicated that the results were significant and reliable. The W values were therefore used as the weights for the four sub-indexes (Table 6).

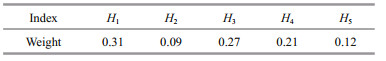
The method that was used to calculate the indicator weights was used to calculate the hazard indexes. From the judgment matrix for the hazard indexes (Table 7), the λmax was 5.315 7 and W values were 0.31, 0.09, 0.27, 0.21, and 0.12. The values of CI and CR were 0.078 8 and 0.070 3, respectively, and were significant, so the values of W were used as the index weights (Table 8).
The population (E1) and GDP (E2), as equally important indicators of the exposure, were allocated weights of 0.5. The population density and GDP density were also given weights of 0.5 in the vulnerability assessment.
For the response assessment, the weights for R1 and R2 were set as 0.4 and 0.6, respectively. These weights were chosen because the local financial revenue was more important for disaster reduction and relief in China than the employment-population ratio.
The weights of the different indicators used to assess the risk of sea level rise are shown in Fig. 2.

|
| Fig.2 Index weights for risk assessment of sea level rise |
The weighted averages of the processed indicators were calculated to give the hazard (H), exposure (E), vulnerability (V), and response (R) sub-indexes. These sub-indexes were used in the risk assessment model.
For example, the hazard (H) was calculated as follows:
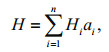 (4)
(4)where H is the hazard sub-index; Hi the ith indicator of hazard; ai the weighting coefficient of the ith indicator; and n the total number of hazard indicators.
3.2.2.1 Hazard assessmentThe hazard sub-index was calculated from the rising rate, annual tidal range, ground elevation, length of the coastline, and the extreme high-water level (Table 9 and Fig. 3). The sea level rise hazard is strongly influenced by the ground elevation and the annual tidal range.

|
| Fig.3 Assessment of hazard in Shandong |
The sea level rise hazard was greater in regions with more mud flats, such as Dongying in the northeast of Shandong, and larger annual tidal ranges, such as Rizhao in the southwest of Shandong, and was low in regions with fewer mud flats, such as Weihai in the eastern part of Shandong.
3.2.2.2 Exposure assessmentThe quantitative values and weightings of the total number of residents and GDP of each assessment area were substituted into the exposure assessment model to calculate the exposure sub-index (E) of each assessment area (Table 9). The exposure was highest in three districts in Qingdao that had large populations and large GDPs and was lowest in Changdao (Fig. 4).

|
| Fig.4 Assessment of exposure in Shandong |
The average population density and GDP density were weighted and the vulnerability sub-index is shown in Table 9 and Fig. 5. The vulnerability was highest in Qiangdao, followed by Zhifu, in northern Shandong. The vulnerabilities of the other regions were similar.

|
| Fig.5 Assessment of vulnerability in Shandong |
The response sub-index was calculated from the normalized employment-population ratio and the local financial revenue (Table 9 and Fig. 6). The eastern part of Shandong was more equipped to respond to sea level rise. The score was highest for Qingdao but was considerably lower for the western part of Shandong.

|
| Fig.6 Assessment of response in Shandong |
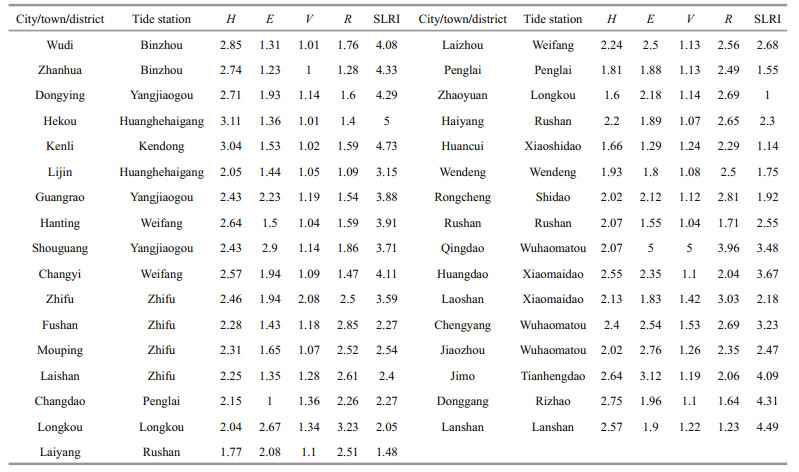
We calculated the risks of sea level rise for the coastal areas of Shandong Province by inserting the results from the hazard, exposure, vulnerability, and response analysis into the equation for the SLRI. The results are shown in Table 9 and Fig. 7.

|
| Fig.7 Risk zoning of sea level rise in Shandong |
The hazard, exposure, and vulnerability subindexes were positive and the response sub-index was negative. Overall, we found that there were high risks of sea level rise in areas along the northern and southern coasts in the western part and relatively low risks in the eastern parts of Shandong.
4 CONCLUSIONIn this study, the risk of sea level rise in Shandong was assessed using 11 indicators that represented the socio-economic setting and the natural environment. The indicators were weighted and the hazard, exposure, vulnerability, and response sub-indexes were calculated. The sea level rise index was then calculated with the risk assessment model. The results show the distribution of risk in Shandong.
The hazard risk was high, and the ability to respond to sea level rise was relatively weak, in the west of Shandong Province, and there were high risks of sea level rise and storm surges on the western coasts of Bohai Bay and Laizhou Bay. Decision makers and planners should pay attention to the western part of Shandong and implement measures to mitigate the risks from sea level rise in the future.
In this paper, both the natural environment and socio-economic attributes have been taken into account in the assessment model and the assessment result is reasonable for the sea level rise risk over Shandong. However, the indicators for socioeconomic attributes are relatively too few. So in the future work, more indicators should be selected to give a more comprehensive assessment.
Slow-rising sea levels may result in an increase in related marine disasters, such as storm tides and coastal erosion, and may have serious consequences for beaches and islands, which might even disappear. Therefore, governments at all levels in these coastal areas in Shandong need to develop long-term plans and take early measures to minimize the adverse effects of sea level rise, to ensure sustainable and harmonious economic development into the future.
5 DATA AVAILABILITY STATEMENTThe data that support the findings of this study are available from the corresponding author on request.
Al-Harbi K M A S. 2001. Application of the AHP in project management. International Journal of Project Management, 19(1): 19-27.
DOI:10.1016/S0263-7863(99)00038-1 |
Bao C X, Wen S Y, Xu L F, Wu T, Zhao D Z, Huang F R, Xu X G. 2015. The Suizhong coastal erosion risk assessment based on sea level rise. Journal of Catastrophology, 30(1): 205-210.
(in Chinese with English abstract) |
Binzhou Municipal Bureau of Statistics. 2014. Binzhou Statistical Yearbook. China Statistics Press, Binzhou. 392p. (in Chinese)
|
Bryan B, Harvey N, Belperio T, Bourman B. 2001. Distributed process modeling for regional assessment of coastal vulnerability to sea-level rise. Environmental Modeling & Assessment, 6(1): 57-65.
DOI:10.1023/A:1011515213106 |
Cheng H Q, Ta N, Zhou Y, Zhu J R, Ruan R L, Chen J Y. 2015. Risk assessment and adaptation of fresh water supply in the Changjiang estuary impacted by sea level rise in the Shanghai city. Progressus Inquisitiones de Mutatione Climatis, 11(4): 263-269.
(in Chinese with English abstract) |
Cui L F, Wang N, Ge Z M, Zhang L Q. 2014. Vulnerability assessment on the coastal wetlands in the Yangtze Estuary under sea-level rise. Chinese Journal of Applied Ecology, 25(2): 553-561.
(in Chinese with English abstract) |
Ding J, Jiang H D, Ying Y. 2013. Sea level rise prediction and submerging analysis of Zhoushan coastal areas. Journal of Hangzhou Normal University (Natural Science Edition), 12(4): 373-378.
(in Chinese with English abstract) |
Dongying Municipal Bureau of Statistics. 2014. Dongying Statistical Yearbook. China Statistics Press, Dongying. 508p.
(in Chinese)
|
Duan X F, Xu X G. 2008. Research progress and perspective of risk assessment of sea level rise. Transactions of Oceanology and Limnology, (4): 116-122.
(in Chinese with English abstract) |
Fang W H, Wang J A, Shi P J. 2011. Integrated Risk Governance-Database, Risk Map and Network Platform. Science Press, Beijing. 375p.
(in Chinese)
|
Gornitz V. 1991. Global coastal hazards from future sea level rise. Palaeogeography Palaeoclimatology Palaeoecology, 89(4): 379-398.
DOI:10.1016/0031-0182(91)90173-O |
Hallegatte S, Ranger N, Mestre O, Dumas P, Corfee-Morlot J, Herweijer C, Wood R M. 2011. Assessing climate change impacts, sea level rise and storm surge risk in port cities: a case study on Copenhagen. Climatic Change, 104(1): 113-137.
DOI:10.1007/s10584-010-9978-3 |
Hu H B, Wang Y C, Xiong Y J. 2010. AHP model-based risk assessment of lighting in Beijing. Journal of Natural Disasters, 19(1): 104-109.
(in Chinese with English abstract) |
Jiang W G, Li J, Chen Y H, Sheng S X, Zhou G H. 2008. Risk assessment system for regional fl ood disaster (Ⅰ): principle and method. Journal of Natural Disasters, 17(6): 53-59.
(in Chinese with English abstract) |
Li X, Duan X F, Liu K X, Chen M C, Zhang Z J. 2014a. The risk assessment research on the sea level rise of Tianjin and Hebei coastal areas. Journal of Catastrophology, 29(3): 108-114.
(in Chinese with English abstract) |
Li X, Liu K X, Dong J X, Wang H, Duan X F, Zhang J L, Lin F Z. 2014b. Research on the risk zoning method of sea level rise in China. Marine Forecasts, 31(2): 41-49.
(in Chinese with English abstract) |
Liu Q R, Ruan C Q, Zhong S, Li J, Yin Z H, Lian X H. 2018. Risk assessment of storm surge disaster based on numerical models and remote sensing. International Journal of Applied Earth Observation and Geoinformation, 68: 20-30.
DOI:10.1016/j.jag.2018.01.016 |
Nicholls R J, Cazenave A. 2010. Sea-level rise and its impact on coastal zones. Science, 328(5985): 1517-1520.
DOI:10.1126/science.1185782 |
Nicholls R J, Hoozemans F M J, Marchand M. 1999. Increasing fl ood risk and wetland losses due to global sea-level rise: regional and global analyses. Global Environmental Change, 9(S1): S69-S87.
DOI:10.1016/S0959-3780(99)00019-9 |
Qingdao Municipal Bureau of Statistics. 2014. Qingdao Statistical Yearbook. China Statistics Press, Qingdao. 360p.
(in Chinese)
|
Rizhao Municipal Bureau of Statistics. 2014. Rizhao Statistical Yearbook. China Statistics Press, Rizhao. 392p.
(in Chinese)
|
Saaty T L. 1980. The Analytic Hierarchy Process. McGraw-Hill, New York.
|
Sahin O, Mohamed S. 2014. Coastal vulnerability to sea-level rise: a spatial-temporal assessment framework. Natural Hazards, 70(1): 395-414.
DOI:10.1007/s11069-013-0818-4 |
Shi P J. 2011. Atlas of Natural Disaster Risk of China. Science Press, Beijing. 244p.
(in Chinese)
|
Tian H, Chen Z Y. 1998. Stochastic dynamical analyses for monthly mean sea level along the coast of China. Acta Oceanologica Sinica, 20(4): 9-16.
(in Chinese with English abstract) |
Wang N, Zhang L Q, Yuan L, Cao H B. 2012. Research into vulnerability assessment for coastal zones in the context of climate change. Acta Ecologica Sinica, 32(7): 2248-2258.
(in Chinese with English abstract) DOI:10.5846/stxb201109291437.(inChinesewithEnglishabstract) |
Wang W Q, Chen Z Y, Zuo J C. 1999. Empirical mode decomposition method for study of the mean sea level variation along the China coast. Acta Oceanologica Sinica, 21(6): 102-109.
(in Chinese with English abstract) |
Wang Y J, Zhang R, Qian L X, Ge S S, Wang F. 2016. Model for probabilistic risk assessment in extreme high water level caused by rising sea level and its application-a case study in Ningbo. Journal of Catastrophology, 31(1): 213-218.
(in Chinese with English abstract) |
Wei C C, Chien C F, Wang M J J. 2005. An AHP-based approach to ERP system selection. International Journal of Production Economics, 96(1): 47-62.
DOI:10.1016/j.ijpe.2004.03.004 |
Weifang Municipal Bureau of Statistics. 2014. Weifang Statistical Yearbook. China Statistics Press, Weifang. 497p.
(in Chinese)
|
Weihai Municipal Bureau of Statistics. 2014. Weihai Statistical Yearbook. China Statistics Press, Weihai. 505p.
(in Chinese)
|
Wen L J, Jiang C B, Ma Z J, Ding Y, Cao Y Z, Liu G Y. 2016. The general situation of marine disasters in Shandong Province during 2010-2014 and the defense strategies. Ocean Development and Management, 33(6): 98-104.
(in Chinese with English abstract) |
Wu S H, Pan T, Liu Y H, Deng H Y, Jiao K W, Lu Q, Feng A Q, Yue X L, Yin Y H, Zhao D S, Gao J B. 2017. Comprehensive climate change risk regionalization of China. Acta Geographica Sinica, 72(1): 3-17.
(in Chinese with English abstract) |
Xu S Y, Wang J, Shi C, Yan J P. 2006. Research of the natural disaster risk on coastal cities. Acta Geographica Sinica, 61(2): 127-138.
(in Chinese with English abstract) |
Yantai Municipal Bureau of Statistics. 2014. Yantai Statistical Yearbook. China Statistics Press, Yantai. 461p.
(in Chinese)
|
Zhang X X, Xu Z Z, Cheng J Y, Shao M H. 2015. Assessment methods of red tide disaster risk: a case in Liaoning coast. Fisheries Science, 34(11): 708-713.
(in Chinese with English abstract) |