 2020, Vol. 38
Institute of Oceanology, Chinese Academy of Sciences
Article Information
- WANG Tao, HU Yadong, ZHU Ming, YIN Shaowu
- Integrated transcriptome and physiology analysis of Microcystis aeruginosa after exposure to copper sulfate
- Journal of Oceanology and Limnology, 38(1): 102-113
- http://dx.doi.org/10.1007/s00343-019-8357-9
Article History
- Received Dec. 17, 2018
- accepted in principle Mar. 8, 2019
- accepted for publication Apr. 15, 2019


2 Co-Innovation Center for Marine Bio-Industry Technology of Jiangsu Province, Lianyungang 222005, China;
3 College of Marine Life and Mariculture, Huaihai Institute of Technology, Lianyungang 222005, China;
4 Nanjing Ocean-wisdom Biotech Company, Nanjing 211132, China
As a result of global temperature and eutrophication, the Microcystis aeruginosa blooms are increasing in the freshwater ecosystems, becoming a global environmental problem (Wu et al., 2017). The direct effects of the mass growth of M. aeruginosa are unpleasant odor, loss of water transparency, and depletion of oxygen. This species produces microcystins (potent hepatotoxins to aquatic and terrestrial animals) that threaten public health regarding drinking water supply and recreational activities such as fishing (Otten and Paerl, 2015).
Many available methods tried to prevent the occurrence of blooms, including physical, chemical, and biological ways. One such a method is to reduce nutrient input into water systems to prevent nutrient enrichment and favor phytoplankton rather than cyanobacteria (Hrudey et al., 1999; Otten and Paerl, 2015), but this method is not particularly successful. Using chemical agents to inhibit or kill cyanobacteria may support ecological restoration and control the occurrence of blooms (Barrington and Ghadouani, 2008). Although the chemical methods may have serious negative impacts on the ecosystem, it has so far been considered an effective strategy to control M. aeruginosa blooms (Zhou et al., 2013; Wu et al., 2017).
At present, copper sulfate (CuSO4) is a low-cost chemical reagent used to inhibit M. aeruginosa blooms, on which many papers have been published documenting toxicity of Cu2+ to Microcystis (Hadjoudja et al., 2009; Wu et al., 2017). Leng et al. (2015) reported that Cu2+ could cause rapid and excessive accumulation of reactive oxygen species (ROS) in M. aeruginosa and disrupt membrane integrity. Rascioa and Navari-Izzo (2011) suggested that the Cu2+ toxicity to plants might be caused by inactivating enzymes, blocking of functional groups of metabolically important molecules, and/or displacing or substituting for essential elements in numerous physiological processes. However, to the best of our knowledge, the published materials did not address the mechanisms of Cu2+ toxicity to M. aeruginosa from a transcriptome perspective. Presently, availability of complete M. aeruginosa genome and high-throughput RNA sequencing (RNA-seq) techniques offer tools for the study on the mechanisms of Cu-dependent stress response in M. aeruginosa (Kaneko et al., 2007; Wang et al., 2017).
A moderate dose of CuSO4 can be used to inhibit the growth of Microcystis and control bloom formation, which is non-toxic to humans and aquatic animals (Zhang et al., 2007; Barrington and Ghadouani, 2008). Tsai (2015) reported that Cu2+ concentration of 0.16 mg/L is the minimum concentration required to inhibit the growth of M. aeruginosa. Zhang et al. (2007) found the 96-h EC50 of M. aeruginosa was 1.02 mg/L Cu2+. The Cu2+ doses below 2 mg/L are considered safe according to the World Health Organization recommendation.
In this study, M. aeruginosa was treated in 0.5 mg/L Cu2+ (half of the 96-h EC50 according to Zhang et al., 2007) for 72 h. We characterized the toxicological effects of Cu2+ at a physiological level. The goals of this study are to construct a M. aeruginosa transcriptome database, to screen the significantly expressed genes under Cu-toxic conditions, to understand Cu2+ toxicity mechanism in M. aeruginosa, and to provide a genetic resource of M. aeruginosa.
2 MATERIAL AND METHOD 2.1 M. aeruginosa culture and Cu2+ treatmentMicrocystis aeruginosa was purchased from the Institute of Hydrobiology, Chinese Academy of Sciences. M. aeruginosa were cultured at 28℃ under 2 500-lx lighting in 12 h/12 h light/dark cycle in BG- 11 medium. The initial concentration of M. aeruginosa in both the control and the treatment was 106 cells/mL, and 0.5 mg Cu2+ (as CuSO4) per liter was added to the treatment group; the study lasted for 72 h. Each treatment was replicated three times. In this experiment, we aimed to monitor the Cu2+ stress responses rather than the algae death, so that the treatment of Cu2+ concentration was chosen carefully. In previous experiments, we found that 0.5 mg/L Cu2+ was the appropriate concentration, resulting in a sharp decline in several physiological traits, while the mortality of M. aeruginosa was below 20%.
2.2 Biochemical analysisPhotosynthetic efficiency was evaluated by using a handy photosynthetic efficiency analyzer (HandyPEA, Hansatech Instruments Ltd, Norfolk, UK). Parameters Fv (variation in fluorescence) and Fm (maximal fluorescence in the dark-adapted state) were measured at 0, 24, 48, and 72 h after commencement of the Cu2+ treatment. Subsequently, the value of Fv/Fm was calculated.
The ROS concentration was measured at 0, 24, 48, and 72 h according to Guo et al. (2016a) after staining the cells by DHR123 (dihydrorhodamine 123) for 1 h. The final concentration of DHR123 in the cell cultures was 5 μmol/L. After incubation, fluorescence (for excitation/emission at a wavelength of 485/530 nm) was measured using a fluorescence spectrophotometer (Model LS-55, PerkinElmer, CA, USA) to quantify the ROS concentration.
At the end of the experiment, chlorophyll a (Chl a) concentration was determined at room temperature using a PHYTO-PAM phytoplankton analyzer (Water-PAM, Walz, Germany). This was performed after keeping the cells in the dark for 7.5 min prior to measurement based on the published method (Gera et al., 2012)
Copper concentration in M. aeruginosa was measured as per Foster et al. (2008). Briefly, approximately 50.0 mg freeze-dried algal sample was digested with 2 mL HNO3 at 120℃. Total Cu2+ was determined by inductively coupled plasma-optical emission spectroscopy (ICP-OES, Optima 7000, PerkinElmer, USA).
Antioxidant enzyme activities were measured using the commercial kits (purchased from Nanjing Jiancheng Bioengineering Research Institute of China, Nanjing, China) (Gui et al., 2010). The total superoxide dismutase (SOD) assay was based on the SOD-mediated inhibition of nitrite formation from hydroxylammonium in the presence of an O2- generator (Hong et al., 2008). The catalase (CAT) activity was defined as the amount of enzyme required to transform 1-μmol H2O2/min at 28℃ and pH 7.0. The peroxidase (POD) activity was defined as a 0.01-absorbance unit change per min at 470 nm. The malondialdehyde (MDA) content was measured based on the chemical reaction between MDA and 2-thiobarbituric acid (TBA), which is expressed as nmol MDA/mg protein (Ohkawa et al., 1979). Total soluble protein was measured using the Bradford method (Bradford, 1976).
2.3 Transcriptome analysis 2.3.1 RNA extraction, cDNA library construction and Illumina deep sequencingTotal RNA samples of Cu2+-treated and control group were extracted using commercial kits (Trizol reagent, Invitrogen, USA), and subsequently used for mRNA purification and library construction following the manufacturer's instructions (the Ultra RNA library prep kit for Illumina, NEB, USA). Then, the samples were sequenced on an Illumina Hiseq 2500, and each sample yielded > 2 Gb of data. Sequencing was completed by the Nanjing Genepioneer Biotechnologies Company (Nanjing, Jiangsu, China). Three repetitions were used for RNA-Sequencing.
2.3.2 Transcriptome data analysisThe procedure of transcriptome data analysis was as follows. Firstly, low quality reads and reads containing adapter or ploy-N were removed from the raw data, generating the high-quality clean data. Secondly, the clean reads were mapped to the M. aeruginosa NIES-843 genome. Thirdly, the numbers of reads mapping to each gene were counted, and FPKM of each transcript was calculated according to the published method (Trapnell et al., 2010). Fourthly, differential expression genes (DEGs) were analyzed by the DESeq R package (Anders and Huber, 2010). The significant DEGs among different samples were identified with P < 0.05 and log2 foldchange > 1. Finally, we used the GOseq R package, COGPipeline and KOBAS software to implement, respectively, the Gene Ontology (GO), Cluster of Orthologous Groups of proteins (COG) and Kyoto Encyclopedia of Genes and Genomes (KEGG) enrichment analyses of DEGs. In our study, the degree of KEGG enrichment was measured using the Richfactor, Q-value, and the number of genes enriched in a KEGG pathway. The Richfactor refers to the ratio of the number of differentially expressed to the total number of annotated genes. The larger the Richfactor value, the greater the degree of enrichment. The Q-value is the P-value after multi-hypotheses test correction in a range of 0–0.05; the closer the value is to zero, the more significant the enrichment (Wang et al., 2018).
2.4 Real-time PCRPurified RNA was reverse-transcribed into cDNA using a First Strand cDNA Synthesis Kit according to the manufacturer's instructions (TaKaRa, Japan). To adjust the quantity of input cDNA, 16S rRNA was used as the internal control (Chen et al., 2015). The primers (as listed in Table 1) for RT-PCR were designed according to the known sequences of M. aeruginosa in National Center for Biotechnology Information (NCBI).
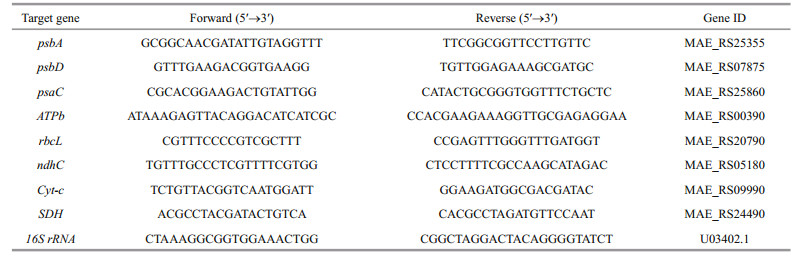
RT-PCR was performed using the SYBR Premix EX Taq (TaKaRa, Japan) on an ABI 7500 Real-Time PCR System. An aliquot of 2.0-μL template cDNA was added to the final volume of 20-μL reaction mixture. The RT-PCR protocol consisted of initial denaturation at 95℃ for 30 s, followed by 35 cycles of 95℃ for 3 s each, and annealing at 60℃ for 34 s. The final dissociation stage included one cycle of 95℃ for 15 s, 60℃ for 1 min and 95℃ for 15 s. In this study, we calculated the relative quantity of the target gene transcripts with respect to the 16S rRNA (Chen et al., 2015) using the 2-ΔΔCt method.
3 RESULT 3.1 Physiological parameters of M. aeruginosaAs shown in Table 2, Cu2+ content in M. aeruginosa increased after Cu2+ exposure for 72 h, while Chl a content in M. aeruginosa sharply decreased. Activities of antioxidant enzymes (SOD, CAT and POD) and MDA concentration were all increased after the 72-h Cu2+ exposure.

|
The value of Fv/Fm was decreased in the Cu2+ treatment with increasing exposure time (Fig. 1a). The cellular ROS production was detected by measuring the specific fluorescence intensity that increased with increasing exposure time in the Cu2+ treatment (Fig. 1b).

|
| Fig.1 The photosynthetic efficiency (a), and ROS accumulation evaluated by fluorescence intensity of DHR 123 (b) |
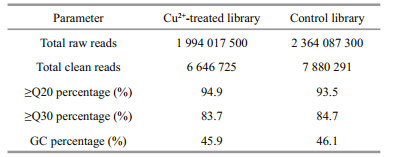
In total, there were 1 994 017 500 raw reads generated from the Cu2+-treated and 2 364 087 300 from the control library (Table 3). After discarding the low quality reads, 6 646 725 and 7 880 91 clean reads were obtained for the Cu2+-treated and control libraries, respectively. Of these clean reads, the Q30 percentage was above 84% and GC content was approximately 46% for the two libraries.
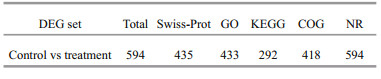
For annotation, all DEGs were aligned to databases such as NR, Swiss-Prot, GO, KEGG, and COG by blastx with an E-value cut-off of 10-5. The results indicate that 594 DEGs in the transcriptome libraries were successfully annotated in at least one of the above databases. Specifically, all DEGs were annotated in the NR database, whereas only 292 had the significant matches in KEGG (Table 4).
GO is a useful program for annotating and analyzing the functional categorization of annotated genes (Conesa et al., 2005). The total of 595 genes (343 up-regulated and 252 down-regulated) with the GO annotations were classified into the following three functional categories: cellular component, molecular function and biological process. In the cellular component category, the majority of the annotated DEGs were assigned to cell, cell part, and membrane. In the molecular function category, the widest distribution of the DEGs was associated with catalytic activity and binding. The majority of the DEGs were involved in the metabolic, cellular and single-organism processes in the category biological process (Fig. 2).

|
| Fig.2 The GO categories of the DEGs According to the GO terms, the annotated DEGs were classified into the cellular component, molecular function and biological process categories. The right panel shows the gene numbers mapped to the GO terms. The left panel shows the proportions of all genes and different genes according to the GO terms. |
COG is a database for the classification of orthologous gene products. The COG analysis of the DEGs provided information about their possible functions. The total of 418 DEGs with 25 functional definitions were obtained (Fig. 3). Among them, 'replication, recombination and repair', 'energy production and conversion', and 'general function prediction only' were the largest three groups of transcripts.

|
| Fig.3 COG classification of all the DEGs The total of 418 significant DEGs were functionally classified into 25 COG categories. |
As shown in Fig. 4, the KEGG enrichment analyses of the DEGs showed that the majority were assigned to three specific KEGG categories, including "environmental information processing", "metabolism" and "genetic information processing". In addition, the KEGG pathway enrichment analysis showed that, among the top 10 enriched pathway for the Cu2+-treated vs control, the "photosynthesis" and "oxidative phosphorylation" pathway was significantly enriched (with Q-value < 0.05 and the largest number of genes enriched).

|
| Fig.4 The KEGG pathway classification assigned to the M. aeruginosa transcripts after 72-h exposure to CuSO4 KEGG pathways were performed for all sequenced transcripts. The numbers to the right of bars represent the actual number of genes transcribed. The largest number of genes enriched with Q-value < 0.05 was marked in red box. |
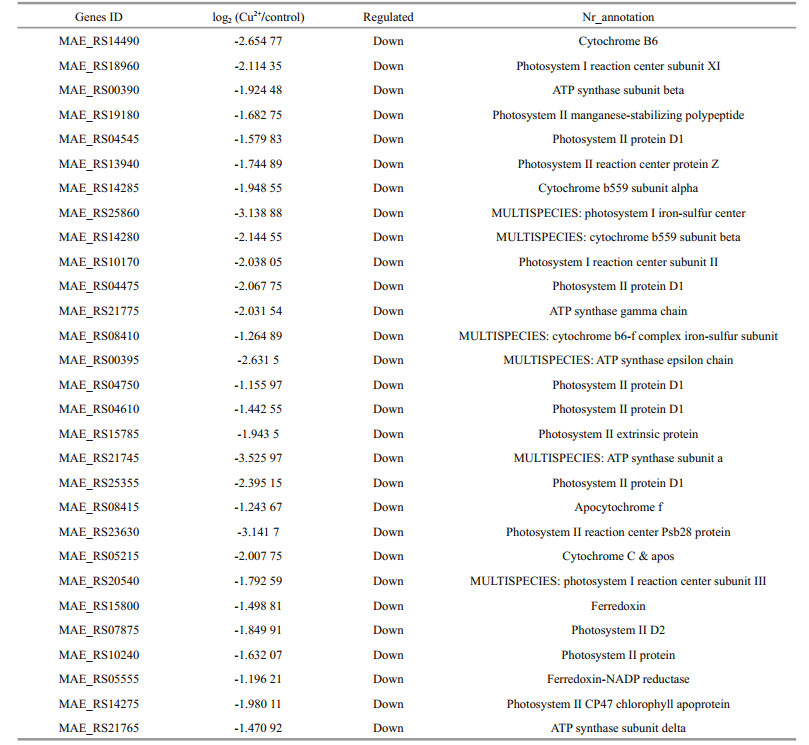
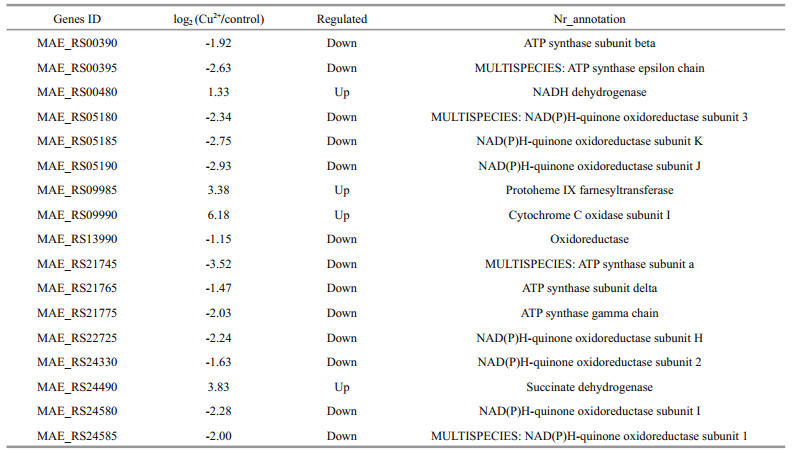
In the present study, 29 genes related to photosynthesis (Table 5) and 17 genes related to oxidative phosphorylation (Table 6) were identified. Among 29 down-regulated photosynthesis genes, most genes were involved in photosystem I (PS I) (4 genes) and photosystem Ⅱ (PSII) (12 genes). Among 17 genes related to oxidative phosphorylation, the ndh series genes (including that coding for NADH dehydrogenase) were the most prevalent.
|
Real-time PCR was used to validate the mRNA expression of eight genes (from those included in Tables 5 and 6). Regardless of the Cu2+ treatment, the mRNAs of rbcL, psbA, psbD, psaC, ATPb, and ndhC were all significantly down-regulated compared to the control. While, the mRNAs of Cyt-c and SDH were significantly up-regulated compared to the control. Hence, the expression patterns were similar to those in the transcriptome (Fig. 5).

In M. aeruginosa, over the entire 72 h of Cu2+ stress, the 8 validated genes displayed various expression patterns, and the transcription of rbcL, psbA, psbD, psaC, ATPb, and ndhC were all decreased at the tested time points. However, the transcription of Cyt-c and SDH were enhanced during the periods of Cu2+ stress (Fig. 6).

|
| Fig.6 RT-PCR analysis of 8 genes (rbcL, psbA, psbD, psaC, ATPb, ndhC, Cyt-c, and SDH) during periods of Cu2+ stress (24, 48, 72 h) in M. aeruginosa The RT-PCR results are the means±SE (n=3). |
There are few related reports on the influence of chemical reagents on M. aeruginosa, and most of these papers are focused on the analysis of physiological parameters such as algae mortality, chlorophyll content and antioxidant enzymes (Hong et al., 2008; Lu et al., 2014; Chen et al., 2015). In this study, we investigated the effect of Cu2+ on the above physiological parameters of M. aeruginosa, and on its transcriptome too.
Copper is a micronutrient essential for the growth of organisms by participating in many physiological processes, such as the photosynthetic and respiratory electron-transport chains, the C and N metabolism, hormone perception, cell wall metabolism, and oxidative stress protection. However, Cu2+ poisoning can occur if organisms take excessive amounts of Cu2+ (Garcia-Molina et al., 2011). In the present study, Cu2+ content in M. aeruginosa increased by 1 356% after Cu2+ exposure for 72 h, with Chl a content in M. aeruginosa sharply decreasing and antioxidant enzymes (SOD, CAT and POD) all increasing. The results indicate that the Cu2+ concentration in BG-11 medium was above the M. aeruginosa growth needs, and led to an oxidative stress in M. aeruginosa. Similar results were reported by Lu et al. (2015) and Wu et al. (2017).
Photosynthesis is one of the most important activities in cyanobacterial cells and is also regarded as a major target of allelopathic substances. In this study, the Fv/Fm ratio indicates the efficiency of photosynthetic apparatus (Shao et al., 2011) by representing the maximum quantum efficiency of PSⅡ photochemistry (Baker, 2008). We find the Fv/Fm value was decreased in the Cu2+ treatment with increasing exposure time, indicating Cu2+ was responsible for the inhibition of photosynthesis. Similar results were reported by Boucher and Carpentier (1999) and Chen et al. (2015) using different metals (e.g. Hg2+, Pb2+, and Na2+).
In order to understand the potential regulatory mechanisms of Cu2+ toxicity stress in M. aeruginosa, RNA-seq technology was used as an important tool for global analysis of gene discovery and molecular mechanisms under environmental stress (Wang et al., 2017). With RNA-seq technology, we sequenced the transcriptomes of Cu2+-treated and untreated M. aeruginosa, respectively, and obtained 6 646 725 and 7 880 291 clean reads matched to one or more public databases. According to the results of GO classification in our study, most DEGs were involved in the important category of biological process, such as metabolic process, cellular process and singleorganism process. These findings are similar to the result of Wang et al. (2016). However, in another study, 'metallochaperone activity' and 'translation regulator activity' were the most representative (Gai et al., 2012), two categories containing the fewest genes in the study presented here. This difference may be on due to different species used. In addition, the second explanation for functional class differences may be better gene sequence information, existing a series of low-abundance transcripts, being provided by Illumina sequencing platform (this study) than 454 GS-FLX platform (Gai et al., 2012).
In addition to GO analysis, assignments of COG were performed to reveal the diversity of the assembled transcripts while reflecting the global landscape of the transcriptome (Wu et al., 2014; Wang et al., 2016). In this paper, a total of 418 DEGs were obtained, of which 25 have functional definitions. 'Replication, recombination and repair', 'energy production and conversion', and 'general function prediction only' were the largest three groups of transcripts. Hanawalt (2007) reported that the replication and maintenance of the genome are absolute requirements for life. A cell must duplicate its entire complement of DNA with astonishing precision in the face of a barrage of deleterious endogenous and environmental genotoxic agents, as well as the intrinsic chemical instability of the DNA molecule itself. In our study, many DEGs might still need to be functionally verified in our findings, as nucleotide sequencing and protein metabolism of M. aeruginosa could be active.
The KEGG pathway database involves a systematic analysis of inner-cell metabolic pathways and functions of gene products (Wang et al., 2016). In this study, KEGG pathway analysis annotated about half of DEGs, whereas NR database annotated all DEGs identified. Similar results were reported by Wang et al. (2016), in which more DEGs were identified in NR database than other database. However, KEGG pathway database is the widely used database to find enriched pathway. KEGG pathway database is a valuable collection of manually constructed maps representing the current knowledge on the molecular interaction and reaction networks for metabolism, processing of genetic and environmental information, cellular processes, etc. Moreover, KEGG (as a part of a system biology approach) can be considered as a virtual biological system including various types of information essential for the recreation of a living creature (Kanehisa and Goto, 2000). The results of this study indicate that most affected metabolic pathways were in photosynthesis and oxidative phosphorylation. Among the down-regulated photosynthesis genes, most genes were involved in photosystem I (PS I) and photosystem Ⅱ (PSII). Zou et al. (2015) found PS I and PSII in photosynthetic organisms are sensitive to environmental variation. Our transcriptome and RT-PCR results proved that core proteins expressions in the PS I and PSII reaction centers was depressed in response to Cu2+ stress. These findings are consistent with Lu et al. (2014), who examined the effect of the epigallocatechin-3- gallate treatment on the gene expression of M. aeruginosa.
Through the research, the 29 genes related to photosynthesis can be considered a target for the subsequent Cu2+ stress analysis. Among 16 genes involved in PS I and PSII is the psbA gene that encodes D1 protein as the key protein in the PSII reaction center. The D1 protein is involved in the PSⅡ repair cycle by binding to all the redox active components, while participating in the PSII repair cycle with degrading and resynthesizing in a multistep process (Leu et al., 2002; Leng et al., 2015). As Mulo et al. (2012) reported, in this study the time-dependent down regulation of psbA transcription can impede electron transport and suppress the electron transport activity in PSⅡ. The rubisco protein is encoded by the rbcL gene and acts as a key protein in the lightindependent reactions, involved in the carbon assimilation process (Mulo et al., 2012; Chen et al., 2015). The experimental results reveal that electron transport, energy conversion and photosynthesis of M. aeruginosa are necessary for CO2 fixation, but they are inhibited under Cu2+ conditions. In summary, the hindrance of carbon assimilation under Cu2+ stress suppressed the photosynthesis of M. aeruginosa. Interestingly, 12 differentially expressed transcripts linked to PSII compared to only 4 in PS I, demonstrating that PSII was more sensitive than PSI to Cu2+ toxicity stress, similar results were reported by Boucher and Carpentier (1999) and Leng et al. (2015).
Oxidative phosphorylation is a metabolic pathway in which cells use enzymes to oxidize nutrients, and the energy released during oxidation of the substance in the body provides the coupling reaction process for the synthesis of ATP from ADP and inorganic phosphate (Powell and Somero, 1986). This metabolic pathway was taken place in the mitochondria and releases energy more efficiently than alternative fermentation processes such as anaerobic glycolysis, so that oxidative phosphorylation process is present in most aerobic organisms (Guo et al., 2016b). Although oxidative phosphorylation pathway is a primary part of the metabolism, it produces ROS, which in turn leads to the proliferation of radicals, destroying cells and causing aging and disease (Kuno et al., 1985; Powell and Somero, 1986). In the present study, ROS concentration and antioxidant enzyme activity (e.g. SOD, CAT) increased in M. aeruginosa after 72 h Cu2+ exposure (as above), with excess ROS causing cell damages. Leng et al. (2015) reported NADPH oxidase has been suggested to play a crucial role in the generation and accumulation of ROS in cyanobacteria under stress conditions.
It was worth nothing that the 17 differentially expressed genes related to oxidative phosphorylation could be used as the targets genes for oxidative analysis. Among these genes, ndh series genes represented the largest proportion. The ndh could encode NADH dehydrogenase, a main component of the electron transport chain that transfers electrons from NADH to coenzyme Q (Lu et al., 2014). In this study, the expression of ndhC gene was timedependent decreased, which might give rise to serious damage to the cells. Furthermore, the ATP synthase genes were also time-dependent down (such as ATPb). Lu et al. (2014) pointed out that the down-regulation of photosynthesis and ATP synthase were markers of the photoinhibition.
5 CONCLUSIONThis study discovered numerous genes that were differentially expressed between the control and Cu2+- toxicity-stressed M. aeruginosa. Transcriptome analysis results indicate that exogenous Cu2+ regulated numerous genes related to photosynthesis and oxidative phosphorylation. The photosynthesis in M. aeruginosa was hindered by changing carbon assimilation under Cu2+ stress. Our research will help understand and explain the complex molecular mechanisms of M. aeruginosa responses to Cu2+ toxicity stress.
6 DATA AVAILABILITY STATEMENTThe datasets generated during the current study are available from the corresponding author on reasonable request.
7 ACKNOWLEDGEMENTWe thank Genepioneer Biotechnologies (Nanjing, China) for the assistance in analysis of the RNA-seq data.
Anders S, Huber W. 2010. Differential expression analysis for sequence count data. Genome Biology, 11(10): R106.
DOI:10.1186/gb-2010-11-10-r106 |
Baker N R. 2008. Chlorophyll fluorescence:a probe of photosynthesis in vivo. Annual Review of Plant Biology, 59: 89-113.
DOI:10.1146/annurev.arplant.59.032607.092759 |
Barrington D J, Ghadouani A. 2008. Application of hydrogen peroxide for the removal of toxic cyanobacteria and other phytoplankton from wastewater. Environmental Science & Technology, 42(23): 8916-8921.
|
Boucher N, Carpentier R. 1999. Hg2+, Cu2+, and Pb2+-induced changes in photosystem Ⅱ photochemical yield and energy storage in isolated thylakoid membranes:a study using simultaneous fluorescence and photoacoustic measurements. Photosynthesis Research, 59(2-3): 167-174.
|
Bradford M M. 1976. A rapid and sensitive method for the quantitation of microgram quantities of protein utilizing the principle of protein-dye binding. Analytical Biochemistry, 72(1-2): 248-254.
DOI:10.1016/0003-2697(76)90527-3 |
Chen L, Mao F J, Kirumba G C, Jiang C, Manefield M, He Y L. 2015. Changes in metabolites, antioxidant system, and gene expression in Microcystis aeruginosa under sodium chloride stress. Ecotoxicology and Environmental Safety, 122: 126-135.
DOI:10.1016/j.ecoenv.2015.07.011 |
Conesa A, Götz S, García-Gómez J M, Terol J, Talón M, Robles M. 2005. Blast2GO:a universal tool for annotation, visualization and analysis in functional genomics research. Bioinformatics, 21(18): 3674-3676.
DOI:10.1093/bioinformatics/bti610 |
Foster S, Thomson D, Maher W. 2008. Uptake and metabolism of arsenate by anexic cultures of the microalgae Dunaliella tertiolecta and Phaeodactylum tricornutum. Marine Chemistry, 108(3-4): 172-183.
DOI:10.1016/j.marchem.2007.11.005 |
Gai S P, Zhang Y X, Mu P, Liu C Y, Liu S, Dong L, Zheng G S. 2012. Transcriptome analysis of tree peony during chilling requirement fulfillment:assembling, annotation and markers discovering. Gene, 497(2): 256-262.
DOI:10.1016/j.gene.2011.12.013 |
Garcia-Molina A, Andrés-Colás N, Perea-García A, Del ValleTascón S, Peñarrubia L, Puig S. 2011. The intracellular Arabidopsis COPT5 transport protein is required for photosynthetic electron transport under severe copper deficiency. Plant Journal, 65(6): 848-860.
DOI:10.1111/j.1365-313X.2010.04472.x |
Gera A, Alcoverro T, Mascaró O, Pérez M, Romero J. 2012. Exploring the utility of Posidonia oceanica chlorophyll fluorescence as an indicator of water quality within the European Water Framework Directive. Environmental Monitoring and Assessment, 184(6): 3675-3686.
DOI:10.1007/s10661-011-2215-3 |
Gui D, Liu W B, Shao X P, Xu W N. 2010. Effects of different dietary levels of cottonseed meal protein hydrolysate on growth, digestibility, body composition and serum biochemical indices in crucian carp (Carassius auratus gibelio). Animal Feed Science and Technology, 156(3-4): 112-120.
DOI:10.1016/j.anifeedsci.2010.01.012 |
Guo R Y, Lim W A, Ki J S. 2016a. Genome-wide analysis of transcription and photosynthesis inhibition in the harmful dinoflagellate Prorocentrum minimum in response to the biocide copper sulfate. Harmful Algae, 57: 27-38.
DOI:10.1016/j.hal.2016.05.004 |
Guo R Y, Wang H, Suh Y S, Ki J S. 2016b. Transcriptomic profiles reveal the genome-wide responses of the harmful dinoflagellate Cochlodinium polykrikoides when exposed to the algicide copper sulfate. BMC Genomics, 17: 29.
DOI:10.1186/s12864-015-2341-3 |
Hadjoudja S, Vignoles C, Deluchat V, Lenain JF, Le Jeune AH, Baudu M. 2009. Short term copper toxicity on Microcystis aeruginosa and Chlorella vulgaris using flow cytometry. Aquatic Toxicology, 94(4): 255-264.
DOI:10.1016/j.aquatox.2009.07.007 |
Hanawalt P C. 2007. Paradigms for the Three Rs:DNA replication, recombination, and repair. Molecular Cell, 28(5): 702-707.
DOI:10.1016/j.molcel.2007.11.014 |
Hong Y, Hu H Y, Xie X, Li F M. 2008. Responses of enzymatic antioxidants and non-enzymatic antioxidants in the cyanobacterium Microcystis aeruginosa to the allelochemical ethyl 2-methyl acetoacetate (EMA)isolated from reed (Phragmites communis). Journal of Plant Physiology, 165(12): 1264-1273.
DOI:10.1016/j.jplph.2007.10.007 |
Hrudey S, Burch M D, Drikas M, Gregory R. 1999. Remedial measures. In: Chorus I, Bartram J eds. Toxic Cyanobacteria in Water: A Guide to Their Public Health Consequences, Monitoring, and Management. E & FN Spon, New York.p.275-312.
|
Kanehisa M, Goto S. 2000. KEGG:Kyoto encyclopedia of genes and genomes. Nucleic Acids Research, 28(1): 27-30.
|
Kaneko T, Nakajima N, Okamoto S, Suzuki I, Tanabe Y, Tamaoki M, Nakamura Y, Kasai F, Watanabe A, Kawashima K, Kishida Y, Ono A, Shimizu Y, Takahashi C, Minami C, Fujishiro T, Kohara M, Katoh M, Nakazaki N, Nakayama S, Yamada M, Tabata S, Watanabe MM. 2007. Complete genomic structure of the bloom-forming toxic cyanobacterium Microcystis aeruginosa NIES-843. DNA Research, 14(6): 247-256.
DOI:10.1093/dnares/dsm026 |
Kuno S, Bacher A, Simon H. 1985. Structure of enoate reductase from a Clostridium tyrobutyricum (Cspec. La1). Biological Chemistry Hoppe-Seyler, 366(5): 463-472.
|
Leng X P, Jia H F, Sun X, Shangguan L F, Mu Q, Wang B J, Fang J G. 2015. Comparative transcriptome analysis of grapevine in response to copper stress. Scientific Reports, 5: 17749.
DOI:10.1038/srep17749 |
Leu E, Krieger-Liszkay A, Goussias C, Gross E M. 2002. Polyphenolic allelochemicals from the aquatic angiosperm Myriophyllum spicatum inhibit photosystem Ⅱ. Plant Physiology, 130(4): 2011-2018.
DOI:10.1104/pp.011593 |
Lu L, Wu Y X, Ding H J, Zhang W H. 2015. The combined and second exposure effect of copper (Ⅱ) and chlortetracycline on fresh water algae, Chlorella pyrenoidosa and Microcystis aeruginosa. Environmental Toxicology and Pharmacology, 40(1): 140-148.
DOI:10.1016/j.etap.2015.06.006 |
Lu Y P, Wang J, Yu Y, Shi L M, Kong F X. 2014. Changes in the physiology and gene expression of Microcystis aeruginosa under EGCG stress. Chemosphere, 117: 164-169.
DOI:10.1016/j.chemosphere.2014.06.040 |
Mulo P, Sakurai I, Aro E M. 2012. Strategies for psbA gene expression in cyanobacteria, green algae and higher plants:from transcription to PSII repair. Biochimica et Biophysica Acta, 1817(1): 247-257.
DOI:10.1016/j.bbabio.2011.04.011 |
Ohkawa H, Ohishi N, Yagi K. 1979. Assay for lipid peroxides in animal tissues by thiobarbituric acid reaction. Analytical Biochemistry, 95(2): 351-358.
|
Otten T G, Paerl H W. 2015. Health effects of toxic cyanobacteria in U. S. drinking and recreational waters:our current understanding and proposed direction. Current Environmental Health Reports, 2(1): 75-84.
|
Powell M A, Somero G N. 1986. Hydrogen sulfide oxidation is coupled to oxidative phosphorylation in mitochondria of Solemya reidi. Science, 233(4763): 563-566.
DOI:10.1126/science.233.4763.563 |
Rascioa N, Navari-Izzo F. 2011. Heavy metal hyperaccumulating plants:how and why do they do it?And what makes them so interesting?. Plant Science, 180(2): 169-181.
DOI:10.1016/j.plantsci.2010.08.016 |
Shao J H, Xu Y, Wang Z J, Jiang Y G, Yu G L, Peng X, Li R H. 2011. Elucidating the toxicity targets of β-ionone on photosynthetic system of Microcystis aeruginosa NIES-843 (Cyanobacteria). Aquatic Toxicology, 104(1-2): 48-55.
DOI:10.1016/j.aquatox.2011.03.014 |
Trapnell C, Williams B A, Pertea G, Mortazavi A, Kwan G, van Baren M J, Salzberg S L, Wold B J, Pachter L. 2010. Transcript assembly and quantification by RNA-Seq reveals unannotated transcripts and isoform switching during cell differentiation. Nature Biotechnology, 28(5): 511-515.
DOI:10.1038/nbt.1621 |
Tsai K P. 2015. Effects of two copper compounds on Microcystis aeruginosa cell density, membrane integrity, and microcystin release. Ecotoxicology and Environmental Safety, 120: 428-435.
DOI:10.1016/j.ecoenv.2015.06.024 |
Wang T, Long X H, Chen X Y, Liu Y R, Liu Z P, Han S Q, Yan S H. 2017. Integrated transcriptome, proteome and physiology analysis of Epinephelus coioides after exposure to copper nanoparticles or copper sulfate. Nanotoxicology, 11(2): 236-246.
DOI:10.1080/17435390.2017.1290291 |
Wang X H, Hui F, Yang Y C, Yang S H. 2018. Deep sequencing and transcriptome analysis to identify genes related to biosynthesis of aristolochic acid in Asarum heterotropoides. Scientific Reports, 8: 17850.
DOI:10.1038/s41598-018-36316-0 |
Wang Y J, Dong C L, Xue Z Y, Jin Q J, Xu Y C. 2016. De novo transcriptome sequencing and discovery of genes related to copper tolerance in Paeonia ostii. Gene, 576(1): 126-135.
DOI:10.1016/j.gene.2015.09.077 |
Wu H M, Wei G J, Tan X, Li L, Li M. 2017. Species-dependent variation in sensitivity of Microcystis species to copper sulfate:implication in algal toxicity of copper and controls of blooms. Scientific Reports, 7: 40393.
DOI:10.1038/srep40393 |
Wu H X, Jia H M, Ma X W, Wang S B, Yao Q S, Xu W T, Zhou Y G, Gao Z S, Zhan R L. 2014. Transcriptome and proteomic analysis of mango (Mangifera indica Linn) fruits. Journal of Proteomics, 105: 19-30.
DOI:10.1016/j.jprot.2014.03.030 |
Zhang S L, Xing K Z, Zhou Y. 2007. The acute toxicity of copper ion on alga Microcystis aeruginosa. Fisheries Science, 26(6): 323-326.
(in Chinese with English abstract) |
Zhou S Q, Shao Y S, Gao N Y, Deng Y, Qiao J L, Ou H S, Deng J. 2013. Effects of different algaecides on the photosynthetic capacity, cell integrity and microcystinLR release of Microcystis aeruginosa. Science of the Total Environment, 463-464: 111-119.
DOI:10.1016/j.scitotenv.2013.05.064 |
Zou H X, Pang Q Y, Zhang A Q, Lin L D, Li N, Yan X F. 2015. Excess copper induced proteomic changes in the marine brown algae Sargassum fusiforme. Ecotoxicology and Environmental Safety, 111: 271-280.
DOI:10.1016/j.ecoenv.2014.10.028 |