 2020, Vol. 38
Institute of Oceanology, Chinese Academy of Sciences
Article Information
- MA Rui, MENG Yuqiong, ZHANG Wenbing, MAI Kangsen
- Comparative study on the organoleptic quality of wild and farmed large yellow croaker Larimichthys crocea
- Journal of Oceanology and Limnology, 38(1): 260-274
- http://dx.doi.org/10.1007/s00343-019-8353-0
Article History
- Received Dec. 24, 2018
- accepted in principle Apr. 19, 2019
- accepted for publication May. 16, 2019


2 State Key Laboratory of Plateau Ecology and Agriculture, Qinghai University, Xining 810016, China;
3 Laboratory for Marine Fisheries Science and Food Production Processes, Qingdao National Laboratory for Marine Science and Technology, Qingdao 266237, China
As the dwindling wild fish resources, the only way to meet the increasing demand for fish as a food is through aquaculture (Cressey, 2009). Yet the aquaculture industry faces a challenge in supplying the final product with better quality for consumer. Fish quality is an overall characteristic involving a set of factors such as morphology, color, texture, odor, taste, and so forth. It has been reported that the significant quality differences between wild fish and farmed fish were shown in morphology (Johnston et al., 2006; Arechavala-Lopez et al., 2012), color (Grigorakis et al., 2003; González et al., 2006; Glover et al., 2009; Fasolato et al., 2010), flesh texture (González et al., 2006; Johnston et al., 2006; Fuentes et al., 2010), and flavor (Prost et al., 1998; Grigorakis et al., 2003; Frank et al., 2009).
Large yellow croaker Larimichthys crocea is mainly limited to coastal waters of continental East Asia, is one of three top commercial marine fishes of China (Chen et al., 2018). In natural condition, the fish live in offshore deeper water (60–100 m), and migrate and spawn in shallow coastal (< 30 m) waters in spring and/or autumn (Liu and De Mitcheson, 2008). Normally, the wild large yellow croaker has golden-yellow skin, red lips, and yellow fins. In China, it is one of the most popular fish species for human consumption. One of the most important reasons is that the red-yellow-golden color means "fortune" and "happiness" in Chinese traditional culture. However, the population of the wild large yellow croaker collapsed in the 1970s due to overfishing. Since the success of artificial hatchery, this fish has been widely cultured in China, and become a major mariculture fish species reaching 177 640 tons of yield in 2017 (China Fishery Statistical Yearbook, 2018). Compared with the wild one, there are severe quality problems in farmed large yellow croaker, such as vague yellow body color, degenerated fish flavor, and loosed flesh firmness. These problems have seriously threatened the sustainable development of large yellow croaker industry. Recently, some studies have focused on the quality of large yellow croaker (Yi et al., 2014; Wei et al., 2016, 2018; Li et al., 2017; Mu et al., 2017). However, there was no systematic study on the organoleptic quality of this fish.
Most of farmed large yellow croakers are still fed with trash fish, and less 30% of them with compound feeds (Chen et al., 2018). However, the percentage of compound feeds used in large yellow croaker culture was increasing rapidly in the past few years. The trash fish is mainly made up of less valuable fish species from wild catch, such as anchovies (Cheng and Hu, 2012). The typical compound feeds for large yellow croaker contain several feed ingredients with 40%– 50% of protein sources (e.g., fish meal, soybean meal), 9%–12% of lipid sources (e.g., fish oil, plant oil), carbohydrates, vitamins and minerals (He et al., 2010; based on data of feed industries). The nutritional values between trash fish and compound feeds are different (Chen et al., 2008), and that can result in different quality of farmed large yellow croaker fed with trash fish or compound feeds.
The aim of this study was to compare the differences in organoleptic quality between wild and farmed large yellow croaker. By determining the organoleptic quality indices (e.g., body index, skin color, flesh texture, and flavor), we preliminarily established a system with multiple indices to evaluate the quality of farmed large yellow croaker. It shall be helpful for the evaluation or improvement of the quality of farmed large yellow croaker.
2 MATERIAL AND METHOD 2.1 MaterialThe present study was performed in strict accordance with the Standard Operation Procedures (SOPs) of the Guide for the Use of Experimental Animals of Ocean University of China. All animal care and use procedures were approved by the Institutional Animal Care and Use Committee of Ocean University of China (Permit Number: 20001001). In this work, three different groups of large yellow croaker (one wild group and two farmed groups) were studied. Six fresh wild fish (WF, body weight: 519.6±10.6 g) were captured from the Ningbo sea area, Zhejiang, China in November. At the same time, two groups of farmed large yellow croaker were obtained from two commercial sea net cages in Ningbo, China, respectively. Each group also had six fish. One of the farmed groups was the trash-fish-fed large yellow croaker (TF, body weight: 501.3±10.0 g). The other farmed group was the feeds-fed large yellow croaker (FF, body weight: 518.5±21.4 g). A same batch of fish with initial body weight of about 3 g were divided into two groups, and then fed with trash fish and compound feeds, respectively, for 18 months to the market size. The differences of nutrient compositions on wet basis between trash fish and feeds were 77.4% vs 8.6% moisture, 15.2% vs 48.6% crude protein, 2.1% vs 8.3% crude lipid.
All fish were anaesthetized with eugenol (1:10 000) (Shanghai Reagent Corp., Shanghai, China) to minimize suffering before sampling. The body weight, body length and skin color of each fish were measured and recorded, and then the scale and viscera were removed. After that, both right and left fish muscles were filleted and decorticated. Fish fillets were divided into several segments. Specific segment was selected for the analysis of flesh quality (Fig. 1). Texture, water holding capacity (WHC) and pH of muscle were tested immediately. The other muscle segments were stored at -80℃.

|
| Fig.1 Sampling segments for measurements of different quality indices in muscle of large yellow croaker Segment A was used to assay muscle color, texture, hydroxyproline (HYP), pyridinoline crosslink (PYD) and water/salt soluble protein; segment B was used to assay water holding capacity; segment C was used to assay pH; Segment D was used to assay free amino acid; segment E was used to assay moisture, total protein; segment F was used to assay nucleotides, trimethylamine oxide (TMAO) and trimethylamine (TMA); segment G was used to assay lipid, fatty acid, volatile compounds and mineral elements. |
The body weight (W) and length (L) of each fish was measured. Condition factor (CF) was calculated as:

Skin and muscle color were measured directly using a Minolta colorimeter (CR-400, Japan) to determine L* (lightness), a* (redness) and b* (yellowness) according to the CIE standard (McLaren, 1976). Each fish was measured at three neighboring spots for dorsum, lateral line and abdomen skin, as well as three spots for lateral line muscle.
2.2.3 pH and water holding capacityMuscle pH was measured in a muscle/water (1:9, w/v) homogenate and determined by pH-meter (PB- 10, Sartorius, Germany) according to the method described by Fuentes et al. (2010). Water holding capacity was determined by centrifugation at 4 000×g for 10 min at room temperature, as described by Gómez-Guillén et al. (2000).
2.2.4 TextureFillet texture was evaluated mechanically using a texture analyzer (TMS-PRO, FTC, USA) equipped with a load cell of 25 kg and a cylindrical probe (8 mm). Double compression was applied to construct the texture profile analyses (TPA) on three neighboring spots for each fish fillet above the lateral line (Fig. 1). The detection rate and the strain were set to 30 mm/min and 60%, respectively. Five relative indices, including hardness, adhesiveness, springiness, cohesiveness and chewiness, were obtained from the TPA according to the methods described by Ginés et al. (2004). After texture measurement, the fish muscles were stored at -80℃ to assay the contents of hydroxyproline (HYP), pyridinoline crosslink (PYD) and water/salt soluble protein.
2.2.5 Hydroxyproline and pyridinoline crosslinkThe fish muscle samples used for texture analysis were firstly extracted with an alkaline solution to obtain alkaline-soluble and alkaline-insoluble fractions, which represented non-matured and matured collagen, respectively (Li et al., 2005). One gram of muscle sample was minced by hand before homogenization in 9 mL cold water (4℃) for 1 min. Ten millimeters of ice cold 0.2 mol/L NaOH was added immediately, and the sample was mixed on a swing table at 4℃ for 4 h. The homogenate was centrifuged at 10 000×g for 30 min at 4℃ (ultracentrifuge, CR21GII, Hitachi, Japan). The supernatant containing alkaline-soluble hydroxyproline (a-s HYP) was stored at 4℃ for HYP assay, and the pellet containing alkaline-insoluble hydroxyproline (a-i HYP) was transferred to 5 mL ampoule before adding 3 mL of 6 mol/L HCL. The sample was hydrolyzed at 110℃ for 20 h, after which the hydrolysate was diluted into 10 mL volumetric flasks with ultra-pure water, and 1 mL dilution was removed for HYP assay. The HYP concentration was assayed by spectrophotometer method (UV-2401PC, Shimadzu, Japan) described by Zhang et al. (2013). Pyridinoline crosslink concentrations of fish samples were assayed using a commercial ELISA assay kit (Yueyan Biotech, Inc., Shanghai, China).
2.2.6 Water/salt soluble protein (WSP/SSP)Water and salt soluble protein were determined after extraction with phosphate buffer (0.05 mol/L, pH 7.0) alone or with KCL (0.6 mol/L), respectively, based on the method of Sigholt et al. (1997). Protein content in the water and salt soluble fractions was measured by a commercial assay kit (Nanjing Jiancheng Bioengineering Institute, China) using coomassie brilliant blue method (Bradford, 1976).
2.2.7 Moisture and total proteinThe moisture and total protein contents in the fish muscle samples (Fig. 1) were assay using standard methods of the Association of Official Analytical Chemists (1995). Samples were dried to a constant weight at 105℃ to determine moisture. Total protein was determined by measuring nitrogen (N×6.25) using the Kjeldahl method (2300-Auto-analyzer, FOSS, Denmark).
2.2.8 Lipid, fatty acid compositionAbout 5 g muscle was used to analyze the lipid and fatty acid compositions after lyophilization (ALPHA 1-4 LD lyophilizer, Kleist, Germany). The lipid content was analyzed according to the method of Folch et al. (1957). Fatty acid compositions were analyzed by the gas chromatography (GC-2010, Shimadzu, Japan). Lyophilized muscle powder with 0.1 g was added into a 15-mL volumetric screwed glass tube. Then 3 mL of 1 mol/L potassium hydroxide methanol was added and heated on 72℃ water bath for 20 min. After that, 3 mL of 2 mol/L HCL-methanol was added and the mixture was heated on 72℃ water bath for another 20 min. Then 2 mL hexane was added into the mixture above. The mixture was shaken vigorously for 1 min and then allowed to separate into two layers. One milliliter upper layer liquid was removed and centrifuged at 3 500×g for 5 min. At last, the supernatant was used for GC analyses with Rxi-1MS capillary column (30 m×0.25 mm, 0.25 μm). The column temperature programmed from 150℃ to 200℃ at 15℃/min, then from 200℃ to 250℃ at 2℃/min. Injector and detector temperatures were both 250℃. The areas under the peaks were integrated using methyl heptadecanoate (C17:0) as the internal standard. Fatty acid was quantified by internal standard concentration and peak area ratio. The concentrations of fatty acid were expressed in milligram equivalents of internal standard for each gram of fish muscle (wet basis).
2.2.9 Volatile compoundVolatile compounds were assayed by the method of Iglesias and Medina (2008) with some modifications using the gas chromatography and mass spectrogram (GCMS-QP2010, Shimadzu, Japan). Five grams of minced muscle and 0.25 g NaCl (5% w/w) were put into a 15-mL headspace vial. All the samples were analyzed by using a manual injection device (Supelco, USA). Prior to extraction, each sample vial was equilibrated for 20 min at 60℃. The CAR-PDMSDVB fiber was exposed to the headspace of a 15-mL sample vial for 35 min at 60℃. After that, the fiber was immediately desorbed in the GC-MS injector to 250℃ during 5 min. In regard to the GC-MS analysis, Rxi-1MS capillary column (30 m×0.25 mm, 0.25 μm) was used to separate compounds. The GC oven temperature program was as follows: 35℃ for 3 min, followed by an increase of 10℃/min to 200℃, then an increase of 20℃/min to final temperature of 260℃, held for 8 min. Carrier gas was helium at 1.5 mL/min. Injector was operated in the splitless mode and its temperature was set at 250℃. Interface temperature was maintained at 280℃. The mass spectrometer was operated in the EI mode (70 eV) and the source temperature was set at 230℃. Acquisition was performed in the 30–500 AMU mass range by scan mode. Identification of volatile compounds was based on mass spectra from library databases (NIST08.LIB), considering similarity higher than 80%. Quantitative determination of volatile alcohols, aldehydes, ketones, acids, hydro carbons and aromatics was performed by the method of internal standard using 2, 4, 6-three methyl pyridine.
2.2.10 Mineral elementLyophilized muscle powder (0.1 g) was weighted and put into the K-flask, and then was hydrolyzed by 10 mL HClO4 followed by adding deionized water to 50 mL. The hydrolysates were filtered through 0.22 μm membrane before assay. Minerals (Al, Ca, Cu, Fe, K, Mg, Mn, Na, and Zn) was analyzed by an inductively coupled plasma-atomic emission spectrophotometer (ICP-OES; VISTA-MPX, Varian, USA).
2.2.11 NucleotideNucleotides content in muscle were assayed using the procedure described by Ryder (1985) with some modifications. Briefly, the extraction procedure for muscle sample was performed at 4℃. One gram muscle was homogenized with 5 mL of 0.6 mol/L HClO4. The homogenate was centrifuged at 3 000×g for 10 min. After adding 5 mL of 0.6 mol/L HClO4 into the solid residue, repeated homogenization and centrifugation were performed. The supernatants were combined in 10 mL volumetric flask and filled up to volume with 0.6 mol/L HClO4 and immediately neutralized to pH 6.5–6.8 with 1 mol/L KOH. After standing for 30 min, the mixture was filtered to remove KClO4 and filled 25 mL the neutralized extract with phosphate buffer (pH=7). The neutralized extract was filtered through 0.22 μm membrane before assay in the reverse-phase high performance liquid chromatography (HPLC; HP 1100, Agilent, USA).
For the HPLC analysis, 5 μL of filtrate was separated on a CAPCELL PAK C18AQ S5 column (4.6 mm×250 mm, Shiseido, Japan) equilibrated at 40℃. The mobile phase was the mixture of 0.04 mol/L KH2PO4 and 0.06 mol/L K2HPO4 (pH=7) used a flow rate of 1.0 mL/min. The eluent was monitored by UV absorption at 260 nm.
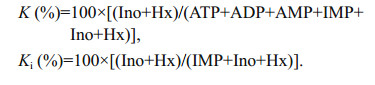
Adenosine-5′-triphosphate (ATP), adenosine-5′- diphosphate (ADP), adenosine-5′- monophosphate (AMP), inosine-5′-monophosphate (IMP), inosine (Ino) and hypoxanthine (Hx) were identified and quantified by retention time and standard curve. The K value and Ki value were calculated based on the following equations:
Contents of TMAO and TMA in muscle were analyzed by the method of Wekell and Barnett (1991) with some modifications. One gram of muscle was homogenized with 4 mL of 7.5% trichloroacetic acid. The homogenate was centrifuged at 3 000×g for 10 min. Supernatant (200 μL) was diluted with 800 μL ultra-pure water before TMAO assay. The other 1 mL supernatant was mixed with 1 mL ultra-pure water before TAM assay.
For TMAO assay, 1 mL Fe-EDTA reagent was added to 1 mL diluent. After incubated in a water bath for 5 min at 50℃, the mixture was used for TAM assay.
For TAM assay, 1 mL of 10% formaldehyde, 10 mL of anhydrous toluene and 3 mL of 50% K2CO3 solution were orderly added into 2 mL of the above mixture. Stoppered tube and shake vigorously by hand about 60 times. After standing 20 min, the water layer was pipetted off, then 0.5 g anhydrous Na2SO4 was added for drying. Five milliliter of toluene layer was moved into 5 mL picric acid solution and mixed by swirling. The mixture was monitored by spectrophotometer at 410 nm (UV-2401PC, Shimadzu, Japan).
For data analysis, TAM content in sample was quantified by standard curves (Sigma). TAMO content was calculated on the basis of the following equations:

One gram of muscle was homogenized with 3 mL of 10% sulfosalicylic acid. Then 1.5 mL homogenate was centrifuged at 13 000×g for 15 min at 4℃. The supernatant was filtered through 0.22 μm membrane before assay free amino acid composition by an automatic amino acid analyzer (L-8900, Hitachi, Japan).
In regard to the automatic amino acid analyzer analysis, a 4.6-mm (ID)×60 mm ion exchange column was used. The following analyzer settings were used for the analysis: buffer flow rate of 0.4 mL/min, reagent flow rate of 0.35 mL/min, reactor heater temperature of 135℃, column temperature of 75℃, auto-sampler temperature of 5–8℃, sample injection volume of 20 μL, and detection wavelength of 570 nm or 440 nm. An external standard was used to calculate the concentration of each amino acid.
2.3 Statistical analysisData are presented as means±S.E.M. (standard error of the mean). One-way ANOVA was conducted using SPSS 17.0 for windows. Duncan's multiple range test was used to compare differences among treatments, when significant differences (P < 0.05) were observed. The quality indices with significant differences were used for the principle component analysis (PCA). The PCA was performed in order to express the main variables in the data through principal components (PC1, PC2…). A high positive or negative loading plot revealed a significant quality variable in the actual PCA model. Score plots from the PCA explore the main trends for fish samples, and their respective loading reveals quality variables with a significant loading. Fish samples with similar quality attributes were located in the same area in the score plot (Torstensen et al., 2005; Veiseth-Kent et al., 2010). Cluster analysis was used to classify the different fish samples based on their score plots.
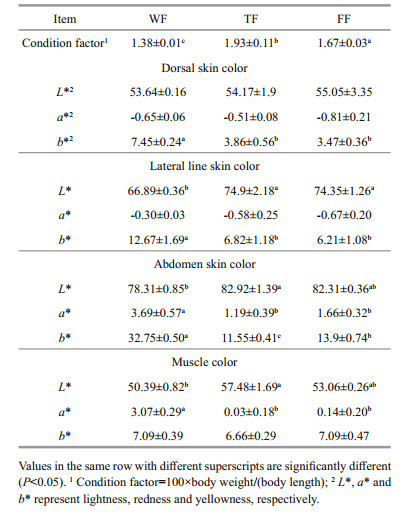
3 RESULT 3.1 Fish appearanceThere were significant differences in CF value among the three groups of large yellow croaker (Table 1). WF had significantly (P < 0.05) lower CF value than TF and FF. Moreover, TF had the highest CF value, which was significantly (P < 0.05) higher than FF.
|
Table 1 shows the skin and muscle color indices of large yellow croaker. WF showed lower L* value in lateral line and abdomen skin, higher b* value in dorsum, lateral line and abdomen skin than TF and FF (P < 0.05). It suggested that WF possessed more yellowness than TF and FF. In addition, FF showed higher b* value in abdomen skin than TF (P < 0.05), but no significant (P > 0.05) difference in other parts. The significant (P < 0.05) differences for muscle color were observed in a* value and L* value, indicating that wild fish fillet possessed more redness than farmed fish fillet.
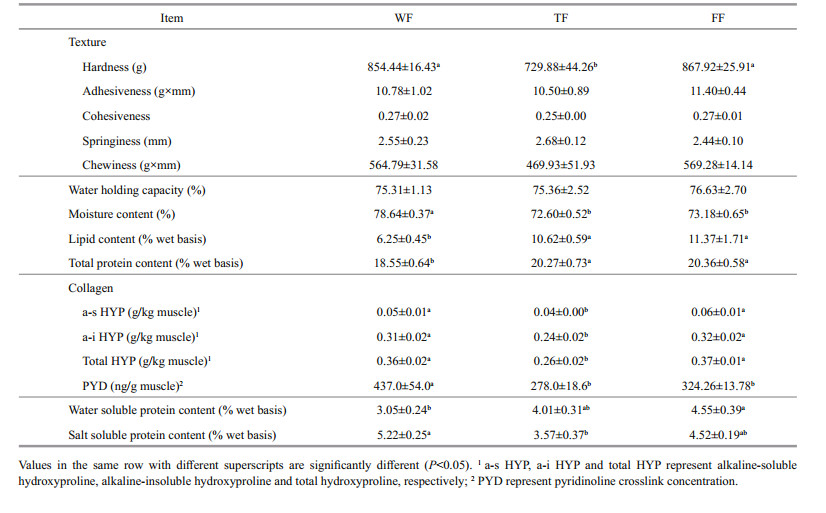
3.2 Fillet textureData on the fillet texture are shown in Table 2. Flesh hardness value of WF and FF were significantly (P < 0.05) higher than that of TF, while no significant (P > 0.05) difference was found between WF and FF. Flesh adhesiveness, springiness, cohesiveness, and chewiness values had no significant (P > 0.05) differences among the three groups.
|
Flesh collagen content (HYP) and crosslink (PYD) were showed significant (P < 0.05) differences among the three groups (Table 2). The a-s HYP, a-i HYP and total HYP contents in WF and FF were significantly (P < 0.05) higher than those in TF, but no significant (P > 0.05) difference was found between WF and FF. WF showed higher PYD content than TF and FF (P < 0.05). However, there was no difference between TF and FF (P > 0.05).
There was no significant (P > 0.05) difference in water holding capacity among the three groups (Table 2). However, significant (P < 0.05) differences were observed in muscle moisture, lipid, water soluble or salt soluble protein content, and total protein content. WF showed higher moisture content but lower lipid and total protein contents than TF and FF (P < 0.05), while no significant (P > 0.05) difference was found between TF and FF. FF had higher water-soluble protein content than WF (P < 0.05), but WF had higher salt-soluble protein content than TF (P < 0.05).
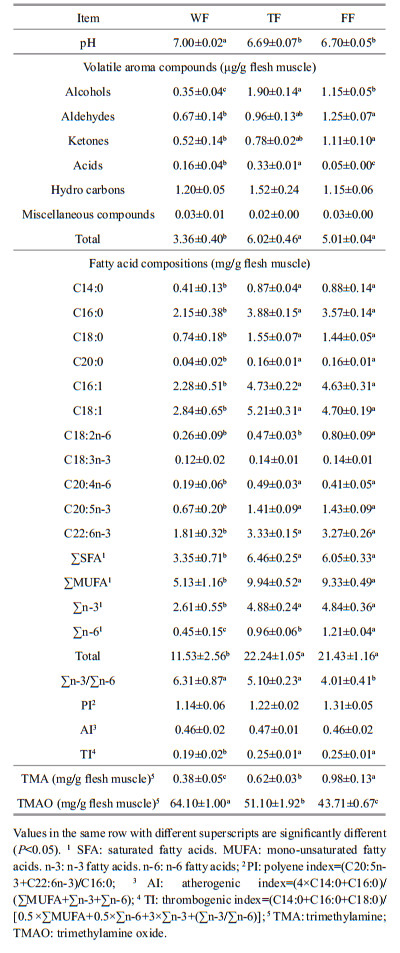
3.3 Fillet odorVolatiles compositions in muscle are shown in Table 3. WF had significantly (P < 0.05) lower total volatiles concentration (TVC, 3.36 μg/g flesh muscle) than TF and FF (6.02 and 5.01 μg/g flesh muscle, respectively). Alcohols, aldehydes and ketones concentrations in WF were lower than those in TF and FF (P < 0.05), but hydro carbons and aromatics had no significant (P > 0.05) differences among three treatments. Compared with FF, TF had higher alcohols and acids concentrations, but lower aldehydes and ketones concentrations.
|
Data on the fatty acid compositions in muscle are shown in Table 3. Saturated fatty acids (∑SFA), mono-unsaturated fatty acids (∑MUFA), n-3 fatty acids (∑n-3), n-6 fatty acids (∑n-6) and total fatty acid (TFA) concentrations as well as thrombogenic index (TI) in WF were significantly (P < 0.05) lower than those in TF and FF, while no significant (P > 0.05) differences were found in linolenic acid concentration as well as polyene index (PI) and atherogenic index (AI) among three treatments. The ratio of ∑n-3 to ∑n-6 (∑n-3/∑n-6) in WF and TF was significantly (P < 0.05) higher than that in FF. No significant (P > 0.05) difference in ∑n-3/∑n-6 was found between WF and TF. Compared with TF, FF had significantly (P < 0.05) higher linoleic acid and ∑n-6 concentrations.
There were significant (P < 0.05) differences in muscle pH, TMA, and TMAO concentration among the three groups (Table 3). WF had significantly (P < 0.05) higher pH value and TMAO concentration but lower TMA concentration than TF and FF. No difference was found in muscle pH between TF and FF (P > 0.05). However, FF had significantly (P < 0.05) higher TMA concentration but lower TMAO concentration than TF.
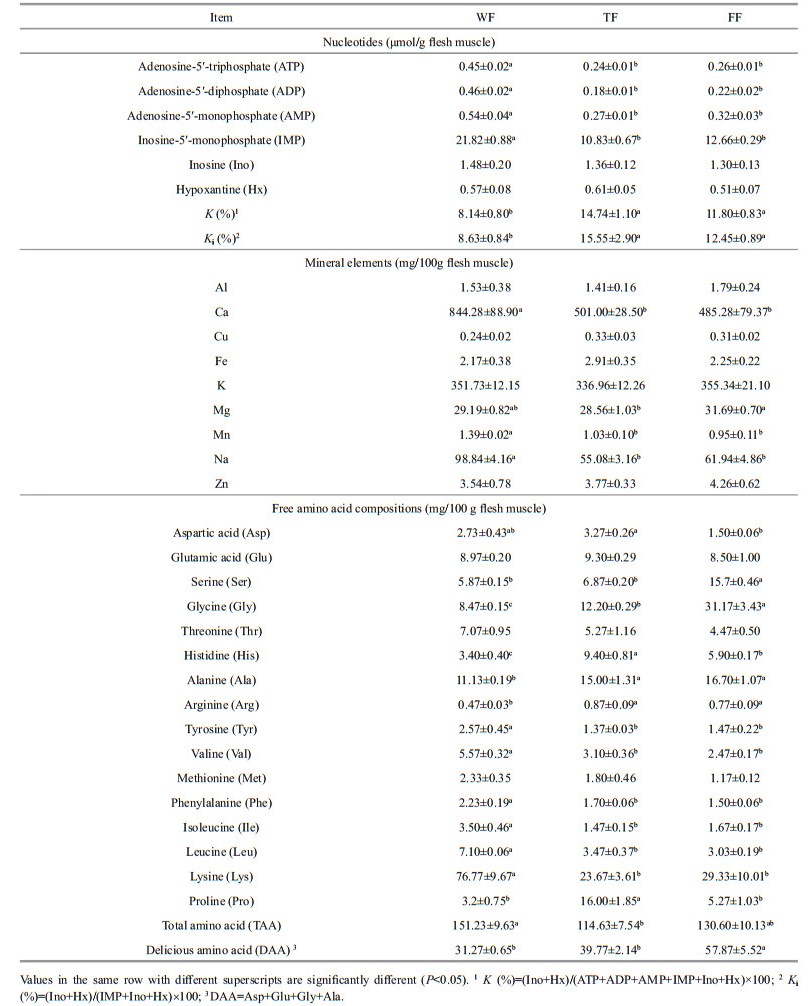
3.4 Fillet tasteData on the nucleotides contents in muscle are shown in Table 4. WF had significantly (P < 0.05) higher ATP, ADP, AMP and IMP contents than TF and FF, while no significant (P > 0.05) differences were found in Ino and Hx contents among the three groups. the lowest K or Ki value were both found in WF compared with those in TF and FF. No significant (P > 0.05) differences were found in ATP, ADP, AMP, and IMP contents between TF and FF.
|
Mineral concentrations in muscle are shown in Table 4. WF had significantly (P < 0.05) higher concentrations of Ca, Mn, and Na than TF and FF. No significant (P > 0.05) differences were found in concentrations of Al, Cu, Fe, K, Mg, and Zn between wild and farmed fish. FF had significantly (P < 0.05) higher Mg concentration than TF, while no significant (P > 0.05) differences were found in other mineral concentrations between FF and TF.
Sixteen kinds of free amino acids were found in muscle (Table 4). WF had the highest content of the total free amino acid (TAA, 151.23 mg/100 g flesh muscle). It had significantly (P < 0.05) higher tyrosine (Tyr), phenylalanine (Phe), isoleucine (Ile), leucine (Leu), and lysine (Lys) contents, but lower serine (Ser), glycine (Gly), histidine (His), alanine (Ala) and arginine (Arg) contents than TF and FF. FF had significantly (P < 0.05) higher contents of Ser and Gly, but lower contents of aspartic acid (Asp), His and proline (Pro) than TF. Delicious amino acid (DAA) content was higher in FF than in WF and TF (P < 0.05), while no significant (P > 0.05) difference was found between WF and TF.
3.5 Multivariate analysesThe principal component analysis (PCA) was done based on 42 muscle quality indices (indicators). The PCA correlation loading plot and score plot are shown in Fig. 2. Eighty percent of the variation in the PCA model is explained by PC1 (66%) and PC2 (14%).

|
| Fig.2 Principal component analysis (PCA) of the results from fish samples showing the first two principal components (PC1 and PC2) a. correlation loading plot of the measured variables (each diamond represented one quality variable); b. score plot showing three pooled samples within each group, each sample consisting of two fish (circle represented wild large yellow croaker (WF); square represented farmed large yellow croaker fed trash fish (TF); triangle represented farmed large yellow croaker fed compound feeds (FF)). |
In the PCA correlation loading plot (Fig. 2a), each diamond represented one quality variable. Quality variables located close to each other had a positive correlation, while variables with loadings of opposite signs were negatively correlated. In the PCA score plot (Fig. 2b), the samples were separated into three clusters related to the different treatments based on cluster analysis. The difference between wild and farmed large yellow croaker was shown mainly along the PC1 axis. The difference between TF and FF was shown mainly along the PC2 axis. Variables lying between the two circles contributed most to the variation in the data (Fig. 2a). Based on the PCA correlation loading plot and information along PC1 axis in PCA score plot, higher values of skin b*, muscle a* and pH, as well as higher concentrations of muscle moisture, PYD, SSP, IMP, TAA, TMAO, Na, Ca, Mn, and the total HYP contributed most to distinguish the wild large yellow croaker. However, higher CF value, skin/muscle L* value, K/Ki value, as well as concentrations of lipid, total protein, WSP, TMA, TVC and TFF contributed most to distinguish the farmed large yellow croaker. Based on the PCA correlation loading plot and information along PC2 axis in PCA score plot, higher hardness as well as higher concentrations of the total HYP, a-i HYP, volatile aldehydes, volatile ketones, TMA, DPP and Mg contributed most to distinguish the farmed large yellow croaker fed compound feeds. Meanwhile, CF value, muscle L* value, ∑n-3/∑n-6 as well as concentrations of volatile alcohols, volatile acid and TMAO contributed most to distinguish the farmed large yellow croaker fed trash fish.
4 DISCUSSIONCondition index is an important quality indicator for large yellow croaker. In the present study, farmed large yellow croaker had higher CF value than wild fish. It was also found in other fish species that wild fish had slim body (Johnston et al., 2006; Arechavala-Lopez et al., 2012). The PCA correlation loading plot (Fig. 2a) in the present study showed that CF value had positive correlation with lipid and protein contents in muscle, but had negative correlation with muscle moisture content. It was suggested that higher CF value in farmed large yellow croaker is related to the higher body lipid and protein content. Ma et al. (2019) also found that CF value of triploid rainbow trout was related positively with deposition of nutrients (protein and lipid) in fish body. The reason could be that farmed fish got higher energy-content feeds and less long-distance sports than wild fish (Haard, 1992).
Skin color is observed daily as a general indicator not only of homeostasis, health, and welfare, but also of fish quality driving customer preference (Leclercq et al., 2010). In the present study, wild large yellow croaker had golden skin and vermilion lip. However, farmed fish appeared whiter skin (higher L* value) and vague yellow color (lower b* value). The reason could be that wild large yellow croaker had easy access to eat crustacean and algae, which contained higher pigment concentration. Previous study showed that supplementation of carotenoid in feeds could enhance the skin color of large yellow croaker (Yi et al., 2014). The present study also found that the yellowness value (b*) of skin in feeds-fed group was higher than that in trash-fish-fed group. Hence, skin color of farmed large yellow croaker could be improved to close to the wild fish by nutritional method. However, further works were needed to study why large yellow croaker deposited yellow color in abdomen skin, and deposited red color in lip. For muscle color, wild large yellow croaker showed higher redness value (a*) and lower lightness value (L*). It was similar with the results in yellow perch (Perca flavescens) (González et al., 2006). Higher proportion of dark muscle in wild fish might be related with continuous swimming motion, low fat content, plentiful blood vasculature, high deposition of melanin due to nutritional factors or enzymatic reactions from tyrosine (González et al., 2006).
Generally, muscle is the final product in fish farming and consumers show a preference for a firm texture (Valente et al., 2013). Previous studies showed that wild fish had higher flesh hardness or firmness than farmed fish (González et al., 2006; Johnston et al., 2006; Fuentes et al., 2010). The similar result between WF and TF was also found in the present study. In addition to the life history (ingestion, motion, and so forth) differences between WF and TF, muscle lipid and collagen contents in fish could be also the important reasons. Fish flesh texture had negative correlation with the muscle lipid content (Mørkøre et al., 2002; Ginés et al., 2004; Johnston et al., 2006). Same result was also found in the present study (Fig. 2a). Collagen is a major constituent of the extracellular matrix termed myocomma, perimysium and endomysium at the different levels (Johnsen et al., 2011). The amount and crosslinks linking (like PYD) of collagen were positively correlated to fish flesh texture (Li et al., 2005; Johnsen et al., 2011). The PCA correlation loading plot (Fig. 2a) also showed that muscle hardness was positively correlated with HYP (collagen) and PYD concentrations in the present study. The interest result was found that FF obtained higher flesh hardness than TF. Firstly, it could be related with muscle collagen. In the present study, a-s HYP, a-i HYP and total HYP concentrations followed the same trend with flesh hardness. Secondly, it could be related with growth speed. Normally, large yellow croaker fed trash fish has higher growth rate than those fed compound feeds. Fast growth could reduce fish flesh hardness (Folkestad et al., 2008).
Haard (1992) considered that the lower moisture content in muscle reflected a higher nutrition level. Lower content of moisture as well as higher contents of lipid and protein in muscle were found in farmed fish in the present study. Similar results were also obtained in previous studies (González et al., 2006; Johnston et al., 2006; Grigorakis, 2007; Fuentes et al., 2010). Protein is an important nutrient content in fish muscle. Based on solubility, there were three categories of proteins in muscle, which were water soluble proteins (primarily sarcoplasmic protein), salt soluble proteins (primarily myofibril protein) and insoluble stroma proteins (primarily collagen) (Haard, 1992). In the present study, wild large yellow croaker had lower protein content in water than farmed fish. Einen et al. (1999) showed that protein content in water in fish muscle increased with the increase of feeds intake. Hence, higher in-water protein content could relate to the higher feeds intake in farmed large yellow croaker. However, wild large yellow croaker had the highest salt solution protein content in this study. A previous study shows that higher salt solution protein content could lead to the decreasing of muscle liquid loss (Mørkøre et al., 2002). It could be another cause of higher moisture content in WF. However, there was no difference in water holding capacity between wild and farmed fish in the present study. Further study is needed.
Odor is an important quality indicator of fish related with consumer preference. Fresh fish odor is mainly generated by volatile aromas compounds (Durnford and Shahidi, 1998). Solid-phase microextraction (SPME) is an efficient extraction method for these volatiles. It has been widely used in volatiles assay of fresh fish muscle (Iglesias et al., 2009; Giogios et al., 2013). Hence, the present study used SPME/GC-MS technology to assay the volatiles compositions. Results showed that wild large yellow croaker had lower total concentration than farmed fish. Frank et al. (2009) also found in barramundi fish (Lates calcarifer) that odor intensities of volatiles were higher in farmed samples compared with wild one. The reasons could be related to the following aspects: 1) Muscle pH. In the present study, wild fish had higher muscle pH than farmed fish. Kawai and Sakaguchi (1996) pointed out that pH strongly affected fish flavor. Lower volatiles were generated by alkaline muscle than those by acid muscle; 2) Muscle fatty acid compositions. Previous studies showed that volatile carbonyl and alcohol compounds were the result of oxidative reactions with polyunsaturated fatty acid (Kawai and Sakaguchi, 1996). The result of total fatty acids concentration was similar with volatiles trend in the present study. In previous studies, wild fish had higher EPA, DHA, and n-3 fatty acids contents, while farmed fish had higher n-6 fatty acids contents (González et al., 2006; Fuentes et al., 2010). However, the lowest absolute contents of EPA, DHA, n-3 and n-6 fatty acids were found in WF. The reason could be the lowest lipid content in wild fish muscle. Vidal et al. (2012) found that wild European seabass (Dicentrarchus labrax) had higher contents (%) of DHA and n-3 fatty acids but lower absolute contents (mg/100 g) than the farmed. Similar results were obtained in the present study. From the PCA correlation loading plot (Fig. 2a), it was shown that the total volatiles concentration had positive correlation with the absolute contents of lipid and fatty acids in muscle, but had negative correlation with the muscle pH. Hence, higher muscle lipid content could lead to higher muscle fatty acids absolute contents as well as lower muscle pH, and then might result in higher volatile contents and odor intensity. The difference in volatile composition between FF and TF could be related with different dietary types and composition. Besides, it has been known that fatty acid profile of fish is related with human health (O'Neill et al., 2015; Šimat et al., 2015). The health indices of atherogenic index (AI) and thrombogenicity index (TI) were proposed to evaluate the predisposition to develop the coronary heart disease by Ulbricht and Southgate (1991). In the present study, the AI value were similar between farmed and wild fish, while the TI value is higher in farmed fish than in wild fish. The same results were also found in rainbow trout (Fallah et al., 2011).
A fishy odor seems to have prejudiced some consumers against eating fish. The TMA is a major odorous compound with strongly fishy odor and is one of the characteristic chemical changes attributed to the spoilage process in fish (Chan et al., 2006). Frank et al. (2009) showed that farmed fish were associated with higher fishy odor, but wild fish with higher prawn odor. The present study also found that farmed large yellow croaker had higher TMA content than wild fish. Muscle TMA is mainly produced from bacterial reduction of TMAO when fish died (Bystedt et al., 1959). The TMAO is chemically similar to methyl donors such as choline, betaine, and S-adenosyl methionine, which are taste active compounds. In the present study, farmed large yellow croaker had lower TMAO content than wild fish. The reason could be that TMAO involved in osmotic regulation of marine teleosts (Raymond, 1994) and wild large yellow croaker needed higher TMAO content to adapt different water environment by osmotic regulation. However, higher TMA content was found in farmed fish, which could be related with higher degraded speed of TMAO, because farmed fish had higher lipid and its oxidative degradation products.
Generally, consumers in China think that wild large yellow croaker is delicious in taste. Based on the difference in taste-related indices between wild and farmed large yellow croaker, in the present study, delicious taste could be related with IMP, TMAO, free amino acid and mineral contents. The IMP is the best known major umami substances acting on a fifth taste system of human with glutamic acid (McCabe and Rolls, 2007). Wild large yellow croaker had higher muscle IMP concentration than farmed fish. After fish death, enzymatic degradation of ATP-ADPAMP-IMP-Ino-Hx was found in fish muscle. More than 90% of the nucleotides in fish muscle are purine derivatives resulting from catabolism of ATP (Mørkøre et al., 2010). In the present study, wild fish muscle also had higher ATP, ADP and AMP concentration, but no difference was found in Ino and Hx concentrations. The result showed that higher IMP concentration in wild large yellow croaker was related with higher IMP precursor concentration. Besides, K value and Ki value are important indicators to fish freshness (Hamada-Sato et al., 2005). Wild large yellow croaker with lower K value and Ki value had higher freshness than farmed fish. Free amino acids such as glutamic acid (Glu), aspartic acid (Asp), alanine (Ala) and glycine (Gly) have important flavor characteristics (Sarma et al., 2013). In the present study, feed-farmed fish had the highest delicious amino acid concentrations (sum of Glu, Asp, Ala and Gly concentration) in muscle. It was indicated that fish taste could be improved by feeding compound feeds. The result was similar with previous study for large yellow croaker (Li et al., 2017). The differences in the free amino acid profile between wild and farmed fish could be related to type of diet or temperautre (Fuentes et al., 2010). Minerals are important constituents of fish flesh because of their nutritive value, safety consideration and their contribution to taste (Haard, 1992). In the present study, wild large yellow croaker had higher mineral concentrations (e.g., Ca, Na, and Mn) than the farmed. The variations of fish muscle mineral concentrations between wild and farmed fish were also found in other studies (González et al., 2006; Grigorakis, 2007; O'Neill et al., 2015). The reason could be related with differences in environment conditions and diet between farmed and wild fish.
5 CONCLUSIONThere were significant differences between wild and farmed large yellow croaker in morphology, color, texture, odor and taste aspects, etc. Based on the results of the quality indices and principle component analysis, it was showed that the farmed large yellow croaker had fatty body shape, whiter skin or muscle color, tender muscle, higher fishy odor or volatile intensity and lower delicious taste. These descriptive characters could be quantitatively estimated by the following quality indices: (1) condition factor in morphology aspect, (2) lightness (L*) and yellowness (b*) values of skin as well as lightness (L*) and redness (a*) values of muscle in color aspect, (3) hardness (TPA), contents of alkalinesoluble/alkaline-insoluble/total hydroxyproline, pyridinoline crosslink, water/salt soluble protein, total protein, lipid and moisture in flesh texture aspect, (4) muscle pH, volatile aromas compounds and concentration as well as trimethylamine content in odor aspect, (5) concentrations of inosine-5′- monophosphate, free amino acid, trimethylamine oxide, minerals as well as K/Ki value in taste aspect. In addition, compared with feeding trash fish, feeding compound feeds could improve the body shape, skin color, flesh texture and fish taste of large yellow croaker. With the principle component analysis and the cluster analysis, we preliminarily established the system to evaluate the organoleptic quality of farmed large yellow croaker. These basic data could contribute to the distinction of different kinds of large yellow croaker for consumers and the further study of improving farmed fish quality.
6 DATA AVAILABILITY STATEMENTThe datasets generated and/or analyzed during the current study available from the corresponding author on reasonable request.
Arechavala-Lopez P, Sanchez-Jerez P, Bayle-Sempere J T, Sfakianakis D G, Somarakis S. 2012. Morphological differences between wild and farmed Mediterranean fish. Hydrobiologia, 679(1): 217-231.
DOI:10.1007/s10750-011-0886-y |
Association of Official Analytical Chemists (AOAC). 1995. Official Methods of Analysis of Official Analytical Chemists International. 16th edn. Association of Official Analytical Chemists, Arlington, VA.
|
Bradford M M. 1976. A rapid and sensitive method for the quantitation of microgram quantities of protein utilizing the principle of protein-dye binding. Anal. Biochem., 72(1-2): 248-254.
DOI:10.1016/0003-2697(76)90527-3 |
Bystedt J, Swenne L, Aas H W. 1959. Determination of trimethylamine oxide in fish muscle. J. Sci. Food Agric., 10(6): 301-304.
DOI:10.1002/jsfa.2740100601 |
Chan S T, Yao M W Y, Wong Y C, Wong T, Mok C S, Sin D W M. 2006. Evaluation of chemical indicators for monitoring freshness of food and determination of volatile amines in fish by headspace solid-phase microextraction and gas chromatography-mass spectrometry. Eur. Food Res. Technol., 224(1): 67-74.
DOI:10.1007/s00217-006-0290-4 |
Chen J X, Guang C T, Xu H, Chen Z X, Xu P, Yan X M, Wang Y T, Liu J F. 2008. Marine fish cage culture in China. In: Lovatelli A, Phillips M J, Arthur J R, Yamamoto K eds. The Future of Mariculture: A Regional Approach for Responsible Development in the Asia-Pacific Region. FAO/NACA Regional Workshop, Rome. p.285-299.
|
Chen S X, Su Y Q, Hong W S. 2018. Aquaculture of the large yellow croaker. In: Gui J F, Tang Q S, Li Z J, Liu J S, De Silva S S eds. Aquaculture in China: Success Stories and Modern Trends. John Wiley & Sons, Hoboken, NJ. p.297-308.
|
Cheng H F, Hu Y N. 2012. Understanding the paradox of mercury pollution in China: high concentrations in environmental matrix yet low levels in fish on the market. Environ. Sci. Technol., 46(9): 4 695-4 696.
DOI:10.1021/es3013744 |
China Fishery Statistical Yearbook. 2018. Fishery Bureau, Ministry of Agriculture. China Agriculture Press, Beijing, China. p.22. (in Chinese)
|
Cressey D. 2009. Aquaculture: future fish. Nature, 458(7237): 398-400.
DOI:10.1038/458398a |
Durnford E, Shahidi F. 1998. Flavours of fish meat. In: Shahidi F ed. Flavor of Meat, Meat Products, and Seafoods. Blackie Academic & Professional, New York. p.131-158.
|
Einen O, Mørkøre T, Rørå A M B, Thomassen M S. 1999. Feed ration prior to slaughter—a potential tool for managing product quality of Atlantic salmon (Salmo salar). Aquaculture, 178(1-2): 149-169.
DOI:10.1016/S0044-8486(99)00126-X |
Fallah A A, Siavash Saei-Dehkordi S, Nematollahi A. 2011. Comparative assessment of proximate composition, physicochemical parameters, fatty acid profile and mineral content in farmed and wild rainbow trout (Oncorhynchus mykiss). Int. J. Food Sci. Technol., 46(4): 767-773.
DOI:10.1111/j.1365-2621.2011.02554.x |
Fasolato L, Novelli E, Salmaso L, Corain L, Camin F, Perini M, Antonetti P, Balzan S. 2010. Application of nonparametric multivariate analyses to the authentication of wild and farmed European sea bass (Dicentrarchus labrax). Results of a survey on fish sampled in the retail trade. J. Agric. Food Chem., 58(20): 10 979-10 988.
DOI:10.1021/jf1015126 |
Folch J, Lees M, Sloane Stanley G H. 1957. A simple method for the isolation and purification of total lipides from animal tissues. J. Biol. Chem., 226(1): 497-509.
|
Folkestad A, Rørvik K A, Kolstad K, Mørkøre T. 2008. Growth rates of individual farmed Atlantic salmon Salmo salar L. influence the texture of raw and smoked fillets. Aquacult. Res., 39(3): 329-332.
DOI:10.1111/j.1365-2109.2007.01862.x |
Frank D, Poole S, Kirchhoff S, Forde C. 2009. Investigation of sensory and volatile characteristics of farmed and wild barramundi (Lates calcarifer) using gas chromatographyolfactometry mass spectrometry and descriptive sensory analysis. J. Agric. Food Chem., 57(21): 10 302-10 312.
DOI:10.1021/jf902030y |
Fuentes A, Fernández-Segovia I, Serra J A, Barat J M. 2010. Comparison of wild and cultured sea bass (Dicentrarchus labrax) quality. Food Chem., 119(4): 1 514-1 518.
|
Ginés R, Valdimarsdottir T, Sveinsdottir K, Thorarensen H. 2004. Effects of rearing temperature and strain on sensory characteristics, texture, colour and fat of Arctic charr (Salvelinus alpinus). Food Qual. Prefer., 15(2): 177-185.
DOI:10.1016/S0950-3293(03)00056-9 |
Giogios I, Grigorakis K, Kalogeropoulos N. 2013. Organoleptic and chemical quality of farmed meagre (Argyrosomus regius) as affected by size. Food Chem., 141(3): 3 153-3 159.
DOI:10.1016/j.foodchem.2013.05.154 |
Glover K A, Otterå H, Olsen R E, Slinde E, Taranger G L, Skaala Ø. 2009. A comparison of farmed, wild and hybrid Atlantic salmon (Salmo salar L.) reared under farming conditions. Aquaculture, 286(3-4): 203-210.
DOI:10.1016/j.aquaculture.2008.09.023 |
Gómez-Guillén M C, Montero P, Hurtado O, Borderías A J. 2000. Biological characteristics affect the quality of farmed Atlantic salmon and smoked muscle. J. Food Sci., 65(1): 53-60.
DOI:10.1111/j.1365-2621.2000.tb15955.x |
González S, Flick G J, O'Keefe S F, Duncan S E, McLean E, Craig S R. 2006. Composition of farmed and wild yellow perch (Perca flavescens). J. Food Compos. Anal., 19(6-7): 720-726.
DOI:10.1016/j.jfca.2006.01.007 |
Grigorakis K, Taylor K D A, Alexis M N. 2003. Organoleptic and volatile aroma compounds comparison of wild and cultured gilthead sea bream (Sparus aurata): sensory differences and possible chemical basis. Aquaculture, 225(1-4): 109-119.
DOI:10.1016/S0044-8486(03)00283-7 |
Grigorakis K. 2007. Compositional and organoleptic quality of farmed and wild gilthead sea bream (Sparus aurata) and sea bass (Dicentrarchus labrax) and factors affecting it: a review. Aquaculture, 272(1-4): 55-75.
DOI:10.1016/j.aquaculture.2007.04.062 |
Haard N F. 1992. Control of chemical composition and food quality attributes of cultured fish. Food Res. Int., 25(4): 289-307.
DOI:10.1016/0963-9969(92)90126-P |
Hamada-Sato N, Usui K, Kobayashi T, Imada C, Watanabe E. 2005. Quality assurance of raw fish based on HACCP concept. Food Control, 16(4): 301-307.
DOI:10.1016/j.foodcont.2004.02.001 |
He Z G, Ai Q H, Mai K S. 2010. Advances in nutrition and feed for large yellow croaker. Feed Ind., 31(24): 56-59.
(in Chinese with English abstract) |
Iglesias J, Medina I, Bianchi F, Careri M, Mangia A, Musci M. 2009. Study of the volatile compounds useful for the characterisation of fresh and frozen-thawed cultured gilthead sea bream fish by solid-phase microextraction gas chromatography-mass spectrometry. Food Chem., 115(4): 1 473-1 478.
DOI:10.1016/j.foodchem.2009.01.076 |
Iglesias J, Medina I. 2008. Solid-phase microextraction method for the determination of volatile compounds associated to oxidation of fish muscle. J. Chromatogr. A, 1192(1): 9-16.
|
Johnsen C A, Hagen Ø, Adler M, Jönsson E, Kling P, Bickerdike R, Solberg C, Björnsson B T, Bendiksen E Å. 2011. Effects of feed, feeding regime and growth rate on flesh quality, connective tissue and plasma hormones in farmed Atlantic salmon (Salmo salar L.). Aquaculture, 318(3-4): 343-354.
DOI:10.1016/j.aquaculture.2011.05.040 |
Johnston I A, Li X J, Vieira V L A, Nickell D, Dingwall A, Alderson R, Campbell P, Bickerdike R. 2006. Muscle and flesh quality traits in wild and farmed Atlantic salmon. Aquaculture, 256(1-4): 323-336.
DOI:10.1016/j.aquaculture.2006.02.048 |
Kawai T, Sakaguchi M. 1996. Fish flavor. Crit. Rev. Food Sci. Nutr., 36(3): 257-298.
DOI:10.1080/10408399609527725 |
Leclercq E, Taylor J F, Migaud H. 2010. Morphological skin colour changes in teleosts. Fish Fish., 11(2): 159-193.
|
Li X L, Bickerdike R, Lindsay E, Campbell P, Nickell D, Dingwall A, Johnston I A. 2005. Hydroxylysyl pyridinoline cross-link concentration affects the textural properties of fresh and smoked Atlantic salmon (Salmo salar L.) flesh. J. Agric. Food Chem., 53(17): 6 844-6 850.
DOI:10.1021/jf050743+ |
Li X Q, Li B A, Chen N S, Huang X X, Hua X M, Leng X J. 2017. A comparison study on flesh quality of large yellow croaker (Larimichthys croceus) cultured with three different modes. J. Ocean Univ. China, 16(6): 1 187-1 194.
DOI:10.1007/s11802-017-3338-0 |
Liu M, De Mitcheson Y S. 2008. Profile of a fishery collapse: why mariculture failed to save the large yellow croaker. Fish Fish., 9(3): 219-242.
DOI:10.1111/j.1467-2979.2008.00278.x |
Ma R, Liu X H, Meng Y Q, Wu J H, Zhang L, Han B Y, Qian K K, Luo Z Y, Wei Y J, Li C Z. 2019. Protein nutrition on sub-adult triploid rainbow trout (1): dietary requirement and effect on anti-oxidative capacity, protein digestion and absorption. Aquaculture, 507: 428-434.
DOI:10.1016/j.aquaculture.2019.03.069 |
McCabe C, Rolls E T. 2007. Umami: a delicious flavor formed by convergence of taste and olfactory pathways in the human brain. Eur. J. Neurosci., 25(6): 1 855-1 864.
DOI:10.1111/j.1460-9568.2007.05445.x |
McLaren K. 1976. XIII—The development of the CIE 1976 (L* a* b*) uniform colour space and colour-difference formula. Color. Technol., 92(9): 338-341.
|
Mørkøre T, Hansen A Å, Unander E, Einen O. 2002. Composition, liquid leakage, and mechanical properties of farmed rainbow trout: variation between fillet sections and the impact of ice and frozen storage. J. Food Sci., 67(5): 1 933-1 938.
DOI:10.1111/j.1365-2621.2002.tb08749.x |
Mørkøre T, Rødbotten M, Vogt G, Fjæra S O, Kristiansen I Ø, Manseth E. 2010. Relevance of season and nucleotide catabolism on changes in fillet quality during chilled storage of raw Atlantic salmon (Salmo salar L.). Food Chem., 119(4): 1 417-1 425.
DOI:10.1016/j.foodchem.2009.09.022 |
Mu H, Wei Z H, Yi L N, Liang H O, Zhao L M, Zhang W B, Mai K S. 2017. Dietary fishmeal levels affect the volatile compounds in cooked muscle of farmed large yellow croaker Larimichthys crocea. Aquacult. Res., 48(12): 5 821-5 834.
DOI:10.1111/are.13405 |
O'Neill B, Le Roux A, Hoffman L C. 2015. Comparative study of the nutritional composition of wild versus farmed yellowtail (Seriola lalandi). Aquaculture, 448: 169-175.
DOI:10.1016/j.aquaculture.2015.05.034 |
Prost C, Serot T, Demaimay M. 1998. Identification of the most potent odorants in wild and farmed cooked turbot (Scophtalamus maximus L.). J. Agric. Food Chem., 46(8): 3 214-3 219.
DOI:10.1021/jf980128o |
Raymond J A. 1994. Seasonal variations of trimethylamine oxide and urea in the blood of a cold-adapted marine teleost, the rainbow smelt. Fish Physiol. Biochem., 13(1): 13-22.
DOI:10.1007/BF00004115 |
Ryder J M. 1985. Determination of adenosine triphosphate and its breakdown products in fish muscle by highperformance liquid chromatography. J. Agric. Food Chem., 33(4): 678-680.
DOI:10.1021/jf00064a027 |
Sarma D, Akhtar M S, Das P, Das P, Shahi N, Ciji A, Mahanta P C, Yengkokpam S, Debnath D. 2013. Nutritional quality in terms of amino acid and fatty acid of five coldwater fish species: implications to human health. Natl. Acad. Sci. Lett., 36(4): 385-391.
DOI:10.1007/s40009-013-0151-1 |
Sigholt T, Erikson U, Rustad T, Johansen S, Nordtvedt T S, Seland A. 1997. Handling stress and storage temperature affect meat quality of farmed-raised Atlantic salmon (Salmo salar). J. Food Sci., 62(4): 898-905.
DOI:10.1111/j.1365-2621.1997.tb15482.x |
Šimat V, Bogdanović T, Poljak V, Petričević S. 2015. Changes in fatty acid composition, atherogenic and thrombogenic health lipid indices and lipid stability of bogue (Boops boops Linnaeus, 1758) during storage on ice: effect of fish farming activities. J. Food Compos. Anal., 40: 120-125.
DOI:10.1016/j.jfca.2014.12.026 |
Torstensen B E, Bell J G, Rosenlund G, Henderson R J, Graff I E, Tocher D R, Lie Ø, Sargent J R. 2005. Tailoring of Atlantic salmon (Salmo salar L.) flesh lipid composition and sensory quality by replacing fish oil with a vegetable oil blend. J. Agric. Food Chem., 53(26): 10 166-10 178.
DOI:10.1021/jf051308i |
Ulbricht T L V, Southgate D A T. 1991. Coronary heart disease: seven dietary factors. Lancet, 338(8773): 985-992.
DOI:10.1016/0140-6736(91)91846-M |
Valente L M P, Moutou K A, Conceição L E C, Engrola S, Fernandes J M O, Johnston I A. 2013. What determines growth potential and juvenile quality of farmed fish species? Rev. Aquacult., 5(S1): S168-S193.
|
Veiseth-Kent E, Hildrum K I, Ofstad R, Rørå M B, Lea P, Rødbotten M. 2010. The effect of postmortem processing treatments on quality attributes of raw Atlantic salmon (Salmo salar) measured by sensory and instrumental methods. Food Chem., 121(1): 275-281.
DOI:10.1016/j.foodchem.2009.12.009 |
Vidal N P, Manzanos M J, Goicoechea E, Guillén M D. 2012. Quality of farmed and wild sea bass lipids studied by 1H NMR: usefulness of this technique for differentiation on a qualitative and a quantitative basis. Food Chem., 135(3): 1 583-1 591.
DOI:10.1016/j.foodchem.2012.06.002 |
Wei Z H, Ma J, Pan X Y, Mu H, Li J, Shentu J, Zhang W B, Mai K S. 2016. Dietary hydroxyproline improves the growth and muscle quality of large yellow croaker Larimichthys crocea. Aquaculture, 464: 497-504.
DOI:10.1016/j.aquaculture.2016.07.015 |
Wei Z H, Zhou H H, Zhang Y J, Zhang Q, Zhang W B, Mai K S. 2018. Integrative analysis of transcriptomics and metabolomics profiling on flesh quality of large yellow croakerLarimichthyscroceafed a diet with hydroxyproline supplementation. Br. J. Nutr., 119(4): 359-367.
DOI:10.1017/S0007114517003968 |
Wekell J C, Barnett H. 1991. New method for analysis of trimethylamine oxide using ferrous sulfate and EDTA. J. Food Sci., 56(1): 132-135.
DOI:10.1111/j.1365-2621.1991.tb07993.x |
Yi X W, Xu W, Zhou H H, Zhang Y J, Luo Y W, Zhang W B, Mai K S. 2014. Effects of dietary astaxanthin and xanthophylls on the growth and skin pigmentation of large yellow croaker Larimichthys croceus. Aquaculture, 433: 377-383.
DOI:10.1016/j.aquaculture.2014.06.038 |
Zhang K K, Ai Q H, Mai K S, Xu W, Liufu Z G, Zhang Y J, Peng M. 2013. Effects of dietary hydroxyproline on growth performance, body composition, hydroxyproline and collagen concentrations in tissues in relation to prolyl 4-hydroxylase α(I) gene expression of juvenile turbot, Scophthalmus maximus L. fed high plant protein diets. Aquaculture, 404-405: 77-84.
DOI:10.1016/j.aquaculture.2013.04.025 |