 2020, Vol. 38
Institute of Oceanology, Chinese Academy of Sciences
Article Information
- XIONG Ying, LI Wei, YUAN Jing, ZHANG Tanglin, LI Zhongjie, XIAO Wuhan, LIU Jiashou
- Genetic structure and demographic histories of two sympatric Culter species in eastern China
- Journal of Oceanology and Limnology, 38(2): 408-426
- http://dx.doi.org/10.1007/s00343-019-9036-6
Article History
- Received Feb. 23, 2019
- accepted in principle May. 16, 2019
- accepted for publication Jul. 2, 2019


2 University of Chinese Academy of Sciences, Beijing 100049, China
The distribution of fish is strictly constrained by the drainage basin because of geographic isolation. In association with the development of river systems and climatic fluctuations, freshwater fish may undergo vicariance, resulting in genetic diversification and even allopatric speciation (Mayr, 1942; Rundle and Nosil, 2005; Tedesco et al., 2012; Yu et al., 2014). Freshwater fish are more susceptive to the physicochemical environment than marine fish, so their distribution patterns are thought to be more related to climate change (Comte et al., 2013). Phylogeography has provided new insights to evaluate the influence of historical events on the genetic structure and composition of modern populations, which has revolutionized population genetics and historical ecology (Avise et al., 1987). Moreover, the phylogenetic study of widespread freshwater fish is an excellent indicator for geographic events.
Gene flow among freshwater fish populations within the same catchment is common, but dispersal among different catchments and drainage basins is typically restricted because of the lack of hydrological connectivity (Mesquita et al., 2005; Huey et al., 2008). However, freshwater fish often inhabit multiple isolated drainage basins, implying dispersal among drainages has been possible in the past (Huey et al., 2011). In China, the colonization of drainages by freshwater fish can be explained by a variety of mechanisms. These include catchment rearrangements through erosion and uplift, climatic-induced fluctuations in sea level (Li, 1981), and anthropogenic translocation (Xiong et al., 2015).
The glacial periods of the Quaternary were a major factor in shaping contemporary distributions of extant flora and fauna (Provan and Bennett, 2008). Fossil and pollen record evidence also suggests that most of the biota, particularly temperate species, survive glacial maxima in lower latitude refugia (Bennett et al., 1991). Many studies have indicated that Quaternary glacial climatic oscillations are too close to explain lots of deep genetic divergences observed nowadays (Huang, 1982; Miralles and Carranza, 2010; Yu et al., 2014). Glacial impacts were greatest in Eurasia, North America, and Antarctica, where glacial ice covered major portions of their surfaces (Hewitt, 2003). China was also affected by the glacial cycle during the Quaternary Period. In the cold periods, mainland China was mainly influenced by alpine glaciers and cold air. During the warm periods, the mainland climate was dominated by warm humid air masses, which led to the retreat of alpine glaciers (Yu et al., 2014).
Cyprinids are the largest extant family of vertebrates and the most diverse freshwater fish family in Asia. The genus Culter consists of nine species and subspecies that are confined to Asia, particularly China, Vietnam, Korea, Mongolia, and Russia (Chen, 1998). Several studies have investigated phylogenetic and biogeography of these Culter species (Wang et al., 2008; Qi et al., 2013, 2015; Yang et al., 2016), however, the sample sizes were small and geographic distances were limited. Therefore, a much larger and more intensive survey is needed to determine the genetic structure of Culter populations. The topmouth Culter (Culter alburnus) and Mongolian redfin (C. mongolicus) are the largest carnivorous fish of the Culter genus (Chen, 1998). They are commercially important freshwater fish that widely coexist in larger rivers, lakes, and reservoirs of China. Their recent use for commercial aquaculture in some provinces of China has seen rapid development (Fan et al., 2008), but wild populations of both species have declined so quickly that conservation of their genetic diversity has become a very important issue.
Our current understanding suggests that extant Culter species originated from the Pliocene epoch in the River Plain of Eastern China (RPEC) according to fossil records (Liu and Su, 1962; Wang, 2013). The Bohai basin is a third-order reservoir constrained by the Miaodao Uplift that was formed by subsidence during the Cenozoic Era (Allen et al., 1997; Hu et al., 2001; He and Wang, 2003). It experienced a threestage evolution from the early Pliocene (3.7 million years ago, Ma) to a marine system in the late Pleistocene (0.13 Ma) (Yi et al., 2016). Fish spread from the RPEC along the Liaohe River and Nenjiang River to Heilong River Basin (LRB) during the Pleistocene. Analysis of the natural distribution of extant fish species in the Zhujiang (Pearl) River Basin (ZRB) suggested that the southward diffusion of East Asian taxa might be caused by the uplift of the Yunnan plateau in the late Pliocene. Hainan Island originally belonged to the ZRB, and was still connected to the South China mainland until the early Quaternary Holocene (10 000 years ago) (Wang et al., 2012). Today, Culter species are widely distributed in Eastern China, especially in the Changjiang River Basin (CRB), Huaihe River Basin (HRB), LRB, and ZRB. We hypothesize that Culter species were subject to drainage basin isolation, so applied the isolation by distance (IBD) model in our present study. Under the population genetics background, this is the process of generating genetic structures through geographically restricted gene flow because random genetic drift is occurring locally (Hardy and Vekemans, 1999).
Here, we employed the mitochondrial DNA control region (CR) to test hypotheses on the drivers of biogeographic process in two sympatric species, C. alburnus and C. mongolicus. Large-scale sampling allowed us to test hypotheses on the evolutionary history and population demographics of these species to determine if Pliocene and Quaternary climatic fluctuations resulted in their genetic diversity in China. We also evaluated the genetic diversity, population genetic structure, and population demographic history of C. alburnus and C. mongolicus and determined whether IBD played a role in shaping the structure of C. alburnus and C. mongolicus. Finally, we assessed the level of genetic diversity across all current populations and proposed suitable conservation plans.
2 MATERIAL AND METHOD 2.1 Samples collectionA total of 333 wild C. alburnus specimens and 225 wild C. mongolicus specimens were collected using three layer gill net from 12 lakes and reservoirs in China between November 2015 and March 2017. Sample information is provided in Table 1 and sampling sites are mapped in Fig. 1. Caudal fin tissue samples used for genomic DNA extraction were preserved at 4℃ and in 100% ethanol and deposited in the Institute of Hydrobiology, Chinese Academy of Sciences.

|
| Fig.1 Map of sampling localities for Culter alburnus and Culter mongolicus populations Green circles represent Zhujiang River Basin (ZRB), yellow circles represent Changjiang River Basin (CRB), the orange circle represents Huaihe River Basin (HRB), and red circles represent Heilong River Basin (LRB). Please also refer to Table 1. Map drawing No. GS(2016)1609(accessed from http://bzdt.ch.mnr.gov.cn/). |
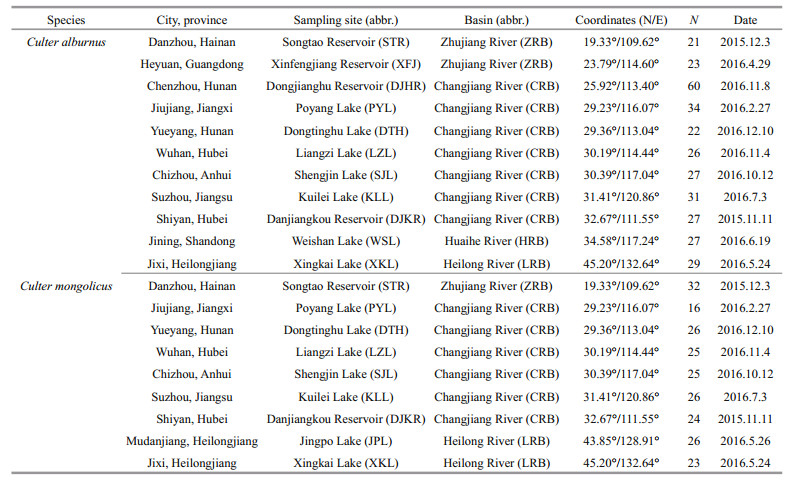
The Holocene is the latest phase of the geological era when the biological composition was almost identical to that of the modern era (Yan, 2006). In this study, the Songtao Reservoir (STR) on Hainan Island was classed as the ZRB because Hainan Island once belonged to the ZRB, and separated from the South China mainland during the late Quaternary (Zeng and Zeng, 1989).
2.2 DNA extraction, PCR amplification and sequencingTotal genomic DNA was extracted from topmouth Culter and Mongolian redfin tissue using phenolchloroform extraction (Russell and Sambrook, 2001). The mitochondrial CR was amplified using the universal primers MitD1-F: 5'-CACCCYTRRCTCCCAAAGCYA-3', and MitD1-R: 5'-GGTGCGGRKACTTGCATGTRTAA-3' (Huang et al., 2007; Cheng et al., 2011). Each final reaction volume of 40 μL contained 26.4 μL of sterilized ultrapure water, 4 μL 10× Ex-taq buffer, 4 μL of Mg2+ (25 mmol/L), 1.6 μL of dNTP-Mix (2.5 mmol/L), 0.4 μL Extaq (5 U/μL), 0.8 μL of each primer (10 mmol/L), and 2 μL of DNA template (approximately 100 ng/μL). PCR amplifications were performed using a T100 Thermal Cycler with a 5 min at 94℃, followed by 5 cycles at 94℃ for 30 s, 58℃ for 30 s, and at 72℃ for 1 min, then 35 cycles at 94℃ for 30 s, 60℃ for 30 s, 72℃ for 1 min, with a final elongation step at 72℃ for 7 min. Amplified PCR products were purified by 1.0% low-melting agarose gel electrophoresis and sequenced in both directions using primers F-SEQ-0510: 5'-TGCATTTGGCTTCTATCTCAGG-3' and R-SEQ-0510: 5'-CCTACTTAAACTCAAGCAAGG-3' and the ABI PRISM® 3730 DNA Analyzer (Applied Biosystems, Life Technologies, Shanghai, China) by the Tsing Ke Commercial Sequencing Service (Wuhan, China).
2.3 Phylogenetic analysisThe generated sequences were aligned against previously published sequences for the same genetic region, and trimmed to the same length using the software package MEGA 7.0 (Kumar et al., 2016).
Phylogenetic relationships based on CR haplotypes were estimated using Bayesian Inference (BI) and Maximum Likelihood (ML) methods. BI analysis was performed using MrBayes 3.2.6 (Ronquist et al., 2012). The best-fit nucleotide substitution models for C. alburnus and C. mongolicus were TrN+G and HKY+I+G, respectively, which was based on the Bayesian Information Criterion in jModelTest 2.1.7 (Darriba et al., 2012). Four simultaneous Markov chain Monte Carlo (MCMC) methods were run for 20 million generations sampling once every 1 000 generations, two independent parallel analyses methods were used. The average standard deviation of split frequencies was less than 0.01 and the potential scale reduction factor value was close to 1. The first 20 000 sampled trees were discarded as burn-in and 50% majority-rule consensus trees was calculated from remaining trees with posterior probability values for each node. Support for clades is expressed as posterior probabilities.
The MLs for phylogenetic analysis were reconstructed in PhyML 3.0 (Guindon and Gascuel, 2003) with 1 000 bootstrap replicates. The most suitable model of DNA substitution, TrN+I+G for C. alburnus and HKY+I+G for C. mongolicus, was determined by ModelTest 3.7 (Posada and Crandall, 1998). Grass carp (Ctenopharyngodon idellus) (GenBank: KJ614563.1) and Hemiculte leucisculus (GenBank: AF494361.1) were set as outgroups.
We constructed haplotype networks using Medianjoining network analysis by Network 4.6 (Bandelt et al., 1999) to visualize relationships among all haplotypes.
2.4 Divergence time estimatesWe employed the relaxed molecular clock method incorporated in BEAST 1.8.4 to estimate the divergence time of each lineage (Drummond and Rambaut, 2007). Calibration information was according to C. mongolicus-like fossil records detected in the Pliocene (Liu and Su, 1962; Chen, 1998). The means values (4±1.9 Ma) of the normal distributions were used in the analysis. The Yule process was used as the tree topology prior, and the TrN and HKY substitution models were employed for C. alburnus and C. mongolicus, respectively. Posterior distributions of node ages were performed by MCMC for 20 million generations with sampling every 1 000 trees, and the first 10% was treated as burn-in. The effective sample size was used to determine the Bayesian statistical significance of each parameter in Tracer 1.6 (Rambaut and Drummond, 2013). Summarized and annotated phylogenetic trees with a molecular clock constraint yielded by BEAST were displayed by FigTree 1.4.3 (Rambaut, 2009).
2.5 Genetic diversity and population structureGenetic diversity is reflected in the measures of the number of haplotypes (n), haplotype diversity (π) and nucleotide diversity (h) (Nei, 1987), using DnaSP 5.10 (Librado and Rozas, 2009) software calculate values of each population. The mean genetic distance within and between populations were calculated according to the Kimura 2-parameter (K2P) model (Kimura, 1980) as implemented in MEGA7, standard errors were estimated by bootstrapping using 10 000 replicates. Pairwise genetic differentiation between populations was estimated using F-statistics (FST) (Weir and Cockerham, 1984) with 10 000 permutations, based on the distance method in Arlequin 3.5 (Excoffier and Lischer, 2010). To investigate significant genetic structure between populations, we performed a two-level hierarchical analysis of molecular variance (AMOVA) using Arlequin. Significance was assessed by 10 000 random permutations. Gene flow (Nm) was evaluated from GammaST (Nei, 1982), and FST (Hudson et al., 1992) was evaluated using DnaSP 5.10.
Mantel tests were used to test the relationships between pairwise values of FST and the geographical distance. Geographic distances among populations were estimated using Google Earth 7.3.0.
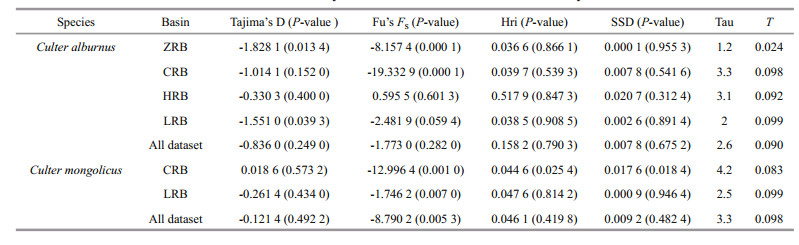
2.6 Demographic historyThe population demography for topmouth culter and Mongolian redfin populations were examined using three approaches. First, Tajima's D (Tajima, 1989) and Fu's Fs (Fu, 1997) were applied to check the evidence of neutral evolution in Arlequin 3.5 (Excoffier and Lischer, 2010). In the neutrality test, we assessed significance by generating null distributions from 10 000 coalescent simulations.
Second, the demographic history was investigated by comparing mismatch distributions in each basin population sample using DnaSP 5.10 and Arlequin3.5. The time of possible population expansions (t) was estimated via equation τ=2ut (Nei and Tajima, 1981; Rogers and Harpending, 1992), where u is the mutation rate for each sequence and each generation. The value of u was calculated by u=2μk, where μ is the mutation rate per nucleotide and k is the number of nucleotides in the analyzed fragment. The approximate time of expansion was calculated by multiplying t by the generation time (C. alburnus: 3 years for CRB, HRB, and ZRB, 4 years for LRB, and 3.5 years for the overall population; C.mongolicus: 2 years for CRB, 4 years for LRB, and 3 years for the overall population) (Fish Research Laboratory, Hubei Institute of Hydrobiology, 1976; Xu et al., 2009; Yang, 2009). The substitution rate of 3% per million years for freshwater fish species was generally applied in the CR (Donaldson and Wilson, 1999). The goodness-of-fit of the actual distributions were calculated by Harpending's raggedness index (Hri) (Harpending, 1994) with the expected distributions using a model of population expansion, and the sum of squared deviations (SSD) by assessing significance with 1 000 permutations.
Third, Bayesian skyline plots (BSPs) (Drummond et al., 2005) were generated using BEAST 1.8.4 for CR with 20 million generations to explore demographic histories. This analysis was performed using the TrN substitution model for C. alburnus and the HKY substitution model for C. mongolicus, and no partition into codon positions. The coalescent tree prior was specified as the BSP. The uncorrelated lognormal relaxed-clock model, with means value (4±1.9 Ma) of the normal distributions was used. The remaining settings were as default.
3 RESULT 3.1 Sequence informationThe mitochondrial CR successfully amplified 327 C. alburnus from 11 populations and 223 C.mongolicus from 9 populations. C. alburnus sequences (GenBank Accession Nos. MG584736–MG584792) and C. mongolicus sequences (GenBank Accession Nos. MG584793–MG584829) were deposited in GenBank (Table S1). For C. alburnus, the aligned sequences (842 bp) contained 58 variable sites, of which 47 were parsimony-informative. For C. mongolicus, the aligned sequences (932 bp) contained 51 variable sites, of which 49 were parsimony-informative. No insertions or deletions were detected in CR.
3.2 Culter alburnus phylogenetic analysis and divergence time estimateBased on C. alburnus CR haplotypes, BI and ML methods yielded similar tree topologies and consistently supported two lineages (Fig. 2a, only BI tree shown). Lineage I, the sister group of Lineage II, consisted of specimens from the ZRB. Lineage II included samples from the CRB, HRB, and LRB. The median-joining network analysis revealed a "weblike" topology pattern, whereas there were significant differences between the ZRB nodes versus the other three basin nodes (Fig. 3a).

|
| Fig.2 Bayesian inference analysis tree for Culter alburnus (a) and Culter mongolicus (b) based on CR haplotype Values on branches indicate bootstrap proportions from a maximum likelihood analysis and Bayesian posterior probabilities. Bootstrap values >50% are reported. ZRB represents Zhujiang River Basin populations, CRB represents Changjiang River Basin populations, HRB represents Huaihe River Basin populations, and LRB represents Heilong River Basin populations. |

|
| Fig.3 Median-joining network of haplotypes of Culter alburnus (a) and Culter mongolicus (b) Each circle represents a haplotype; the diameter is proportional to the frequency. Each color shows a different basin population. |
We conducted divergence time estimation among different haplotypes of C. alburnus using an uncorrelated lognormal relaxed-clock model. Based on the 95% credibility intervals (95% CI) of the posterior distribution (Fig. 4a), C. alburnus diverged from outgroups such as C. idellus in the Pliocene 5.25 Ma (95% CI: 4.18–6.79). The lineage I group diverged at the same series 2.74 Ma (95% CI: 1.96–3.48), and the other three basins appeared to share an obscure common ancestor and all diverged in the Pleistocene.

|
| Fig.4 Divergence time tree for Culter alburnus (a) and Culter mongolicus (b) Branch lengths are proportional to divergence time. Bars on the nodes are 95% credibility intervals. Ctenopharyngodon idellus and Hemiculte leucisculus were set as outgroups. |
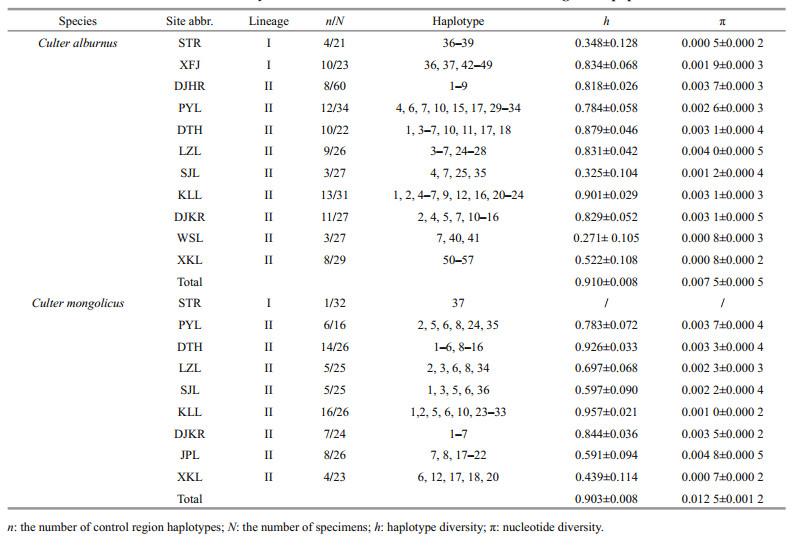
For C. alburnus, the number of haplotypes (n), haplotype diversity (h), and nucleotide diversity (π) for each population are presented in Table 2. The overall CR h (0.913±0.008) and π (0.008 0±0.005 1) were high. A total of 57 haplotypes were detected from all sequences. The highest haplotype and nucleotide diversities were discovered in the Kuilei Lake (KLL) and Liangzi Lake (LZL) populations, whereas the lowest were discovered in the Weishan Lake (WSL) and STR. The haplotypes displayed restricted basin geographical distributions, with 98.2% of the haplotypes being unique for a single basin. Haplotype 7 (GenBank Accession No. MG584742) was the most common (shared by 64 individuals) and widespread, being shared among all CRB and HRB populations.
|
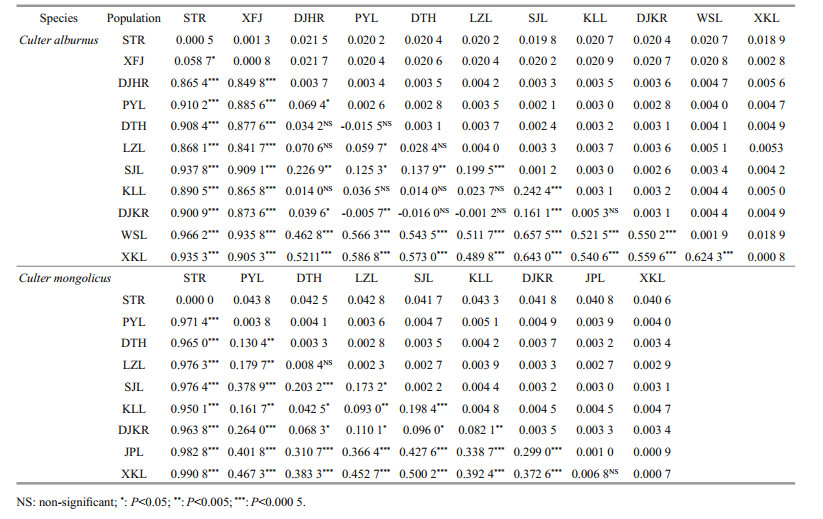
Based on the K2P model, the mean genetic divergence within and between each populations are presented in Table 3. The overall average genetic divergence among individuals was 0.007 6 for C. alburnus. Among the 11 populations, the overall mean intrapopulation genetic distance of the LZL population (0.004 0) was largest and Xingkai Lake (XKL) (0.000 8) population was smallest. Genetic distances among CRB and HRB populations (0.002 1–0.005 6) were very small, but genetic distances between ZRB and other basin populations (0.020 2–0.021 7) were higher.
|
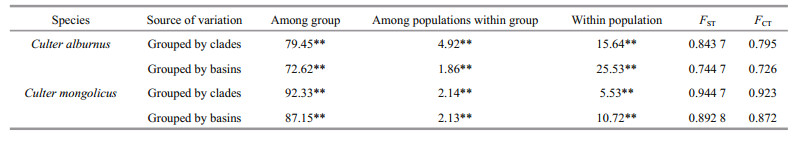
For population structure analysis, all samples were grouped by clades and basins. An AMOVA revealed that most of the variation (79.45%, P < 0.000 1) occurred among clades (Table 4), whereas the variance among populations within groups (4.92%, P < 0.000 1) and within populations (15.64%) was relatively small (FST=0.843 7, P < 0.000 1), indicating a high level of clade structure. Pairwise comparisons of genetic differentiation (FST) values varied from -0.015 5 to 0.937 8. All pairwise FST comparisons between basin populations were statistically significant. For CRB, significant genetic differences were observed between Shengjin Lake (SJL) and other CRB populations. The values of Nm calculated from GammaSt (from 0.15 to 3.53) and FST (from 0.07 to 0.45) indicated a limited gene flow level among the four C. alburnus basin populations, especially between the ZRB and the other three basin populations, which was in accordance with their significant FST values (Table S2).
|
There was a significant positive relationship between population genetic differentiation and geographic distance (Mantel tests, R=0.502 6, P=0.023 6 < 0.05) (Fig. 5a).

|
| Fig.5 Correlation between genetic differences (FST) and geographic distances (km) of Culter alburnus (a) and Culter mongolicus (b) P and R represent probability estimates and the correlation coefficient, respectively. |
For C. alburnus, neutrality tests were negative except for the HRB, and Fu's FS test values were statistically significant for ZRB, CRB, and LRB populations (P < 0.05) (Table 5). Mismatch analysis revealed an approximately unimodal distribution of the overall population and ZRB, CRB, and LRB populations (Fig. 6 left - a, b, c, e), but the shape of the mismatch distribution of HRB was approximately bimodal (Fig. 6 left - d). Nevertheless, the model of sudden demographic expansion for the overall population was not rejected by the SSD and Hri values (Table 5). The total population of τ was calculated as between 1.2 and 3.3 by Arlequin using the evolutionary rate calibrated in this study (3% per Ma), and the expansion time for each basin and overall was estimated to be between 0.035 and 0.098 Ma (Table 5). Additionally, BSP suggested that remarkable expansion occurred in the overall population and CRB and LRB populations (Fig. 6 right-a, c, e), and that moderate expansion occurred in the ZRB population (Fig. 6 right - b), but that the effective population size was relatively stable for the HRB population (Fig. 6 right - d).

|
| Fig.6 Mismatch distribution (left) and Bayesian skyline plot (BSP) analysis (right) a. all Culter alburnus samples; b. Zhujiang River Basin populations of Culter alburnus; c. Changjiang River Basin populations of Culter alburnus; d. Huaihe River Basin populations of Culter alburnus; e. Heilong River Basin populations of Culter alburnus; f. all Culter mongolicus samples; g. Changjiang River Basin populations of Culter mongolicus; h. Heilong River Basin populations of Culter mongolicus. Left panels are results of mismatch distributions. The abscissa indicates the number of pairwise differences between compared sequences. The ordinate is the frequency for each value. The blue line is the observed frequency of pairwise divergences among sequences and the red line refers to the expectation under the model of population expansion. Right panels are the results of BSP. The abscissa shows the time in millennia of years ago (Ma). The ordinate shows the estimated effective population size. Estimates of means are joined by a solid line while the shaded range delineates the 95% HPD limits. |
Based on C. mongolicus CR haplotypes, the BI and ML methods yielded similar topologies and consistently supported two lineages (Fig. 2b, only the BI tree is shown). Lineage I, the sister group of Lineage II, consisted of specimens from the ZRB. Lineage II included samples from CRB and LRB. The median-joining network analysis revealed a "web like" topology pattern, and some C. mongolicus individuals from CRB and LRB population haplotypes shared the same node (Fig. 3b). Specifically, haplotypes 6, 7, 8, and 12 are shared by CRB and LRB populations, whereas significant differences between the ZRB nodes versus the other two basin nodes are seen.
Based on the 95% CI of the posterior distribution (Fig. 4b), C. mongolicus diverged from outgroups in the Pliocene 5.28 Ma (95% CI: 4.61–6.79 Ma), and lineage I group diverged at the same time; the lineage II basin appeared to share a common ancestor 3.60 Ma (95% CI: 2.84–4.43 Ma).
3.6 Culter mongolicus genetic diversity and population structureFor C. mongolicus, the values of n, h, π for each population are presented in Table 2. The overall CR h (0.903±0.008) and π (0.012 5±0.001 2) were high. Thirty-seven haplotypes were detected among all sites. The highest haplotype and nucleotide diversities were discovered in the KLL population. The haplotype displayed restricted basin geographical distribution, with 89.2% of the haplotypes being unique for a single basin, whereas there was only one haplotype (37, GenBank accession No. MG584829) for the ZRB (STR population).
The mean genetic divergence within and between each of the populations are shown in Table 3, and the overall average genetic divergence among individuals was 0.012 9 for C. mongolicus. Among the 9 populations, the overall mean intrapopulation genetic distance of the KLL population (0.004 8) was largest and the STR (0) population was smallest. The genetic distances among CRB and HRB populations (0.000 9–0.005 1) were very small, but those between the ZRB and other basin populations (0.040 6–0.043 8) were higher.
For population structure analysis, all samples were grouped by clades and basins. An AMOVA revealed that most of the variation (92.33%, P < 0.000 1) occurred among groups (Table 4), whereas the variance within populations (5.53%, P < 0.000 1) and among populations within groups (2.14%, P < 0.000 1) was relatively small (FST=0.9447, P < 0.000 1), indicating a high level of clade structure.
Pairwise comparisons of genetic differentiation (FST) values varied from 0.006 8 to 0.990 8. All pairwise FST comparisons between basin populations were statistically significant. For the CRB, significant genetic differences were observed between CRB populations, with the exception of the DTH and LZL. The values of Nm calculated from GammaSt (from 0.14 to 3.32) and FST (from 0.06 to 1.05) indicated a limited gene flow level among C. mongolicus basin populations, especially between the ZRB and the other two basin populations, which was in accordance with their significant FST values (Table S2).
There was a significant positive relationship between population genetic differentiation and geographic distance (Mantel tests, R=0.592 7, P=0.007 1 < 0.05) (Fig. 5b).
3.7 Culter mongolicus demographic historyFor C. mongolicus, the ZRB population was excluded from demographic analysis because of the unique haplotype. The neutrality test was negative for the overall population and the CRB and LRB. All Fu's FS test values were significantly negative (P < 0.01) (Table 5). The mismatch distribution shape of C. mongolicus was unimodal (Fig. 6 left -f, g, h). Nevertheless, the model of sudden demographic expansion for the overall population and each basin population was not rejected by the SSD and Hri values (Table 5). The total populations of τ were calculated between 2.5 and 4.2 using Arlequin, and the expansion times for each basin and the overall population were estimated to be between 0.083 and 0.099 Ma (Table 5). Similar results were obtained with BSP, suggesting that moderate expansion occurred in the overall population and the CRB and LRB (Fig. 6 right - f, g, h).
4 DISCUSSION 4.1 Population divergence and implication of cryptic subspeciesPhylogenetic analysis based on CR revealed two lineages (I and II), which is highly consistent with the geographical patterns for C. alburnus and C. mongolicus (Fig. 2). The divergence time estimate revealed a deep divergence analogous to phylogenetic analysis. Lineage I was the first to split from Lineage II in the Pliocene and exhibits a high divergence from it; Lineage II diverged during the Pleistocene but at a later point in time. Lineage I and populations from Guangdong Province and Hainan Province were found to show a close relationship, though they are separated by the Qiongzhou Strait. However, this may be because the Qiongzhou Strait was once part of the coastal plain of the China mainland continent during the Pleistocene glaciations (Wang et al., 2012).
There is a deep genetic divergence between ZRB populations and other populations (C. alburnus, 0.020 2–0.021 7; C. mongolicus, 0.040 6–0.043 8; Table 3) based on genetic distance calculations. This level of divergence has previously been attributed to subspecies-level differences (Shaklee et al., 1982). Therefore, we suggest that C. alburnus and C. mongolicus of ZRB populations represent cryptic subspecies. BI tree analysis and web-like statistical haplotype network findings also support this. The significant pairwise genetic differentiation detected between the ZRB populations and other populations is in accordance with that of many Cyprinidae species in China such as Acheilognathus macropterus (Zhu and Liu, 2007), C. idellus (Fu et al., 2015), Hypophthalmichthys molitrix (Ji et al., 2009), and H. leucisculus (Chen et al., 2017). It is conceivable that geographical isolation is a key factor in population differentiation. For example, the ZRB was isolated from the CRB by the Nanling Mountains. Moreover, compare to the geographic distance between the two ZRB populations (XFJ and STR) is 710 km, the distance between the DJHR (CRB) and XFJ (ZRB) is only 260 km, but the two basin populations show completely different haplotypes. Gene flow has also been detected among the basin populations. Additionally, there is evidence of limited gene flow between the ZRB and other basin populations. Second, historical factors have played an important role in determining the patterns of genetic variability. Extant Culter originated from the Pliocene, and the ZRB was also diverged during the late Pliocene period (Wang et al., 2012). Therefore, the ZRB populations were isolated from their point of origin at an early stage of Culter divergence. Divergence time estimations support this hypothesis. Third, we consider that ZRB belong to peripheral area and play a role in genetic differentiation. Moreover, Culter species are a temperate fish (Froese and Pauly, 2017) but the ZRB is a tropical river (Dudgeon, 2000), and peripheral populations tend to occur in more unsuitable environments than central populations (Lesica and Allendorf, 1995).
4.2 Species-level of genetic diversity and structureBased on haplotype and nucleotide diversities, C. alburnus and C. mongolicus both showed high overall genetic diversities as seen in previous findings (Wang et al., 2007; Qi et al., 2013, 2015; Yang et al., 2016). This could reflect the complex and variable heterogenetic habitat of Culter populations, which are widely distributed in China. However, the genetic diversity within populations shows that some populations have high levels of diversity, while others have low levels. All CRB populations typically show higher genetic variability than the other three basin populations for C. alburnus, whereas a similar level of variability was found among the C. mongolicus populations. Genetic patterns and species diversity may have been affected by speciation events and subsequent radiations (Xiao et al., 2009; Yamaguchi et al., 2010). Additionally, differences in the time of species origins have contributed to the general positive correlation with genetic diversity (Messmer et al., 2012). Populations near the center of a species' range are usually contiguous and at a high density, while populations at the margins tend to be isolated and sparse. Thus, peripheral populations are small and isolated, with low genetic variability (Brussard, 1984; Lesica and Allendorf, 1995). We therefore deduced that CRB populations were at or near the core region of their distribution. This result was also supported by the fact that the RPEC was the place of origin of Culter species (Liu and Su, 1962; Chen, 1998; Wang, 2013).
Other notable discoveries include the low genetic diversity of SJL and Dangjiangkou Reservoir (DJKR) population and the significant genetic differentiation between SJL and other CRB populations. This result is mainly caused by geographic isolation. The SJL sluice and DJKR reservoir were constructed between 1950–1970, and were isolated from the main stream of the Changjiang River. Major threats to SJL include artificial reclamation, serious sedimentation accumulation, and habitat degradation (Jiang et al., 2007). The DJKR dam prevents fish from moving through, thereby inducing geographic isolation between the DJKR and the Changjiang River. These factors can affect genetic diversity by decreasing gene flow among the CRB.
The main aim of population genetic studies is to evaluate levels of genetic connectivity among populations. Major factors that shape genetic structure among populations include population size, dispersal potential, environmental conditions, and life history strategies (Gaggiotti et al., 2009). In the present study, AMOVA and pairwise FST values indicated that high levels of population structure and genetic differentiation occurred in different drainage basin populations for C. alburnus and C. mongolicus. The fact that 98.2% and 89.2% of haplotypes were only detected in single C. alburnus and C. mongolicus basin localities, respectively, indicates that limited gene flow occurred among drainage basin populations.
Allopatric speciation has a central role in generating new species by reproductive isolation (April et al., 2013). Freshwater fish populations are usually confined to confined areas during a relatively short to moderate evolutionary period (Dewoody and Avise, 2000; Yamaguchi et al., 2010). During the Pleistocene glacial period, temperate freshwater fish experienced landscape changes s in intermittent connected and isolated waterways and glacial refugia, leading to complex phylogeography and many opportunities to study recent or incomplete speciation (Behnke, 1972; Bernatchez and Wilson, 1998; Taylor, 1999; Ruzzante, 2011; Ruskey and Taylor, 2016). The clear pattern of IBD in C. alburnus and C. mongolicus in the current study supports the hypothesis and was predicted by the drainage basin isolation. Geographic distance could be a reasonable explanation for the observed geographic distribution of genetic variation between populations. The two largest carnivorous Culter species mainly coexist in larger rivers, lakes, and reservoirs in China. Perhaps because of the demand for food resources they rarely inhabit small tributaries, and gene flow among basins may be rare too. Moreover, because C. alburnus and C. mongolicus spawn in flowing water (Fish Research Laboratory, Hubei Institute of Hydrobiology, 1976) and are potamodromous, gene flow among populations within the same drainage basin may be more common.
4.3 Demographic process of CulterClimatic oscillation played an important role in the contemporary diversity of many species and communities. In particular, climate changes between ice age maxima and warm interglacials caused large changes in the distribution of species, which ultimately affect the distribution of genetic variation within species (Hewitt, 2003). During the Pleistocene, five glaciations occurred in Eastern China (Yi et al., 2007). The last interglacial period occurred at approximately 0.1 Ma, while glacial retreat occurred at 0.075 Ma. The last glaciation (LG) in Eastern China started at approximately 0.073 Ma and continued until 0.016 Ma, and the last glacial maximum (LGM) development in Eastern China occurred during the 0.024–0.016 Ma.
On the basis of estimation expansion times from mismatch distribution, most Culter populations (C. alburnus, 0.035–0.098 Ma; C. mongolicus: 0.083– 0.099 Ma) underwent a period of population expansion that began before the LGM in Eastern China. This is related to suitable environments within their areas during interglacial periods (0.1–0.075 Ma). Typical features of this type of expansion pattern are supported by high haplotype diversity but low nucleotide diversity, significantly negative FS values, unimodal distribution of pairwise differences, and expansion BSP analysis (Nei, 1987; Tajima, 1989; Rogers and Harpending, 1992; Fu, 1997; Drummond et al., 2005).
However, BSP and Tajima's analysis suggest that effective population size was relatively low and stable for the HRB C. alburnus population. Two reasons account for this abnormal phenomenon. First, according to divergence time estimations, the HRB was the latest diverged group (1.48 Ma) for C. alburnus. Furthermore, its genetic diversity was lowest in C. alburnus. Since the Pleistocene ice age, the population bottlenecks appear to have impacted the extent of haplotype diversity in many freshwater fish populations (Billington and Hebert, 1991) and were influenced by the small founder effect later (Hoffman and Blouin, 2004). Second, habitats of the HRB (WSL, 34°34'45"N), which were distributed in the southern boundary of the permafrost area in the hilly plain region of Eastern China (near 33°20'N–33°40'N) (Pu, 1991), were unsuitable for C. alburnus during the LG period because they are temperate fish.
4.4 Conservation implicationCulter alburnus and C. mongolicus are economically valuable freshwater fish that are widely distributed in larger rivers, lakes, and reservoirs of China. However, because of their carnivorous nature, they were once considered harmful and were removed from water bodies. Today, some anthropogenic activities such as illegal fishing, random stock enhancement, and habitat degradation (e.g., dam construction and water pollution) are major threats to these species and result in the miniaturization of natural fish resources. Indeed, during the last few decades, the wild populations have declined so rapidly (Liu et al., 2007) that conservation of their genetic diversity has become a very important issue.
Maintaining genetic diversity is a fundamental concern in conservation and evolutionary biology, and is an important part of biodiversity. Populations lacking genetic variability have low adaptability to stress, while populations with high genetic variability can rapidly respond to environmental changes (Ayala, 1965; Nei et al., 1975; Frankham et al., 2002). We propose several recommendations based on the current study. Each basin (ZRB, CRB, HRB, and LRB) should be considered an individual Management Unit based on the significant genetic divergence occurring in different drainage basin populations. Additionally, the CRB population demands priority protection because it has the highest genetic diversity and provides the largest yield of Culter species, thus we should protect the integrity and continuity of their habitats and reduce human disturbance. Special attention should also be paid to SJL and DJKR populations because dam construction and artificial reclamation will lead to geographic separation and impede gene flow among basins. The most important course of action should be to reconnect the lakes with the Changjiang River, this is especially important for the restoration of genetic diversity in smaller lakes, thus we recommend installation fish passage facilities for DJKR and restoration of the connectivity with Changjiang River for SJL. The C. mongolicus population of the ZRB (STR) also requires a great deal of attention because of its genetic uniqueness, which includes exclusive mtDNA CR haplotypes. Long-term monitoring programs should also be established. Finally, to understand genetic patterns and establish effective conservation strategies for the two Culter species, more sensitive nuclear markers and larger samples should be employed in future research.
5 CONCLUSIONThis study assembled a relatively larger scale dataset to infer Culter species phylogeographic patterns in China. The results support the hypothesis that geographic isolation drove divergence between lineages I and II. Based on the molecular clock, Culter species appeared to originate during the early Pliocene. Genetic diversity differences among basin populations are significant for Culter species, and demographic analysis indicated that most populations experienced population expansion during the warm interglacial period. Based on the current study, we propose several suggestions for the protection of genetic diversity: each basin should be considered an individual Management Unit and CRB populations demand priority protection; the C. mongolicus STR population possesses unique genotypes, which calls for a special conservation concern for this species at the population level.
6 DATA AVAILABILITY STATEMENTSequence data that support the findings of this study have been deposited in GenBank under accession numbers from MG584736 to MG584792 for C. alburnus and from MG584793 to MG584829 for C. mongolicus. Details regarding individual samples are available in Table S1.
7 ACKNOWLEDGMENTWe would like to acknowledge colleagues at the Fisheries Ecology Lab for their assistance in field sampling.
Allen M B, Macdonald D I M, Xun Z, Vincent S J, BrouetMenzies C. 1997. Early Cenozoic two-phase extension and late Cenozoic thermal subsidence and inversion of the Bohai Basin, northern China. Marine and Petroleum Geology, 14(7-8): 951-972.
DOI:10.1016/S0264-8172(97)00027-5 |
April J, Hanner R H, Dion-Côté A M, Bernatchez L. 2013. Glacial cycles as an allopatric speciation pump in northeastern American freshwater fishes. Molecular Ecology, 22(2): 409-422.
DOI:10.1111/mec.12116 |
Avise J C, Arnold J, Ball R M, Bermingham E, Lamb T, Neigel J E, Reeb C A, Saunders N C. 1987. Intraspecific phylogeography:The mitochondrial DNA bridge between population genetics and systematics. Annual Review of Ecology and Systematics, 18: 489-522.
DOI:10.1146/annurev.es.18.110187.002421 |
Ayala F J. 1965. Evolution of fitness in experimental populations of Drosophila serrata. Science, 150(3698): 903-905.
DOI:10.1126/science.150.3698.903 |
Bandelt H J, Forster P, Röhl A. 1999. Median-joining networks for inferring intraspecific phylogenies. Molecular Biology and Evolution, 16(1): 37-48.
|
Behnke R J. 1972. The systematics of salmonid fishes of recently glaciated lakes. Journal of the Fisheries Research Board of Canada, 29(6): 639-671.
DOI:10.1139/f72-112 |
Bennett K D, Tzedakis P C, Willis K J. 1991. Quaternary refugia of north European trees. Journal of Biogeography, 18(1): 103-115.
|
Bernatchez L, Wilson C C. 1998. Comparative phylogeography of Nearctic and Palearctic fishes. Molecular Ecology, 7(4): 431-452.
DOI:10.1046/j.1365-294x.1998.00319.x |
Billington N, Hebert P D N. 1991. Mitochondrial DNA diversity in fishes and its implications for introductions. Canadian Journal of Fisheries and Aquatic Sciences, 48(S1): 80-94.
DOI:10.1139/f91-306 |
Brussard P F. 1984. Geographic patterns and environmental gradients:the central-marginal model in drosophila revisited. Annual Review of Ecology and Systematics, 15(1): 25-64.
DOI:10.1146/annurev.es.15.110184.000325 |
Chen W T, Zhong Z X, Dai W, Fan Q, He S P. 2017. Phylogeographic structure, cryptic speciation and demographic history of the sharpbelly (Hemiculte leucisculus), a freshwater habitat generalist from southern China. BMC Evolutionary Biology, 17: 216.
DOI:10.1186/s12862-017-1058-0 |
Chen Y. 1998. Chinese fauna, Osteichthyes, Cypriniformes.Middle Volume. Science Press, Beijing. p.185-197. (in Chinese)
|
Cheng Y Z, Jin X X, Ge S, Wang R X, Xu T J. 2011. Genetic diversity and population structure of miiuy croaker populations in East China Sea revealed by the mitochondrial DNA control region sequence. Biochemical Systematics and Ecology, 39(4-6): 718-724.
DOI:10.1016/j.bse.2011.06.009 |
Comte L, Buisson L, Daufresne M, Grenouillet G. 2013. Climate-induced changes in the distribution of freshwater fish:observed and predicted trends. Freshwater Biology, 58(4): 625-639.
DOI:10.1111/fwb.12081 |
Darriba D, Taboada G L, Doallo R, Posada D. 2012. jModelTest 2:more models, new heuristics and parallel computing. Nature Methods, 9(8): 772.
|
Dewoody J A, J. C. Avise. 2010. Microsatellite variation in marine, freshwater and anadromous fishes compared with other animals. Journal of Fish Biology, 56(3): 461-473.
|
Donaldson K A, Wilson R R Jr. 1999. Amphi-panamic geminates of snook (Percoidei:Centropomidae) provide a calibration of the divergence rate in the mitochondrial DNA control region of fishes. Molecular Phylogenetics and Evolution, 13(1): 208-213.
|
Drummond A J, Rambaut A, Shapiro B, Pybus O G. 2005. Bayesian coalescent inference of past population dynamics from molecular sequences. Molecular Biology and Evolution, 22(5): 1185-1192.
DOI:10.1093/molbev/msi103 |
Drummond A J, Rambaut A. 2007. BEAST:Bayesian evolutionary analysis by sampling trees. BMC Evolutionary Biology, 7: 214.
DOI:10.1186/1471-2148-7-214 |
Dudgeon D. 2000. The ecology of tropical Asian rivers and streams in relation to biodiversity conservation. Annual Review of Ecology and Systematics, 31(1): 239-263.
DOI:10.1146/annurev.ecolsys.31.1.239 |
Excoffier L, Lischer H E L. 2010. Arlequin suite ver 3. 5:a new series of programs to perform population genetics analyses under Linux and Windows. Molecular Ecology Resources, 10(3): 564-567.
|
Fan Q X, Peng C, Liu W K. 2008. Effects of starvation and refeeding on activities of digestive enzymes in Culter alburnus Basilewsky juveniles. Journal of Fishery Sciences of China, 15(3): 439-445.
(in Chinese with English abstract) |
Fish Research Laboratory, Hubei Institute of Hydrobiology. 1976. Fishes in the Yangtze River. Science Press, Beijing, China. p.119-122. (in Chinese)
|
Frankham R, Ballou J D, Briscoe D A. 2002. Introduction to Conservation Genetics. Cambridge University Press, Cambridge. 23p.
|
Froese R, Pauly D. 2017-9-20. FishBase. https://www.fishbase.de
|
Fu J J, Wang R Q, Shen Y B, Xuan Y F, Xu X Y, Liu C C, Li J L. 2015. Genetic variation analysis based on D-loop sequences of wild populations of grass carp(Ctenopharyngodon idella) in China. Acta Hydrobiologica Sinica, 39(2): 349-357.
(in Chinese with English abstract) |
Fu Y X. 1997. Statistical tests of neutrality of mutations against population growth, hitchhiking and background selection. Genetics, 147(2): 915-925.
|
Gaggiotti O E, Bekkevold D, Jørgensen H B H, Foll M, Carvalho G R, Andre C, Ruzzante D E. 2009. Disentangling the effects of evolutionary, demographic, and environmental factors influencing genetic structure of natural populations:Atlantic herring as a case study. Evolution, 63(11): 2939-2951.
DOI:10.1111/j.1558-5646.2009.00779.x |
Guindon S, Gascuel O. 2003. A simple, fast, and accurate algorithm to estimate large phylogenies by maximum likelihood. Systematic Biology, 52(5): 696-704.
DOI:10.1080/10635150390235520 |
Hardy O J, Vekemans X. 1999. Isolation by distance in a continuous population:reconciliation between spatial autocorrelation analysis and population genetics models. Heredity, 83(2): 145-154.
DOI:10.1046/j.1365-2540.1999.00558.x |
Harpending H C. 1994. Signature of ancient population growth in a low-resolution mitochondrial DNA mismatch distribution. Human Biology, 66(4): 591-600.
|
He L J, Wang J Y. 2003. Cenozoic thermal history of the Bohai Bay Basin:constraints from heat flow and coupled basinmountain modeling. Physics and Chemistry of the Earth, Parts A/B/C, 28(9-11): 421-429.
DOI:10.1016/S1474-7065(03)00062-7 |
Hewitt G M. 2003. Ice ages: their impact on species distributions and evolution. In: Rothschild L J, Lister A M eds. Evolution of Planet Earth. Academic Press, New York.
|
Hoffman E A, Blouin M S. 2004. Historical data refute recent range contraction as cause of low genetic diversity in isolated frog populations. Molecular Ecology, 13(2): 271-276.
DOI:10.1046/j.1365-294X.2003.02057.x |
Hu S, O'Sullivan P B, Raza A, Kohn B P. 2001. Thermal history and tectonic subsidence of the Bohai Basin, northern China:a Cenozoic rifted and local pull-apart basin. Physics of the Earth and Planetary Interiors, 126(3-4): 221-235.
DOI:10.1016/S0031-9201(01)00257-6 |
Huang P. 1982. Quaternary climatic changes in China and problem Lushan Glaciation remnants. Journal of Glaciology and Cryopedology, 4(3): 1-14.
(in Chinese with English abstract) |
Huang Z, Xu X, Tang J, Zhang J, He J. 2007. Fish mitochondrial DNA control region amplification primer and its design method and application. China. (in Chinese)
|
Hudson R R, Slatkin M, Maddison W P. 1992. Estimation of levels of gene flow from DNA sequence data. Genetics, 132(2): 583-589.
|
Huey J A, Baker A M, Hughes J M. 2008. The effect of landscape processes upon gene flow and genetic diversity in an Australian freshwater fish, Neosilurus hyrtlii. Freshwater Biology, 53(7): 1393-1408.
DOI:10.1111/j.1365-2427.2008.01971.x |
Huey J A, Baker A M, Hughes J M. 2011. Evidence for multiple historical colonizations of an endoreic drainage basin by an Australian freshwater fish. Journal of Fish Biology, 79(4): 1047-1067.
DOI:10.1111/j.1095-8649.2011.03088.x |
Ji C H, Gu J J, Mao R X, Zhu X P, Sun Y W. 2009. Analysis of genetic diversity among wild silver carp(Hypophthalmichthys molitrix) populations in the Yangtze, Heilongjiang and Pearl Rivers using microsatellite markers. Journal of Fisheries of China, 33(3): 364-371.
(in Chinese with English abstract) |
Jiang H X, Xu W B, Qian F W, Chu G Z. 2007. Impact of habitat evolvement and human disturbance on wintering water birds in Shengjin Lake of Anhui Province, China. Chinese Journal of Applied Ecology, 18(8): 1 832-1 836.
(in Chinese with English abstract) |
Kimura M. 1980. A simple method for estimating evolutionary rates of base substitutions through comparative studies of nucleotide sequences. Journal of Molecular Evolution, 16(2): 111-120.
|
Kumar S, Stecher G, Tamura K. 2016. MEGA7:Molecular evolutionary genetics analysis version 7. 0 for bigger datasets. Molecular Biology and Evolution, 33(7): 1 870-1 874.
DOI:10.1093/molbev/msw054 |
Lesica P, Allendorf F W. 1995. When are peripheral populations valuable for conservation?. Conservation Biology, 9(4): 753-760.
DOI:10.1046/j.1523-1739.1995.09040753.x |
Li S. 1981. Study on Zoogeographic Divisions for Fresh Water Fishes of China. Science Press, Beijing, China. p.44-146.(in Chinese with English abstract)
|
Librado P, Rozas J. 2009. DnaSP V5:A software for comprehensive analysis of DNA polymorphism data. Bioinformatics, 25(11): 1 451-1 452.
DOI:10.1093/bioinformatics/btp187 |
Liu E S, Wu K K, Cao P, Ding S Q, Yang Q C. 2007. Population dynamics and ecological responses of fishes in Culter in Taihu Lake. Reservoir Fisheries, 27(3): 70-73.
(in Chinese with English abstract) |
Liu X T, Su D Z. 1962. Pliocene fished from Yushe Basin, Shanxi. Vertebrata Palasiatica, 6(1): 1-47.
(in Chinese with English abstract) |
Mayr E W. 1942. Systematics and the Origin of Species.Columbia University Press, New York. p.21-43.
|
Mesquita N, Hänfling B, Carvalho G R, Coelho M M. 2005. Phylogeography of the cyprinid Squalius aradensis and implications for conservation of the endemic freshwater fauna of southern Portugal. Molecular Ecology, 14(7): 1 939-1 954.
DOI:10.1111/j.1365-294X.2005.02569.x |
Messmer V, Jones G P, Munday P L, Planes S. 2012. Concordance between genetic and species diversity in coral reef fishes across the Pacific Ocean biodiversity gradient. Evolution, 66(12): 3902-3917.
DOI:10.1111/j.1558-5646.2012.01725.x |
Miralles A, Carranza S. 2010. Systematics and biogeography of the Neotropical genus Mabuya, with special emphasis on the Amazonian skink Mabuya nigropunctata (Reptilia, Scincidae). Molecular Phylogenetics and Evolution, 54(3): 857-869.
|
Nei M, Maruyama T, Chakraborty R. 1975. The bottleneck effect and genetic variability in populations. Evolution, 29(1): 1-10.
|
Nei M, Tajima F. 1981. DNA polymorphism detectable by restriction endonucleases. Genetics, 97(1): 145-163.
|
Nei M. 1982. Evolution of human races at the gene level. In: BonneTamir B, Cohen T, Goodman R M eds. Human Genetics, Part A. The Unfolding Genome. Alan R. Liss, New York. p.167-181.
|
Nei M. 1987. Molecular Evolutionary Genetics. Columbia University Press, New York. p.134-141.
|
Posada D, Crandall K A. 1998. MODELTEST:testing the model of DNA substitution. Bioinformatics, 14(9): 817-818.
DOI:10.1093/bioinformatics/14.9.817 |
Provan J, Bennett K D. 2008. Phylogeographic insights into cryptic glacial refugia. Trends in Ecology and Evolution, 23(10): 564-571.
DOI:10.1016/j.tree.2008.06.010 |
Pu Q. 1991. Evolution of natural environment in China since the last glacial period and its position in the global change. Quaternary Sciences, 11(3): 245-259.
(in Chinese with English abstract) |
Qi P Z, Guo B Y, Xie C X, Wu C W, Lu S M, Duan Y J, Zhou X J. 2013. Assessing the genetic diversity and population structure of Culter alburnus in China based on mitochondrial 16S rRNA and COI gene sequences. Biochemical Systematics and Ecology, 50: 390-396.
DOI:10.1016/j.bse.2013.04.010 |
Qi P Z, Qin J H, Xie C X. 2015. Determination of genetic diversity of wild and cultured topmouth culter (Culter alburnus) inhabiting China using mitochondrial DNA and microsatellites. Biochemical Systematics and Ecology, 61: 232-239.
DOI:10.1016/j.bse.2015.06.023 |
Rambaut A, Drummond A J. 2013-12-11. Tracer V1.6. http://beast.bio.ed.ac.uk/Tracer.
|
Rambaut A. 2016-10-04. FigTree v1.4.3. http://tree.bio.ed.ac.uk/software/figtree.
|
Rogers A R, Harpending H. 1992. Population growth makes waves in the distribution of pairwise genetic differences. Molecular Biology and Evolution, 9(3): 552-569.
|
Ronquist F, Teslenko M, Van Der Mark P, Ayres D L, Darling A, Höhna S, Larget B, Liu L, Suchard M A, Huelsenbeck J P. 2012. MrBayes 3.2:efficient Bayesian phylogenetic inference and model choice across a large model space. Systematic Biology, 61(3): 539-542.
DOI:10.1093/sysbio/sys029 |
Rundle H D, Nosil P. 2005. Ecological speciation. Ecology Letters, 8(3): 336-352.
DOI:10.1111/j.1461-0248.2004.00715.x |
Ruskey J A, Taylor E B. 2016. Morphological and genetic analysis of sympatric dace within the Rhinichthys cataractae species complex:A case of isolation lost. Biological Journal of the Linnean Society, 117(3): 547-563.
DOI:10.1111/bij.12657 |
Russell D W, Sambrook J. 2001. Molecular Cloning: A Laboratory Manual, third edition. Cold Spring Harbor Laboratory Press, New York. p.33-35.
|
Ruzzante D E. 2011. A comparison of several measures of genetic distance and population structure with microsatellite data:bias and sampling variance. Canadian Journal of Fisheries and Aquatic Sciences, 55(1): 1-14.
|
Shaklee J B, Tamaru C S, Waples R S. 1982. Speciation and evolution of marine fishes studied by the electrophoretic analysis of proteins. Pacific Science, 36(2): 141-157.
|
Tajima F. 1989. Statistical method for testing the neutral mutation hypothesis by DNA polymorphism. Genetics, 123(3): 585-595.
|
Taylor E B. 1999. Species pairs of north temperate freshwater fishes:Evolution, taxonomy, and conservation. Reviews in Fish Biology and Fisheries, 9(4): 299-324.
DOI:10.1023/A:1008955229420 |
Tedesco P A, Leprieur F, Hugueny B, Brosse S, Dürr H H, Beauchard O, Busson F, Oberdorff T. 2012. Patterns and processes of global riverine fish endemism. Global Ecology and Biogeography, 21(10): 977-987.
DOI:10.1111/j.1466-8238.2011.00749.x |
Wang J. 2013. Molecular Phylogenetic Relationships of Cultrinae sensu stricto and Related Groups (Teleostei: Cyprinidae) and Genetic Diversity of Megalobrama pellegrini (Cultrinae). Southwest University, Chongqing.p.19-37. (in Chinese with English abstract)
|
Wang W, Chen L Q, Na Y U, Jiang Z Q. 2008. Assessment of genetic diversity of topmouth culter Culter alburnus populations by COII sequences. Journal of Dalian Fisheries University, 23(5): 403-408.
(in Chinese with English abstract) |
Wang W, Chen L Q, Yang P, Hou L, He C B, Gu Z M, Liu Z J. 2007. Assessing genetic diversity of populations of topmouth culter (Culter alburnus) in China using AFLP markers. Biochemical Systematics and Ecology, 35(10): 662-669.
DOI:10.1016/j.bse.2007.04.008 |
Wang X C, Li Z X, Li X H, Li J, Liu Y, Long W G, Zhou J B, Wang F. 2012. Temperature, pressure, and composition of the mantle source region of late Cenozoic basalts in Hainan Island, SE Asia:a consequence of a young thermal mantle plume close to subduction zones?. Journal of Petrology, 53(1): 177-233.
DOI:10.1093/petrology/egr061 |
Weir B S, Cockerham C C. 1984. Estimating F-statistics for the analysis of population structure. Evolution, 38(6): 1358-1370.
|
Xiao Y S, Zhang Y, Gao T X, Yanagimoto T, Yabe M, Sakurai Y. 2009. Genetic diversity in the mtDNA control region and population structure in the small yellow croaker Larimichthys polyactis. Environmental Biology of Fishes, 85(4): 303-314.
DOI:10.1007/s10641-009-9497-0 |
Xiong W, Sui X Y, Liang S H, Chen Y F. 2015. Non-native freshwater fish species in China. Reviews in Fish Biology and Fisheries, 25(4): 651-687.
DOI:10.1007/s11160-015-9396-8 |
Xu W, Geng L W, Jia Z H, Li C T, Yi J S, Zhang C B. 2009. Preliminary studies on artificial propagation of Culter mongolicus mongolicus in Jingpo Lake. Freshwater Fisheries, 39(4): 63-66.
(in Chinese with English abstract) |
Yamaguchi K, Nakajima M, Taniguchi N. 2010. Loss of genetic variation and increased population differentiation in geographically peripheral populations of Japanese char Salvelinus leucomaenis. Aquaculture, 308(S1): S20-S27.
|
Yan J A. 2006. Paleontology and ecologic environmental evolution of the Quaternary in Hainan Island. Journal of Palaeogeography, 8(1): 103-115.
(in Chinese with English abstract) |
Yang H. 2009. Studies on the Biological Characteristics and Artifical Propagation of Topmouth Culter in Xingkai Lake. Northeast Agricultural University, Harbin. p.1-22.(in Chinese)
|
Yang Z T, Sun J J, Li G F, Xiao S B, Zhang H Q, Yang H R, Zhao H H, Liu L. 2016. Genetic diversity and genetic differentiation of Culter alburnus from eleven geographical populations of the Pearl River based on mitochondrial D-loop gene. Acta Scientiarum Naturalium Universitatis Sunyatseni, 55(2): 89-96.
(in Chinese with English abstract) |
Yi C L, Zhu Z Y, Wei L, Cui Z J, Zheng B X, Shi Y F. 2007. Advances in numerical dating of Quaternary glaciations in China. Zeitschrift für Geomorphologie, Supplementary Issues,, 51(2): 153-175.
DOI:10.1127/0372-8854/2007/0051S2-0153 |
Yi L, Deng C L, Tian L Z, Xu X Y, Jiang X Y, Qiang X K, Qin H F, Ge J Y, Chen G Q, Qiao S, Chen Y P, Shi X F, Xie Q, Yu H J, Zhu R X. 2016. Plio-Pleistocene evolution of Bohai Basin (East Asia):demise of Bohai Paleolake and transition to marine environment. Scientific Reports, 6: 29.
DOI:10.1038/s41598-016-0020-5 |
Yu D, Chen M, Tang Q Y, Li X J, Liu H Z. 2014. Geological events and Pliocene climate fluctuations explain the phylogeographical pattern of the cold water fish Rhynchocypris oxycephalus (Cypriniformes:Cyprinidae)in China. BMC Evolutionary Biology, 14: 225.
DOI:10.1186/s12862-014-0225-9 |
Zeng Z, Zeng X. 1989. Physical Geography of Hainan Island.Science Press, Beijing, China. p.66. (in Chinese)
|
Zhu Y R, Liu H Z. 2006. Genetic diversity and biogeographical process of Acheilognathus macropterus revealed by sequence variations of mitochondrial cytochrome b gene. Acta Hydrobiologica Sinica, 30(2): 134-140.
(in Chinese with English abstract) |