 2020, Vol. 38
Institute of Oceanology, Chinese Academy of Sciences
Article Information
- CHEN Xiaojuan, ZHANG Xiaoqi, SUN Yun, TU Zhigang, CAO Zhenjie, WANG Shifeng, ZHOU Yongcan
- Assessment of internal controls for data normalization of gene expression after different bacterial stimulation by quantitative real-time PCR in golden pompano Trachinotus blochii
- Journal of Oceanology and Limnology, 38(2): 480-489
- http://dx.doi.org/10.1007/s00343-019-9053-5
Article History
- Received Mar. 4, 2019
- accepted in principle May. 24, 2019
- accepted for publication Aug. 5, 2020


2 Hainan Academy of Ocean and Fisheries Sciences, Haikou 570228, China
During the last several years, quantitative real-time PCR (qRT-PCR) has been in widespread use for quantitation and detection of mRNA in all kinds of organisms (Sun and Hu, 2015). In comparison with traditional methods of RNA quantitation, qRT-PCR is substantially more sensitive, accurate, and accessible (Heid et al., 1996; Haller et al., 2004; Ransbotyn and Reusch, 2006; Yoo et al., 2009). However, some studies have reported that the selected housekeeping genes were not necessarily appropriate for the given experimental conditions when using qRT-PCR (Liu et al., 2005; Qiu et al., 2013). Many studies have also shown that the expression of housekeeping genes was affected by some external environmental factors (Infante et al., 2008; Zhong et al., 2008; Dang and Sun, 2011; Zheng and Sun, 2011; Li et al., 2016), indicating that the housekeeping gene is not truly stable. Therefore, the selection and normalization of the most appropriate housekeeping genes under different environmental conditions are very important (Selvey et al., 2001; Huggett et al., 2005).
The golden pompano Trachinotus blochii (Lacépède) was misapplied to Trachinotus ovatus, which is an Indo-Pacific species distributed from north to southern Japan and south to Australia (Liu et al., 2014). In China, T. blochii is one of the important commercial species. With the expansion of aquaculture industry, many bacterial diseases erupt, such as Vibrio harveyi, Edwardsiella tarda, and Streptococcus agalactiae, which cause substantial economic losses (Sun et al., 2009; Amal et al., 2012; Fransiska et al., 2019). At present, to our knowledge, there is no research related to the normalization of housekeeping genes of T. blochii during bacterial infection. In terms of qRT-PCR data analysis, geNorm, and NormFinder are typical algorithms (Vandesompele et al., 2002; Andersen et al., 2004). Specifically, the geNorm is used to assess the expression stability measure (M) value and to rank the optimum pair of reference genes (Vandesompele et al., 2002). However, in order to measure the systematic error, the NormFinder is applied to estimate the expression variation of each gene (Andersen et al., 2004).
In this study, we utilized qRT-PCR to analyze the accurate housekeeping gene of T. blochii following challenged by different bacterial diseases V. harveyi, E. tarda, or S. agalactie, using both geNorm and NormFinder to analyze the data. Seven common housekeeping genes were selected in the present study, including beta actin (Actin), 18S ribosomal RNA (18S rRNA), β-2-Microglobulin (B2M), glyceraldehyde-3-phosphate dehydrogenase (GAPDH), ubiquitin-conjugating enzyme E2 (UBCE), ribosomal protein L13 (RPL13), and elongation factor-1-α (EF1A). We identified and normalized the best internal genes after infecting juvenile T. blochii with each of the above pathogenic bacteria. These results will provide useful guidance for the selection of internal controls in future qRTPCR studies in this species.
2 MATERIAL AND METHOD 2.1 Experimental animalTrachinotus blochii (45±2 g, n=60) were supplied by a commercial fish farm in Sanya, Hainan Province, China. The fish were maintained in oxygenated seawater at 26℃ for two weeks to allow for acclimation to the new environment. Before initiating the experiments, fish were randomly selected for an inspection to confirm their health status (Wang et al., 2009). Tricaine methanesulfonate (Sigma, St. Louis, MO, USA) was used to anesthetize the fish prior to tissue collection (Schoettger and Julin, 1967; Hattingh, 1977).
2.2 Pathogen strains and culture conditionsThe pathogens V. harveyi, E. tarda, and S. agalactiae, were previously isolated from diseased fish in Hainan Province. The isolated bacteria were cultured at 28℃ in Luria-Bertani (LB) broth.
2.3 Bacteria challenge and tissue collectionThe healthy T. blochii were randomly divided into four groups (A, B, C, and D), with 15 individuals per group. The pathogens V. harveyi, E. tarda, and S. agalactiae were cultured in LB medium to an OD600≈0.8 and then re-suspended in phosphatebuffered saline (PBS). Since the fact that different bacteria have different lethal dose and disease time, we used different concentration of bacteria inoculum. Fish in the group A, B, and C was injected intraperitoneally with 100 μL V. harveyi (105 CFU/mL), E. tarda (106 CFU/mL) and S. agalactie (104 CFU/mL), respectively. While fish in the group D was injected intraperitoneally with 100 μL PBS as a control. After 48 h post challenge, five fish were randomly selected from each of the four groups, respectively. Tissues (spleen, kidney, intestine, and gill) were collected under sterile conditions after euthanasia. The tissues were then flash frozen in liquid nitrogen for preservation. The bacteria challenge experiment was repeated independently three times.
2.4 RNA extraction and cDNA library constructionTotal RNA from the tissues samples (spleen, kidney, intestine, and gill; 30 mg per each) were extracted with the EZNA Total RNA Kit (Omega BioTek, Doraville, GA, USA) and treated with RNasefree DNase I (Omega Bio-Tek, Doraville, GA, USA). The quality of the RNA was examined by determining 260/280 or 260/230 absorbance ratio using NanoDrop2000 (Thermo Scientific, USA) and gel electrophoresis. The final concentration of the extracted RNA was adjusted to 0.1 μg/μL with nuclease-free water. After that, cDNA was synthesized with 1 μg total RNA, random and Oligo (dT) primers, and the M-MLV reverse transcriptase (TaKaRa, Dalian, China) according to manufacturer's instructions.
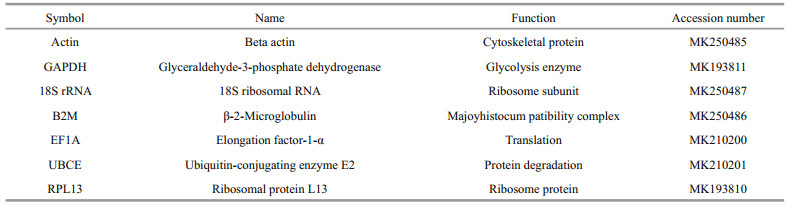
2.5 Determination of PCR efficiencySeven housekeeping genes (Actin, 18S rRNA, B2M, GAPDH, UBCE, RPL13, and EF1A; Table 1) were selected to determine the most stably expressed genes of T. blochii following bacterial injection. The specific primer pairs used to amplify each candidate housekeeping gene are designed by the Primer Premier 5 software (Table 2) with the following parameters: 37–270 bp product, 50%–65% GC content, 58–62℃ annealing temperature, and avoiding secondary structure. The specific of different PCR primer pairs was confirmed by the single band with appropriate size obtained after PCR amplification. There are three parallels for technical replicate comparison. The melting curve analysis was used to confirm the amplification specificity of each PCR. The amplification efficiency (E) and correlation coefficient (R2) values were assessed according to the slopes of the standard curves obtained from the use of serial 10-fold dilutions of cDNA; while the calculated formula is: E (%)=(10-1/slope–1)×100 (Kubista et al., 2006). The acceptable E values range from 95% to 102%.

Quantitative real-time PCR was used to analyze the stabiblity of housekeeping genes using the SYBR® Premix DimerEraser (Perfect Real Time) (TaKaRa, Dalian, China). The reaction was amplified in a total volume of 20 μL mixture with three replications. The mixture contained 1 μL cDNA, 0.2 μL each of the forward and reverse primers (10 μmol/L), 10 μL SYBR Premix buffer, and 8.6 μL PCR grade water. The cycling program was set with the following profile: 94℃ for 2 min, followed by 40 cycles at 94℃ for 15 s, 59℃ for 15 s, and 72℃ for 30 s. geNorm is used to calculate the gene expression stability measure (M) for a reference gene as the average pairwise variation (V) for that gene with all other tested reference genes; stepwise exclusion of the gene with the highest M value allows ranking of the tested genes according to their expression stability (Vandesompele et al., 2002). NormFinder utilizes a mathematical model of gene expression that enables estimation of the overall variation of the candidate normalization genes and the variation between sample subgroups of the sample set (Andersen et al., 2004).
3 RESULT 3.1 Quality of qRT-PCR amplificationThe E and R2 values of the seven candidate reference genes ranged from 95% to 102%, and 0.993 to 0.999, respectively (Table 2).
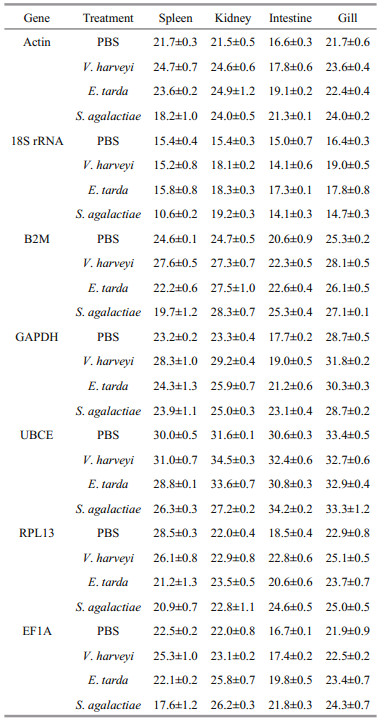
3.2 The expression of housekeeping genes followingstimulation with different bacteria After stimulation for 48 h with various bacteria, there were variations in the transcription levels of all the genes in various tissues (Table 3). In terms of V. harveyi stimulation, the least changes were observed with the 18S rRNA and UBCE in spleen, while all other genes, particularly GAPDH, exhibited a maximum Ct variation of 5.1. In kidney, the RPL13 was the only gene that showed less change. In intestine, except for the 18S rRNA and EF1A, all other genes had Ct variations greater than 1, with the highest Ct variation (4.3) exhibited by the RPL13. In gill, the GAPDH and B2M exhibited high Ct variations, 3.1 and 2.8, respectively. In terms of E. tarda stimulation, the RPL13 showed a maximum Ct variation of 7.3 in spleen (Table 3). There were slightly difference of Ct variation observed with the EF1A in kidney (3.8), the GAPDH in intestine (3.5), the Actin in kidney (3.4), the 18S rRNA in kidney (2.9), the B2M in kidney (2.8), and UBCE in kidney (2.0). In terms of S. agalactie stimulation, the RPL13 showed a maximum Ct variation of 7.6 in spleen, following by the GAPDH, EF1A, B2M, 18S rRNA, Actin and UBCE with variations of 5.4 in intestine, 5.1 in intestine, 4.9 in spleen, 4.8 in spleen, 4.7 in intestine and 4.4 in kidney, respectively (Table 3).
|
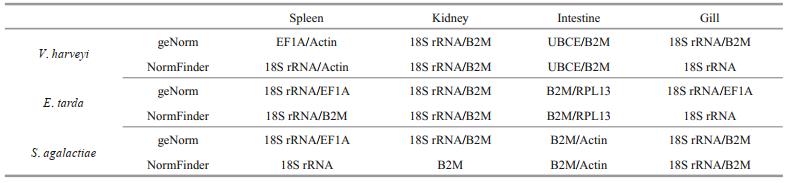
The geNorm analysis indicated that the M value of all the genes in the four examined tissues after three bacteria stimulated varied from 0.01 to 1.68 (Figs. 1–3). Apart from the GAPDH in spleen after S. agalactie stimulated (M value=1.68, Fig. 3), the M value under the other treatments were lower than the expression stability threshold (i.e., 1.5) proposed by geNorm. Following V. harveyi stimulation, in spleen, the M value of the GAPDH was the highest (1.32), which was followed in decreasing order by those of 18S rRNA, UBCE, RPL13, B2M, EF1A, and Actin (Fig. 1), with the last two genes (EF1A/Actin) being recognized as the most stable genes. In kidney, intestine, and gill, the minimum M value was observed in 18S rRNA/ B2M, UBCE/B2M, and 18S rRNA/B2M, respectively (Fig. 1). Similarly, in response to E. tarda stimulation, 18S rRNA/EF1A, 18S rRNA/B2M, B2M/RPL13 and 18S rRNA/EF1A were indicated the minimum M value in spleen, kidney, intestine, and gill, respectively. Therefore, these genes were determined to be the optimal housekeeping genes in these tissues (Fig. 2). Following S. agalactie stimulation, 18S rRNA/EF1A, 18S rRNA/B2M, B2M/Actin, and 18S rRNA/B2M were observed to have the minimum M value in spleen, kidney, intestine, and gill, respectively. Thus, these genes were the best target housekeeping genes in these tissues for analysis (Fig. 3).

|
| Fig.1 Expression stability of the housekeeping genes confirmed by geNorm at 48 h post-infection by V. harveyi in T. blochii tissues The expression of the housekeeping genes after challenged by PBS or V. harvayi at 48 h post-infection in T. blochii tissues was determined by qRT-PCR, the expression stability (M) of each of the genes was calculated by geNorm. The M value was lower, the expression was more stable. |

|
| Fig.2 Expression stability of the housekeeping genes confirmed by geNorm at 48 h post-infection by E. tarda in T. blochii tissues The expression of the housekeeping genes after challenged by PBS or E. tarda at 48 h post-infection in T. blochii tissues was determined by qRT-PCR, the expression stability (M) of each of the genes was calculated by geNorm. The M value was lower, the expression was more stable. |

|
| Fig.3 Expression stability of the housekeeping genes confirmed by geNorm at 48 h post-infection by S. agalactiae in T. blochii tissues The expression of the housekeeping genes after challenged by PBS or S. agalactiae at 48 h post-infection in T. blochii tissues was determined by qRT-PCR, the expression stability (M) of each of the genes was calculated by geNorm. The M value was lower, the expression was more stable. |
The pairwise variation (V) between two sequential normalization factors containing a growing number of genes was assessed to determine the optimal number of genes required for data normalization. For expressions in four tissues following V. harveyi stimulation, all of the V2/3 values exhibited less than 0.15 (Fig. 4) that indicating the third reference gene was not necessary included in each case. Similarly, in response to E. tarda and S. agalactie stimulation, the results of measurements on 48 h samples indicated that the V2/3 values were all lower than 0.15 of all the genes in the four tissues tested (Figs. 5 & 6). Therefore, the target pairs V2/3 are considered the most reliable and effective housekeeping genes in these tissues.

|
| Fig.4 Determination of the optimal number of reference genes by NormFinder for normalization after V. harveyi infection The mRNA levels of the housekeeping genes in various tissues of T. blochii after challenged by PBS or V. harveyi were determined by RT-qPCR. The pairwise variation between normalization factors was determined by NormFinder. |

|
| Fig.5 Determination of the optimal number of reference genes by NormFinder for normalization after E. tarda infection The mRNA levels of the housekeeping genes in various tissues of T. blochii after challenged by PBS or E. tarda were determined by RT-qPCR. The pairwise variation between normalization factors was determined by NormFinder. |

|
| Fig.6 Determination of the optimal number of reference genes by NormFinder for normalization after S. agalactiae infection The mRNA levels of the housekeeping genes in various tissues of T. blochii after challenged by PBS or S. agalactiae were determined by RT-qPCR. The pairwise variation between normalization factors was determined by NormFinder. |
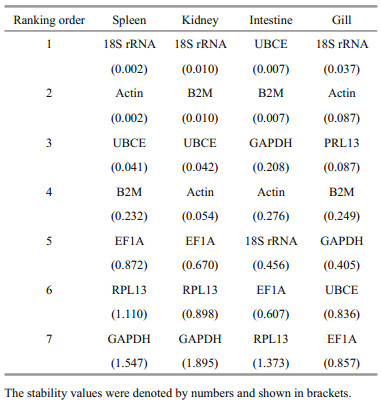
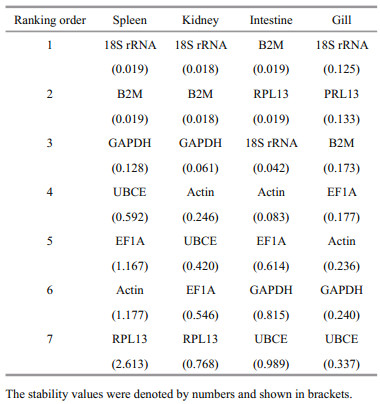
The ranking orders produced by NormFinder for the expressions in spleen, kidney, intestine, and gill were mostly similar to those obtained by geNorm. NormFinder ranked the candidate reference genes by scores. Following stimulation with V. harveyi, the 18S rRNA/Actin (0.002) was identified as the most stable genes in spleen by NormFinder analysis, followed in order of decreasing stability by UBCE (0.041), B2M (0.232), EF1A (0.872), RPL13 (1.110), and GAPDH (1.574) (Table 4). The most stable genes in kidney, intestine, and gill after V. harveyi stimulated, ranked by NormFinder were 18S rRNA/B2M, UBCE/ B2M, and 18S rRNA respectively. Following E. tarda stimulation, the most stable genes in spleen, kidney, intestine, and gill were 18S rRNA/B2M, 18S rRNA/ B2M, B2M/RPL13, and 18S rRNA respectively (Table 5). In response to stimulation with S. agalactie, the most stable genes in spleen, kidney, intestine, and gill were 18S rRNA, B2M, B2M/Actin, and 18S rRNA/B2M, respectively (Table 6).
|
|

|
To normalize the most suitable housekeeping genes following challenged with different bacteria, the geNorm and NormFinder algorithms were both applied. In summary, the results showed that the 18S rRNA was the best reference genes in spleen and gill following different bacterial stimulation; while the B2M was the best reference genes in kidney and intestine (Table 7).
|
In other previous studies, NormFinder, bestKeeper and geNorm (Vandesompele et al., 2002; Andersen et al., 2004; Pfaffl et al., 2004) have been used in conjunction with qRT-PCR to determine the optimal genes to use as internal references when examining gene expression in cells and tissues of various taxon. A normalization factor generated by geNorm based on multiple internal controls can be used in the future qRT-PCR analysis, whereas NormFinder can be applied to select the optimal reference gene referring to the expression stability of the candidate genes (Andersen et al., 2004).
In this study, we selected seven commonly used reference genes, which have also been used in many other species as internal controls for qRT-PCR, including Actin, 18S rRNA, B2M, GAPDH, UBCE, RPL13, and EF1A (Zhong et al., 2008; Bower and Johnston, 2009; Dang and Sun, 2011; Sun and Hu 2015; Li et al., 2016). To normalize the most stable reference genes following challenged with different bacteria in T. blochii, geNorm and NormFinder were utilized to analyze the data. In some previous studies, housekeeping genes were observed to follow a tissue-specific expression trend in red drum (Sciaenops ocellatus) and zebrafish (Danio rerio) (McCurley and Callard, 2008; Sun and Hu, 2015). The other studies have reported that the most stable housekeeping gene varies with experimental conditions. For example, in different tissues or at different growth stages, the suitable internal reference genes do not remain the same (Filby and Tyler, 2007; Infante et al., 2008; Fernandes et al., 2008; Zhong et al., 2008; Bower and Johnston, 2009; Li et al., 2010; Øvergård et al., 2010; Løvoll et al., 2011; Dang and Sun, 2011; Zheng and Sun, 2011). For instance, in red drum during bacterial infection, RPS35, ACTB, EF1A, ND1, TUBB, EF1A, ACTB, and ACTB were analyzed and determined to be the ideal internal references in brain, gill, heart, intestine, kidney, liver, muscle, and spleen, respectively (Sun and Hu, 2015). geNorm identified the most suitable internal reference genes from different genes. The most suitable internal reference genes were also analyzed by NormFinder.
5 CONCLUSIONTo improve the accuracy of evaluation in this study, we normalized the optimal reference genes of T. blochii at 48 hpi with different bacteria using geNorm and NormFinder. When studying T. blochii gene expression after being stimulated by different bacteria, the most stable internal controls should be selected for each tissue being tested. Following bacterial challenge, the most stable genes identified by geNorm and NormFinder were 18S rRNA, B2M, B2M, and 18S rRNA, for reference in spleen, kidney, intestine, and gill of T. blochii, respectively.
6 DATA AVAILABILITY STATEMENTThe authors declare that all data supporting the findings of this study are available within the article.
Amal M N A, Zamri-Saad M, Iftikhar A R, Siti-Zahrah A, Aziel S, Fahmi S. 2012. An Outbreak of Streptococcus agalactiae Infection in Cage-Cultured Golden Pompano, Trachinotus blochii (Lacépède), in Malaysia. Journal of Fish Diseases, 35(11): 849-852.
DOI:10.1111/j.1365-2761.2012.01443.x |
Andersen C L, Jensen J L, Ørntof T F. 2004. Normalization of real-time quantitative reverse transcription-PCR data:a model-based variance estimation approach to identify genes suited for normalization, applied to bladder and colon cancer data sets. Cancer Research, 64(15): 5245-5250.
DOI:10.1158/0008-5472.CAN-04-0496 |
Bower N I, Johnston I A. 2009. Selection of reference genes for expression studies with fish myogenic cell cultures. BMC Molecular Biology, 10: 80.
DOI:10.1186/1471-2199-10-80 |
Dang W, Sun L. 2011. Determination of internal controls for quantitative real time RT-PCR analysis of the effect of Edwardsiella tarda infection on gene expression in turbot(Scophthalmus maximus). Fish & Shellfish Immunology, 30(2): 720-728.
DOI:10.1016/j.fsi.2010.12.028 |
Fernandes J M O, Mommens M, Hagen Ø, Babiak I, Solberg C. 2008. Selection of suitable reference genes for realtime PCR studies of Atlantic halibut development. Comparative Biochemistry and Physiology Part B: Biochemistry and Molecular Biology, 150(1): 23-32, https://doi.org/ 10.1016/j.cbpb.2008.01.003.
|
Filby A L, Tyler C R. 2007. Appropriate 'housekeeping' genes for use in expression profiling the effects of environmental estrogens in fish. BMC Molecular Biology, 8: 10.
DOI:10.1186/1471-2199-8-10 |
Fransiska J D, Raza'i T S, Wulandari R. 2019. Inhibitory effect of lactic acid bacteria from digestive tract of Trachinotus blochii againts Vibrio harveyi in in-vitro. Intek Akuakultur, 3(1): 57-65.
DOI:10.31629/intek.v3i1.1000 |
Haller F, Kulle B, Schwager S, Gunawan B, Von Heydebreck A, Sültmann H, Füzesi L. 2004. Equivalence test in quantitative reverse transcription polymerase chain reaction:confirmation of reference genes suitable for normalization. Analytical Biochemistry, 335(1): 1-9.
DOI:10.1016/j.ab.2004.08.024 |
Hattingh J. 1977. The effect of tricaine methanesulphonate(MS-222) on the microhaematocrit of fish blood. Journal of Fish Biology, 10(5): 453-455.
DOI:10.1111/j.1095-8649.1977.tb04077.x |
Heid C A, Stevens J, Livak K J, Williams P M. 1996. Real time quantitative PCR. Genome Research, 6(10): 986-994.
DOI:10.1101/gr.6.10.986 |
Huggett J, Dheda K, Bustin S, Zumla A. 2005. Real-time RTPCR normalisation; strategies and considerations. Genes & Immunity, 6(4): 279-284.
DOI:10.1038/sj.gene.6364190 |
Infante C, Matsuoka M P, Asensio E, Cañavate J P, Reith M, Manchado M. 2008. Selection of housekeeping genes for gene expression studies in larvae from flatfish using realtime PCR. BMC Molecular Biology, 9: 28.
DOI:10.1186/1471-2199-9-28 |
Kubista M, Andrade J M, Bengtsson M, Forootan A, Jonák J, Lind K, Sindelka R, Sjöback R, Sjögreen B, Strömbom L, Ståhlberg A, Zoric N. 2006. The real-time polymerase chain reaction. Molecular Aspects of Medicine, 27(2-3): 95-125.
DOI:10.1016/j.mam.2005.12.007 |
Li D, Wu P, He M F, Li W, Xiao T Y, Chu W Y. 2016. Screening of reference genes in Siniperca chuatsi for qRT-PCR analysis. Life Science Research, 20(3): 213-217.
(in Chinese with English abstract) DOI:10.16605/j.cnki.1007-7847.2016.03.005 |
Li Z J, Yang L J, Wang J, Shi W C, Pawar R A, Liu Y M, Xu C G, Cong W H, Hu Q R, Lu T Y, Xia F, Guo W, Zhao M, Zhang Y Y. 2010. β-Actin is a useful internal control for tissue-specific gene expression studies using quantitative real-time PCR in the half-smooth tongue sole Cynoglossus semilaevis challenged with LPS or Vibrio anguillarum. Fish & Shellfish Immunology, 29(1): 89-93.
DOI:10.1016/j.fsi.2010.02.021 |
Liu D W, Chen S T, Liu H P. 2005. Choice of endogenous control for gene expression in nonsmall cell lung cancer. European Respiratory Journal, 26(6): 1002-1008.
DOI:10.1183/09031936.05.00050205 |
Liu M, Chen X, Yang S Y. 2014. Marine Fishes of Southern Fujian, China, Volume 2. Ocean Press, Beijing, China.p.165-167. (in Chinese)
|
Løvoll M, Austbø L, Jørgensen J B, Rimstad E, Frost P. 2011. Transcription of reference genes used for quantitative RTPCR in Atlantic salmon is affected by viral infection. Veterinary Research, 42: 8.
DOI:10.1186/1297-9716-42-8 |
McCurley A T, Callard G V. 2008. Characterization of housekeeping genes in zebrafish:male-female differences and effects of tissue type, developmental stage and chemical treatment. BMC Molecular Biology, 9: 102.
DOI:10.1186/1471-2199-9-102 |
Øvergård A C, Nerland A H, Patel S. 2010. Evaluation of potential reference genes for real time RT-PCR studies in Atlantic halibut (Hippoglossus Hippoglossus L.); during development, in tissues of healthy and NNV-injected fish, and in anterior kidney leucocytes. BMC Molecular Biology, 11: 36.
DOI:10.1186/1471-2199-11-36 |
Pfaffl M W, Tichopad A, Prgomet C, Neuvians T P. 2004. Determination of stable housekeeping genes, differentially regulated target genes and sample integrity:bestkeeperexcel-based tool using pair-wise correlations. Biotechnology Letters, 26(6): 509-515.
DOI:10.1023/B:BILE.0000019559.84305.47 |
Qiu R, Sun B G, Fang S S, Sun L, Liu X. 2013. Identification of normalization factors for quantitative real-time RTPCR analysis of gene expression in Pacific abalone Haliotis discus hannai. Chinese Journal of Oceanology and Limnology, 31(2): 421-430.
DOI:10.1007/s00343-013-2221-0 |
Ransbotyn V, Reusch T B H. 2006. Housekeeping gene selection for quantitative real-time PCR assays in the seagrass Zostera marina subjected to heat stress. Limnology and Oceanography Methods, 4(10): 367-373.
DOI:10.4319/lom.2006.4.367 |
Schoettger R A, Julin A M. 1967. Efficacy of MS-222 as an anaesthetic on four salmonids. In: Investigations in Fish Control, Resource Publication 19. U.S. Department of the Interior, Bureau of Sport Fisheries and Wildlife, Washington, DC, p.3-15.
|
Selvey S, Thompson E W, Matthaei K, Lea R A, Irving M G, Griffiths L R. 2001. Beta-actin-an unsuitable internal control for RT-PCR. Molecular and Cellular Probes, 15(5): 307-311.
DOI:10.1006/mcpr.2001.0376 |
Sun B G, Hu Y H. 2015. Evaluation of potential internal references for quantitative real-time RT-PCR normalization of gene expression in red drum (Sciaenops ocellatus). Fish Physiology and Biochemistry, 41(3): 695-704.
DOI:10.1007/s10695-015-0039-8 |
Sun K S, Wang H L, Zhang M, Xiao Z Z, Sun L. 2009. Genetic mechanisms of multi-antimicrobial resistance in a pathogenic Edwardsiella tarda strain. Aquaculture, 289(1): 134-139.
DOI:10.1016/j.aquaculture.2008.12.021 |
Vandesompele J, De Preter K, Pattyn F, Poppe B, Roy N V, De Paepe A, Speleman F. 2002. Accurate normalization of real-time quantitative RT-PCR data by geometric averaging of multiple internal control genes. Genome Biology, 3(7): RESEARCH0034.
DOI:10.1186/gb-2002-3-7-research0034 |
Wang H R, Hu Y H, Zhang W W, Sun L. 2009. Construction of an attenuated Pseudomonas fluorescens strain and evaluation of its potential as a cross-protective vaccine. Vaccine, 27(30): 4047-4055.
DOI:10.1016/j.vaccine.2009.04.023 |
Yoo W G, Kim T I, Li S Y, Kwon O S, Cho P Y, Kim T S, Kim K, Hong S J. 2009. Reference genes for quantitative analysis on Clonorchis sinensis gene expression by realtime PCR. Parasitology Research, 104(2): 321-328.
DOI:10.1007/s00436-008-1195-x |
Zheng W J, Sun L. 2011. Evaluation of housekeeping genes as references for quantitative real time RT-PCR analysis of gene expression in Japanese flounder (Paralichthys olivaceus). Fish & Shellfish Immunology, 30(2): 638-645.
DOI:10.1016/j.fsi.2010.12.014 |
Zhong Q W, Zhang Q Q, Wang Z G, Qi J, Chen Y J, Li S, Sun Y Y, Li C M, Lan X. 2008. Expression profiling and validation of potential reference genes during Paralichthys olivaceus embryogenesis. Marine Biotechnology, 10(3): 310-318.
DOI:10.1007/s10126-007-9064-7 |