 2020, Vol. 38
Institute of Oceanology, Chinese Academy of Sciences
Article Information
- SUN Shao'e, CHENG Jiao, SUN Song, SHA Zhongli
- Complete mitochondrial genomes of two deep-sea pandalid shrimps, Heterocarpus ensifer and Bitias brevis: insights into the phylogenetic position of Pandalidae (Decapoda: Caridea)
- Journal of Oceanology and Limnology, 38(3): 816-825
- http://dx.doi.org/10.1007/s00343-019-9040-x
Article History
- Received Feb. 27, 2019
- accepted in principle May. 3, 2019
- accepted for publication Sep. 9, 2019


2 Deep Sea Research Center, Institute of Oceanology, Chinese Academy of Sciences, Qingdao 266071, China;
3 University of Chinese Academy of Sciences, Beijing 100049, China
Animal mitochondrial (mt) genomes are covalently closed circular molecules of DNA that usually contain 37 genes, including 13 protein-coding genes, 22 tRNA genes, 2 rRNA genes, and an control region (CR) (Boore, 1999). Mitochondrial DNA sequences are extensively used in population genetics, species identification, phylogenetic relationships at various taxonomic levels and comparative and evolutionary genomics studies, owing to their unique features of conserved gene content, lack of extensive recombination, relatively high evolutionary rate and abundant marker types (Moritz and Brown, 1987; Curole and Kocher, 1999; Hebert et al., 2003; Gissi et al., 2008). As organelle genomes, the complete mitochondrial genomes also provide a suite of genome-level features, such as the rearrangement of genes, base composition, codon usage, tRNA and rRNA gene secondary structures (Simon et al., 2006; Gissi et al., 2008; Liu et al., 2016).
Mitochondrial gene arrangements seem seldom to have changed in some phyla of animal. Most vertebrate mitogenomes have a typical gene order, excluding groups such as birds and amphibians (Mindell et al., 1998; Mueller and Boore, 2005). However, invertebrates display accelerated gene rearrangement events (Cameron et al., 2007). Gene arrangement show amount of variation in crustaceans mitogenomes, e.g. amphipods (Stokkan et al., 2016), in which three species of the same genus Pseudoniphargus display each a unique mitochondrial gene arrangement with respect to either the presumed Pancrustacean order or those known for other amphipods. The mitochondrial gene rearrangement within a lineage has been supposed to be phylogenetically informative (Boore and Brown, 1998; Serb and Lydeard, 2003; Boore et al., 2004; Yuan et al., 2012; Yang et al., 2016). Previous study have suggested that positive selection could act on gene order in the mitogenomes (Satoh et al., 2010).
The deep sea occupies a vast portion of the world ocean, which is by far the largest environment on the planet. However, the knowledge of the diversity and evolutionary history of the deep-sea fauna is still remarkably poor. For a long time, the deep sea has been regarded as a region with a limited number of species, owing to its harsh biotic conditions with low temperatures, extreme hydrostatic pressures, and the absence of light and nutrient-poor sediments (Gage and Tyler, 1991). Caridea Dana, 1852 is one of the largest infraorders in the order Decapoda, containing over 3 400 species in 36 families (De Grave and Fransen, 2011; Liao et al., 2017). They occur in all aquatic habitats on the planet, ranging from freshwater to the deep sea ecosystems, providing an excellent model to explore the origin and evolution of faunas in different aquatic habitats. Compared to the size and diversity of Caridea, the existing information on Caridea mitogenome is still limited. To date, the complete mitogenomes of Caridea were determined only in 51 different species (https://www.ncbi.nlm.nih.gov/). Furthermore, within the infraorder Caridea, the sampling is imbalanced: twenty-three for the family Atyidae, eleven for the Palaemonidae, seven for the Alvinocarididae, five for the Alpheidae, two for the Pandalidae, two for the Crangonidae and one for the Rhynchocinetidae.
The family Pandalidae is a diverse caridean group with more than 189 species in 23 genera (De Grave et al., 2009), which distributed and inhabiting shallow and deep waters below 4 000 m depth. Some studies based on the partial sequences supported the monophyly of the family Pandalidae (Bracken et al., 2009; Li et al., 2011; Aznar-Cormano et al., 2015), except Liao et al. (2019), which state that Pandalidae is paraphyletic with the monophyletic family Thalassocarididae nested within. However, there has been no previous attempt to resolve phylogenetic position of Pandalidae within Caridea using mitogenome sequences. To date, only two complete mitogenome of pandalid species, Chlorotocus crassicornis (KY944589) and Pandalus borealis (LC341266), were available in the GenBank.
To improve our understanding of the mitogenome evolution and phylogenetic position of Pandalidae, the complete mitogenome of two deep-sea pandalid shrimps, Heterocarpus ensifer and Bitias brevis, were sequenced. We compared the newly sequenced mitogenomes with the previously published sequences. We provided a comparative analysis of four pandalid mitogenomes, including the genomic structures, base composition, codon usage, and the structure features for the control regions. Finally, we evaluated the phylogenetic position of pandalid species within Caridea in mitogenome perspective.
2 MATERIAL AND METHOD 2.1 Sampling and DNA extractionThe deep-sea pandalid shrimp, H. ensifer was captured from Yap Seamount, Western Pacific (11°18′06.941′′N, 139°21′43.096′′E) at a depth of 415.7 m, and B. brevis were captured from 8°51′N, 137°47′E at a depth of 311 m. Specimens were immediately preserved in 95% ethanol until DNA extraction. Total genomic DNA was isolated using the DNeasy tissue kit (Qiagen) according to the manufacturer's instructions.
2.2 Illumina sequencing, mitogenome assembly and annotationA total amount of 1 μg DNA per sample was used as input material for the DNA sample preparations. Sequencing libraries were generated using NEBNext® Ultra™ DNA Library Prep Kit for Illumina (NEB, USA) following manufacturer's recommendations and index codes were added to attribute sequences to each sample. The clustering of the index-coded samples was performed on a cBot Cluster Generation System according to the manufacturer's instructions. After cluster generation, the library preparations were sequenced on an Illumina HiSeq 2500 platform and paired-end reads were generated. The raw reads filtered with average quality value (lower than Q20) were excluded from further analysis. Clean data were then assembled using SOAP denovo (Li et al., 2010) with k-mer=55. Then we blast contigs against the reference mitogenome of Chlorotocus crassicornis (KY944589) from the family Pandalidae. The contigs identified as mitogenome sequences were manually examined for repeats at the beginning and end of the sequence to establish a circular mitochondrial DNA.
ORF Finder (http://www.ncbi.nlm.nih.gov/gorf/gorf.html) and BLASTx were used to determine the protein coding genes (PCGs) using the invertebrate mitochondrial genetic code. The positions of transfer RNA (tRNA) genes were localized by ARWEN (Laslett and Canbäck, 2008) and DOGMA (Wyman et al., 2004) using the invertebrate mitochondrial genetic code and the default search mode. To define the ribosomal RNA (rRNA) genes, the inferred sequences were identified by their similarity to those of other published crustacean mitogenomes by BLAST search (http://www.ncbi.nlm.nih.gov/BLAST).
The mitochondrial genomes of the H. ensifer and B. brevis mitogenomes were generated with the program CGView (Stothard and Wishart, 2005). The two mitochondrial genomes have been deposited in the GenBank database under the accession numbers MG674228 for H. ensifer and MG674229 for B. brevis.
2.3 Sequence analysisThe base composition and skewness analyses across the complete genomes (plus strand) were performed and compared among H. ensifer, B. brevis, C. crassicornis (KY944589), and Pandalus borealis (LC341266). The A+T content values were computed using Editseq program from DNASTAR. The skew in nucleotide composition was calculated by GC and AT skew, which were measured according to the formulae by Perna and Kocher (1995), AT skew=(A–T)/(A+T); GC skew=(G–C)/(G+C). The frequencies of codons and relative synonymous codon usage (RSCU) were determined with MEGA 5 (Tamura et al., 2011). The tandem repeat sequences were searched by Tandem Repeats Finder 4.0 (Benson, 1999). The potential secondary structures of tandem repeat sequences were predicted using the online Mfold software version 3.2 with default settings (Zuker, 2003). When more than one secondary structures were possible, the one with the lowest free energy score was used.
2.4 Phylogenetic analysisThe nucleotide sequences of 13 PCGs and 2 rRNA genes from 51 complete Caridea mitogenomes (Supplementary Table S1) were used to perform phylogenetic analyses, with five amphipod species as the outgroups. The nucleotide sequences for the PCG and rRNA genes were aligned with MAFFT (Katoh et al., 2005), applying the E-INS-I manual strategy with default parameters. Ambiguously aligned and variable areas were recognized using the program Gblocks (Castresana, 2000; Talavera and Castresana, 2007) (default setting) and excluded from the analyses. DAMBE 4.2.13 (Xia et al., 2003; Xia and Lemey, 2009) was taken to measure the substitution saturation. PartitionFinder v1.1.1 (Lanfear et al., 2012) was used to determine the best partitioning schemes and corresponding substitution models. The data blocks were predefined by genes and codon positions for nucleotide sequences of protein-coding genes. The Bayesian information criterion (BIC) and the greedy heuristic search algorithm with branch lengths estimated as "unlinked" to identify the best-fit partition schemes. The best-fit partitioning schemes (Supplementary Table S2) were adopted in the phylogenetic analyses.
Maximum Likelihood (ML) analyses were performed using IQTREE Web Server (http://iqtree.cibiv.univie.ac.at/; Trifinopoulos et al., 2016) with partition models. The reliability of the tree topologies was evaluated using bootstrap support with 100 replicates for the ML analysis. Bayesian inference (BI) was performed using MrBayes 3.2 (Ronquist et al., 2012), with each partition allowed to have its own set of parameters, respectively. The Markov chain Monte Carlo (MCMC) was run for 10 million generations, with sampling frequency of 1 000. All parameters were checked with Tracer v 1.5 (Drummond and Rambaut, 2007). After discarding the first 5 000 trees as burn-in, the remaining 5 000 sampled trees were used to calculate a majority rule consensus tree and posterior probabilities (PP).
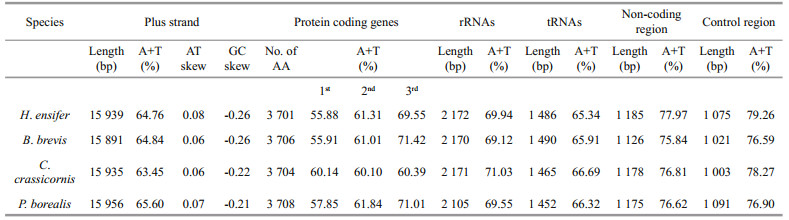
3 RESULT AND DISCUSSION 3.1 General features of Pandalidae mitochondrial genomesThe lengths of the newly complete mitogenomes of H. ensifer and B. brevis were 15 939 bp and 15 891 bp, respectively (Supplementary Fig.S1). The length of H. ensifer mitogenome was longer than that of C. crassicornis (KY944589) (15 935 bp), but shorter than that of Pandalus borealis (LC341266). The mitogenome of B. brevis was the smallest among the available pandalid shrimps. Each mitogenome of the two pandalids encodes 37 genes, including 13 PCGs (cox1-3, cytb, nad1-6, nad4l, atp6, and atp8), 22 tRNA genes and two rRNA genes (rrnL and rrnS).They arranged in the same order with that of the typical pancrustacean ground pattern (Lavrov et al., 2000). Four protein coding genes (nad1, nad5, nad4, and nad4l), and six tRNAs gnnes (tRNAHis, tRNAPro, tRNALeu (UAG), tRNAVal, tRNAGln, and tRNATyr) were encoded by the H-strand, while the remaining genes were encoded by the L-strand (Supplementary Fig.S1).

|
| Fig.1 Linear representation of the mitochondrial gene arrangement of the ancestral mitogenome of pancrustaceans and Caridea species Cox1 has been designated the start point for all genomes. Protein-coding, rRNA and tRNA genes are transcribed from left to right except those indicated by underscores (), which are transcribed from right to left. The gene abbreviations are designated as in the Fig. 1. The gene segments are not drawn to scale. The bars indicate rearranged gene blocks. The character "D" indicates the duplication events. |
The base counts yield A+T composition of 64.76% and 64.84% for H. ensifer and B. brevis, which were slightly higher than that of C. crassicornis but lower than that of P. borealis (Table 1). The AT content of third codon position of PCGs varied from 60.39% to 71.42%, being slightly lower than in the control region (76.59% to 79.26%). This phenomenon was in agreement with the "transcription hypothesis of the codon usage" (Sun et al., 2009), which suggested that the cells have a high availability of ATP and relatively low availability of the other three NTPs. The nucleotide compositions of four pandalid mitogenomes are all strongly skewed away from G in favor of C (the GC-skews are from -0.21 in P. borealis to -0.26 in both H. ensifer and B. brevis) and from T in favor of A (the AT-skews are from 0.06 in both B. brevis and C. crassicornis to 0.08 in H. ensifer) (Table 1). These values were similar to those found in other Caridea species with the mitochondrial genome available (Sun et al., 2018). The Pandalidae showed the same mitochondrial gene orders with the pancrustacean ground pattern, although tRNAs rearranged between some caridean families (Fig. 1) (Lavrov et al., 2000).
The PCGs of the pandalid mitochondrial genomes are conserved among four species: an average of 83% for amino acid and 74% for nucleotide sequences. Pairwise identities were also calculated for nucleotide and amino acid sequences of the 13 individual PCGs. The gene cox1 is the most conserved in both nucleotide sequences (80%) and amino acid sequences (95%). The genes atp8, nad6, and nad2 are the most variable in nucleotide sequences (71%, 65%, and 66%, respectively) and in amino acid sequences (77%, 66% and 70%, respectively).
Most PCGs of the four pandalid mitochondrial genomes were defined by the common start codons for invertebrate mitogenome (ATN codon). The initiation site for the cox1 gene in C. crassicornis were GCG and in P. borealis were CGA. The initiation site for the atp6 gene in H. ensifer and B. brevis were TTG. Out of the 13 protein-coding genes, five show incomplete stop codons (cox1, cox2, cytb, nad4, and nad5). It has been explained that a functional TAA stop codon will be created viapost-transcriptional polyadenylation in the genes which were ended with partial stop codons T or TA (Ojala et al., 1981).
Excluding stop codons, the mitogenomes of H. ensifer, B. brevis, C. crassicornis and P. borealis encodes 3 701, 3 706, 3 704 and 3 708 amino acids (Supplementary Table S3), respectively. The RSCU values for the codons NNU and NNA were usually higher than 1, suggesting a strong A+T-bias in their third codon position. The most representative was the leucine amino acid, i.e. The TTA codon presented a RSCU value of 2.11–2.70 in the four Pandalidae mitogenomes, while the codon TTG, which also translates a leucine, showed a RSCU value of 0.55– 0.69. This result was also consistent with the hypothesis that the codon usage bias and the AT bias of the third codon position may be positively correlated in the mitogenomes (Salvato et al., 2008; Kim et al., 2009; Chai et al., 2012; Hao et al., 2012). In Pandalidae PCGs, the content of A+T-rich codon families (Phe, Ile, Met, Tyr, Asn and Lys) are higher than G+C-rich codon families (Pro, Ala, Arg and Gly). The ratio G+C/A+T-rich codons was 0.67, 0.69, 0.68, 0.68 in H. ensifer and B. brevis, C. crassicornis and P. borealis, respectively, which is higher than that observed in insects (Crozier and Crozier, 1993; Lessinger et al., 2000; Oliveira et al., 2008).
Similar to the mitochondrial genome of other caridean species, the rrnL and rrnS were situated between tRNALeu (UAG) and the control region, separated by tRNAVal. In H. ensifer and B. brevis, C. crassicornis and P. borealis, the rrnL and rrnS are 2 172 bp, 2 170 bp, 2 171 bp and 2 105 bp, respectively, with the AT content of 69.94%, 69.12%, 71.03%, and 69.55% (Table 1), slightly higher than the overall content.
3.3 Transfer RNA genes and anticodonsThe complete set of 22 transfer RNA (tRNA) genes typical of metazoan mitogenomes was present in H. ensifer and B. brevis. They ranged in size from 64 bp to 72 bp in H. ensifer, and from 65 bp to 72 bp in B. brevis. Most of the tRNA sequences can fold into canonical clover-leaf secondary structures except tRNASer(UCU), whose paired "DHU" arm were missing, simplifing down to a loop (Supplementary Figs.S2– S3). The lacks of DHU-arm in tRNASer(UCU) is a common feature in metazoan mitogenomes (Wolstenholme, 1992). It can also work in a similar way as usual tRNAs, after the processe of posttranscriptional RNA editing (Ohtsuki et al., 2002; Masta and Boore, 2004; Chimnaronk et al., 2005).

|
| Fig.2 Structural organization of the mitochondrial control region of P. borealis, C. crassicornis, H. ensifer and B. brevis (a); alignment of the conserved sequence blocks identified in the mitochondrial control region of the four Pandalidae species (b) The green boxes with roman numerals indicate tandem repeat units. The CSB boxes indicate the conserved sequence blocks, and the dull red parts indicate the GA-blocks. The blue boxes indicate the [TA(A)]n-blocks. |
In vertebrate mitogenomes, the most used codon (optimal codon) in a degenerate codon family usually perfectly matches their tRNA anticodon. This phenomenon is called codon-anticodon adaptation, and is also known as optimal codon usage (Bulmer, 1987). Unlike the vertebrate mitochondrial genomes, the adaptation between codon and anticodon was not found in Pandalidae mitogenomes (Supplementary Table S3). The codon-anticodon adaptation in the mitogenomes may be disrupted by the A+T mutation pressures. This result was not consistent with the hypothesis in the vertebrate mitogenome that anticodon evolution is driven by codon composition (Xia, 2005).
3.4 Non-coding regionsExcept the coding regions, the mitogenomes also features 12 non-coding regions for H. ensifer and 11 non-coding regions for B. brevis, with a total of 1 185 and 1 126 non-coding bases, respectively. Although these non-coding sequences account for only 7.4% and 7.1% of the whole mitochondrial genomes, they have higher AT content than that observed in any other region, reaching 77.97% and 75.84%, respectively (Table 1).
The control region (CR) consists of 1 075 and 1 021 bp in H. ensifer and B. brevis, respectively, which located between rrnS and trnI genes. Both in H. ensifer and B. brevis, as well as in the two other Pandalidae, it exhibits the highest A+T content. In H. ensifer, B. brevis and C. crassicornis, the CRs contained tandem repeat sequences (position 13 868– 14 036 for C. crassicornis, 13 561–13 670 for H. ensifer, position 13 568–13 616 for B. brevis), which were 169, 110, and 61 bp in length, all comprising two tandem repeat units, respectively (Fig. 2a). In addition, some other peculiar patterns, such as GA-block and [TA(A)]n-blocks were also identified within this region, although these elements were not located at the same position as they were found in other crustaceans (Kuhn et al., 2008; Liu and Cui, 2010). The alignment of the four Pandalidae control regions reveals a conserved sequence block (CSB) (104 bp in length, average GC%=29.47% and 69.23% similarity) (Fig. 2b). CSBs have been identified in the control region of various metazoans and are generally thought to play a role in the replication mechanism (Walberg and Clayton, 1981; Lee and Kocher, 1995; Zhang and Hewitt, 1997). However, this is only speculative. Studies that are more comprehensive would be required to identify precisely replication origins.
3.5 Phylogenetic analysesIt has been recommended that mitogenome contains enough genetic variation for resolving systematic relationships among higher taxa of decapod crustaceans (Lin et al., 2012; Shen et al., 2013). In the present study, the family Pandalidae is recovered to be monophyletic (Fig. 3). This result was not consistent with that of Liao et al. (2019), which state that Pandalidae is paraphyletic with the monophyletic family Thalassocarididae nested within. Pandalidae has a closest relationship with the group of Palaemonidae + Alpheidae, and Alvinocarididae was sister to the ((Palaemonidae + Atyidae) + Pandalidae) clade. Then Atyidae and ((Palaemonidae + Alpheidae) + Pandalidae) + Alvinocarididae clustered together. The Rhynchocinetidae and Crangonidae (with only one species each) were basally placed in the trees in all analyses. The result is in conflict with the results of Liao et al. (2019), where they find Pandalidae being sister to (Crangonidae, Glyphocrangonidae). Also our result did not support the previous finding revealed by five nuclear genes (18S, Enolase, H3, NaK, PEPCK) (Li et al., 2011), which suggested that the families Hippolytidae, Palaemonidae, Alpheidae, Crangonidae and Pandalidae clustered in one clade, while Oplophoridae, Nematocarcinidae, Rhynchocinetidae and Alvinocarididae clustered in another clade, and the Atyidae has been considered as basal lineage within the Caridea. The inconsistent results may due to the heterogeneity of data and different numbers of samples.

|
| Fig.3 Phylogenetic trees derived from Maximum Likelihood (ML) and Bayesian analyses The first number at each node is the Bayesian posterior probability and the second one is bootstrap probability of ML analyses. Solid circles indicate the two ML bootstrap values being 100, and Bayesian Posterior Probabilities being 1.00. The green, orange and blue represent the different habitat. |
This study characterized the complete mitogenome of two deep-sea pandalid shrimps, Heterocarpus ensifer and Bitias brevis, which were circular molecules and encoded 37 typical mitochondrial genes. The study provided the following conclusions about deep-sea pandalid shrimps: (1) the gene contents and arrangements of pandalid species are consistent with the pancrustacean ground pattern; (2) the mitochondrial control regions of Pandalidae species are characterized by the different position of structural elements, e.g., tandem repeat sequence, GA-block and [TA(A)]n-blocks compared with other reported crustaceans. The Pandalidae CRs contained a conserved sequence block, which may play a role in the replication mechanism; (3) phylogenetic analysis supported that the deep-sea pandalid shrimps are situated an intermediate lineage, with a tendency to originated from those living in shallow sea area.
5 DATA AVAILABILITY STATEMENTThe authors declare that all data supporting the findings of this study are available within the appendix sections.
6 ACKNOWLEDGMENTThe samples were collected by R/V Kexue.
Aznar-Cormano L, Brisset J, Chan T Y, Corbari L, Puillandre N, Utge J, Zbinden M, Zuccon D, Samadi S. 2015. An improved taxonomic sampling is a necessary but not sufficient condition for resolving inter-families relationships in Caridean decapods. Genetica, 143(2): 195-205.
|
Benson G. 1999. Tandem repeats finder:a program to analyze DNA sequences. Nucleic Acids Research, 27(2): 573-580.
DOI:10.1093/nar/27.2.573 |
Boore J L, Brown W M. 1998. Big trees from little genomes:mitochondrial gene order as a phylogenetic tool. Current Opinion in Genetics & Development, 8(6): 668-674.
|
Boore J L, Medina M, Rosenberg L A. 2004. Complete sequences of the highly rearranged molluscan mitochondrial genomes of the Scaphopod Graptacme eborea and the Bivalve Mytilus edulis. Molecular Biology and Evolution, 21(8): 1492-1503.
DOI:10.1093/molbev/msh090 |
Boore J L. 1999. Animal mitochondrial genomes. Nucleic Acids Research, 27(8): 1767-1780.
DOI:10.1093/nar/27.8.1767 |
Bracken H D, De Grave S A M M Y, Felder D L. 2009.Phylogeny of the infraorder Caridea based on mitochondrial and nuclear genes (Crustacea: Decapoda).In: Martin J W, Crandall K A, Felder D L eds. Decapod Crustacean Phylogenetics. CRC Press, Boca Raton. p.1-305.
|
Bulmer M. 1987. Coevolution of codon usage and transfer RNA abundance. Nature, 325(6106): 728-730.
DOI:10.1038/325728a0 |
Cameron S L, Johnson K P, Whiting M F. 2007. The mitochondrial genome of the screamer louse Bothriometopus (Phthiraptera:Ischnocera):effects of extensive gene rearrangements on the evolution of the genome. Journal of Molecular Evolution, 65(6): 589-604.
|
Castresana J. 2000. Selection of conserved blocks from multiple alignments for their use in phylogenetic analysis. Molecular Biology and Evolution, 17(4): 540-552.
|
Chai H N, Du Y Z, Zhai B P. 2012. Characterization of the complete mitochondrial genomes of Cnaphalocrocis medinalis and Chilo suppressalis (Lepidoptera:Pyralidae). International Journal of Biological Sciences, 8(4): 561-579.
DOI:10.7150/ijbs.3540 |
Chimnaronk S, Gravers Jeppesen M, Suzuki T, Nyborg J, Watanabe K. 2005. Dual-mode recognition of noncanonical tRNAs(Ser) by seryl-tRNA synthetase in mammalian mitochondria. European Molecular Biology Organization Journal, 24(19): 3369-3379.
DOI:10.1038/sj.emboj.7600811 |
Crozier R H, Crozier Y C. 1993. The mitochondrial genome of the honeybee Apis mellifera:complete sequence and genome organization. Genetics, 133(1): 97-117.
|
Curole J P, Kocher T D. 1999. Mitogenomics:digging deeper with complete mitochondrial genomes. Trends in Ecology & Evolution, 14(10): 394-398.
|
De Grave S, Fransen C H J M. 2011. Carideorum Catalogus:the recent species of the dendrobranchiate, stenopodidean, procarididean and caridean shrimps (Crustacea:Decapoda). Zoologische Mededelingen, 85: 195-589.
|
De Grave S, Pentcheff N D, Ahyong S T, Chan T Y, Crandall K A, Dworschak P C, Felder D L, Feldmann R M, Fransen C H J M, Goulding L Y D, Lemaitre R, Low M E Y, Martin J W, Ng P K L, Schweitzer C E, Tan S H, Tshudy D, Wetzer R. 2009. A classification of living and fossil genera of decapod crustaceans. Raffles Bulletin of Zoology, (S21): 1-109.
|
Drummond A J, Rambaut A. 2007. BEAST:Bayesian evolutionary analysis by sampling trees. BMC Evolutionary Biology, 7(1): 214.
|
Gage J D, Tyler P D. 1991. Deep-sea Biology:A Natural History of Organisms at the Deep-Sea Floor. Cambridge University Press, Cambridge, UK.
|
Gissi C, Iannelli F, Pesole G. 2008. Evolution of the mitochondrial genome of Metazoa as exemplified by comparison of congeneric species. Heredity, 101(4): 301-320.
DOI:10.1038/hdy.2008.62 |
Hao J S, Sun Q Q, Zhao H B, Sun X Y, Gai Y H, Yang Q. 2012.The complete mitochondrial genome of Ctenoptilum vasava (Lepidoptera: Hesperiidae: Pyrginae) and its phylogenetic implication. Comparative and Functional Genomics, 2012: 328 049.
|
Hebert P D N, Cywinska A, Ball S L, deWaard J R. 2003. Biological identifications through DNA barcodes. Proceedings of the Royal Society B Biological Sciences, 270(1512): 313-321.
|
Katoh K, Kuma K, Toh H, Miyata T. 2005. MAFFT version 5:improvement in accuracy of multiple sequence alignment. Nucleic Acids Research, 33(2): 511-518.
DOI:10.1093/nar/gki198 |
Kim M I, Baek J Y, Kim M J, Jeong H C, Kim K G, Bae C H, Han Y S, Jin B R, Kim I. 2009. Complete nucleotide sequence and organization of the mitogenome of the redspotted apollo butterfly, Parnassius bremeri (Lepidoptera:Papilionidae) and comparison with other lepidopteran insects. Molecules and Cells, 28(4): 347-363.
DOI:10.1007/s10059-009-0129-5 |
Kuhn K, Streit B, Schwenk K. 2008. Conservation of structural elements in the mitochondrial control region of Daphnia. Gene, 420(2): 107-112.
|
Lanfear R, Calcott B, Ho S Y W, Guindon S. 2012. PartitionFinder:combined selection of partitioning schemes and substitution models for phylogenetic analyses. Molecular Biology and Evolution, 29(6): 1695-1701.
DOI:10.1093/molbev/mss020 |
Laslett D, Canbäck B. 2008. ARWEN:a program to detect tRNA genes in metazoan mitochondrial nucleotide sequences. Bioinformatics, 24(2): 172-175.
|
Lavrov D V, Boore J L, Brown W M. 2000. The complete mitochondrial DNA sequence of the horseshoe crab Limulus polyphemus. Molecular Biology and Evolution, 17(5): 813-824.
|
Lee W J, Kocher T D. 1995. Complete sequence of a sea lamprey (Petromyzon marinus) mitochondrial genome:early establishment of the vertebrate genome organization. Genetics, 139(2): 873.
|
Lessinger A C, Junqueira A C M, Lemos T A, Kemper E L, da Silva F R, Vettore A L, Arruda P, Azeredo-Espin A M L. 2000. The mitochondrial genome of the primary screwworm fly Cochliomyia hominivorax (Diptera:Calliphoridae). Insect Molecular Biology, 9(5): 521-529.
DOI:10.1046/j.1365-2583.2000.00215.x |
Li C P, De Grave S, Chan T Y, Lei H C, Chu K H. 2011. Molecular systematics of caridean shrimps based on five nuclear genes:implications for superfamily classification. Zoologischer Anzeiger-A Journal of Comparative Zoology, 250(4): 270-279.
DOI:10.1016/j.jcz.2011.04.003 |
Li R Q, Zhu H M, Ruan J, Qian W B, Fang X D, Shi Z B, Li Y R, Li S T, Shan G, Kristiansen K, Li S G, Yang H M, Wang J, Wang J. 2010. De novo assembly of human genomes with massively parallel short read sequencing. Genome Research, 20(2): 265-272.
|
Liao Y S, De Grave S, Ho T W, Ip B H Y, Tsang L M, Chan T Y, Chu K H. 2017. Molecular phylogeny of Pasiphaeidae(Crustacea, Decapoda, Caridea) reveals systematic incongruence of the current classification. Molecular Phylogenetics and Evolution, 115: 171-180.
DOI:10.1016/j.ympev.2017.07.021 |
Liao Y S, Ma K Y, De Grave S, Komai T, Chan T Y, Chu K H. 2019. Systematic analysis of the caridean shrimp superfamily Pandaloidea (Crustacea:Decapoda) based on molecular and morphological evidence. Molecular Phylogenetics and Evolution, 134: 200-210.
DOI:10.1016/j.ympev.2019.02.006 |
Lin F J, Yuan L, Sha Z L, Tsang L M, Chu K H, Chan T Y, Liu R Y, Cui Z X. 2012. Evolution and phylogeny of the mud shrimps (Crustacea:Decapoda) revealed from complete mitochondrial genomes. BMC Genomics, 13: 631.
|
Liu Y, Cui Z. 2010. Complete mitochondrial genome of the Asian paddle crab Charybdis japonica (Crustacea:Decapoda:Portunidae):gene rearrangement of the marine brachyurans and phylogenetic considerations of the decapods. Molecular Biology Reports, 37(5): 2559-2569.
DOI:10.1007/s11033-009-9773-2 |
Liu Z K, Gao P, Ashraf M A, Wen J B. 2016. The complete mitochondrial genomes of two weevils, Eucryptorrhynchus chinensis and E.brandti:conserved genome arrangement in Curculionidae and deficiency of tRNA-Ile gene. Open Life Sciences, 11(1): 458-469.
|
Masta S E, Boore J L. 2004. The complete mitochondrial genome sequence of the spider Habronattus oregonensis reveals rearranged and extremely truncated tRNAs. Molecular Biology and Evolution, 21(5): 893-902.
DOI:10.1093/molbev/msh096 |
Mindell D P, Sorenson M D, Dimcheff D E. 1998. Multiple independent origins of mitochondrial gene order in birds. Proceedings of the National Academy of Sciences of the United States of America, 95(18): 10693-10697.
DOI:10.1073/pnas.95.18.10693 |
Moritz C, Brown W M. 1987. Tandem duplications in animal mitochondrial DNAs:variation in incidence and gene content among lizards. Proceedings of the National Academy of Sciences of the United States of America, 84(20): 7183-7187.
DOI:10.1073/pnas.84.20.7183 |
Mueller R L, Boore J L. 2005. Molecular mechanisms of extensive mitochondrial gene rearrangement in plethodontid salamanders. Molecular Biology and Evolution, 22(10): 2104-2112.
DOI:10.1093/molbev/msi204 |
Ohtsuki T, Kawai G, Watanabe K. 2002. The minimal tRNA:unique structure of Ascaris suum mitochondrial tRNASer UCU having a short T arm and lacking the entire D arm. FEBS Letters, 514(1): 37-43.
DOI:10.1016/S0014-5793(02)02328-1 |
Ojala D, Montoya J, Attardi G. 1981. tRNA punctuation model of RNA processing in human mitochondria. Nature, 290(5806): 470-474.
|
Oliveira M T, Barau J G, Junqueira A C M, Feijão P C, da Rosa A C, Abreu C F, Azeredo-Espin A M L, Lessinger A C. 2008. Structure and evolution of the mitochondrial genomes of Haematobia irritans and Stomoxys calcitrans: the Muscidae (Diptera: Calyptratae) perspective.Molecular Phylogenetics and Evolution, 48(3): 850-857.
|
Perna N T, Kocher T D. 1995. Patterns of nucleotide composition at fourfold degenerate sites of animal mitochondrial genomes. Journal of Molecular Evolution, 41(3): 353-358.
DOI:10.1007/BF01215182 |
Ronquist F, Teslenko M, van der Mark P, Ayres D L, Darling A, Höhna S, Larget B, Liu L, Suchard M A, Huelsenbeck J P. 2012. MrBayes 3.2:efficient Bayesian phylogenetic inference and model choice across a large model space. Systematic Biology, 61(3): 539-542.
|
Salvato P, Simonato M, Battisti A, Negrisolo E. 2008. The complete mitochondrial genome of the bag-shelter moth Ochrogaster lunifer (Lepidoptera, Notodontidae). BMC Genomics, 9(1): 331.
DOI:10.1186/1471-2164-9-331 |
Satoh T P, Sato Y, Masuyama N, Miya M, Nishida M. 2010. Transfer RNA gene arrangement and codon usage in vertebrate mitochondrial genomes:a new insight into gene order conservation. BMC Genomics, 11(1): 479.
DOI:10.1186/1471-2164-11-479 |
Serb J M, Lydeard C. 2003. Complete mtDNA sequence of the North American freshwater mussel, Lampsilis ornata(Unionidae):an examination of the evolution and phylogenetic utility of mitochondrial genome organization in Bivalvia (Mollusca). Molecular Biology and Evolution, 20(11): 1854-1866.
DOI:10.1093/molbev/msg218 |
Shen H, Braband A, Scholtz G. 2013. Mitogenomic analysis of decapod crustacean phylogeny corroborates traditional views on their relationships. Molecular Phylogenetics and Evolution, 66(3): 776-789.
DOI:10.1016/j.ympev.2012.11.002 |
Simon C, Buckley T R, Frati F, Stewart J B, Beckenbach A T. 2006. Incorporating molecular evolution into phylogenetic analysis, and a new compilation of conserved polymerase chain reaction primers for animal mitochondrial DNA. Annual Review of Ecology Evolution and Systematics, 37(1): 545-579.
DOI:10.1146/annurev.ecolsys.37.091305.110018 |
Stokkan M, Jurado-Rivera J A, Juan C, Jaume D, Pons J. 2016. Mitochondrial genome rearrangements at low taxonomic levels:three distinct mitogenome gene orders in the genus Pseudoniphargus (Crustacea:Amphipoda). Mitochondrial DNA Part A, 27(5): 3579-3589.
DOI:10.3109/19401736.2015.1079821 |
Stothard P, Wishart D S. 2005. Circular genome visualization and exploration using CGView. Bioinformatics, 21(4): 537-539.
DOI:10.1093/bioinformatics/bti054 |
Sun S E, Hui M, Wang M X, Sha Z L. 2018. The complete mitochondrial genome of the alvinocaridid shrimp Shinkaicaris leurokolos (Decapoda, Caridea):insight into the mitochondrial genetic basis of deep-sea hydrothermal vent adaptation in the shrimp. Comparative Biochemistry and Physiology Part D:Genomics Proteomics, 25: 42-52.
|
Sun Z, Wan D G, Murphy R W, Ma L, Zhang S H, Huang D V. 2009. Comparison of base composition and codon usage in insect mitochondrial genomes. Genes and Genomics, 31(1): 65-71.
DOI:10.1007/BF03191139 |
Talavera G, Castresana J. 2007. Improvement of phylogenies after removing divergent and ambiguously aligned blocks from protein sequence alignments. Systematic Biology, 56(4): 564-577.
DOI:10.1080/10635150701472164 |
Tamura K, Peterson D, Peterson N, Stecher G, Nei M, Kumar S. 2011. MEGA5:molecular evolutionary genetics analysis using maximum likelihood, evolutionary distance, and maximum parsimony methods. Molecular Biology and Evolution, 28(10): 2731-2739.
DOI:10.1093/molbev/msr121 |
Trifinopoulos J, Nguyen L T, von Haeseler A, Minh B Q. 2016. W-IQ-TREE:a fast online phylogenetic tool for maximum likelihood analysis. Nucleic Acids Research, 44(W1): W232-W235.
|
Walberg M W, Clayton D A. 1981. Sequence and properties of the human KB cell and mouse L cell D-loop regions of mitochondrial DNA. Nucleic Acids Research, 9(20): 5411-5421.
DOI:10.1093/nar/9.20.5411 |
Wolstenholme D R. 1992. Genetic novelties in mitochondrial genomes of multicellular animals. Current Opinion in Genetics and Development, 2(6): 918-925.
DOI:10.1016/S0959-437X(05)80116-9 |
Wyman S K, Jansen R K, Boore J L. 2004. Automatic annotation of organellar genomes with DOGMA. Bioinformatics, 20(17): 3252-3255.
DOI:10.1093/bioinformatics/bth352 |
Xia X H. 2005. Mutation and selection on the anticodon of tRNA genes in vertebrate mitochondrial genomes. Gene, 345(1): 13-20.
DOI:10.1016/j.gene.2004.11.019 |
Xia X, Lemey P. 2009. Assessing substitution saturation with DAMBE. In: Lemey, Philippe, Salemi, Marco, Vandamme, Anne-Mieke (Eds.), The Phylogenetic Handbook: A Practical Approach to DNA and Protein Phylogeny, 2nd edition. Cambridge University Press. p.615-630.
|
Xia X, Xie Z, Salemi M, Chen L, Wang Y. 2003. An index of substitution saturation and its application. Molecular Phylogenetics and Evolution, 26(1): 1-7.
|
Yang J, Ye F, Huang Y. 2016. Mitochondrial genomes of four katydids (Orthoptera:Phaneropteridae):New gene rearrangements and their phylogenetic implications. Gene, 575: 702-711.
DOI:10.1016/j.gene.2015.09.052 |
Yuan Y, Li Q, Yu H, Kong L F. 2012. The complete mitochondrial genomes of six heterodont bivalves(Tellinoidea and Solenoidea):Variable gene arrangements and phylogenetic implications. PLoS One, 7(2): e32353.
DOI:10.1371/journal.pone.0032353 |
Zhang D X, Hewitt G M. 1997. Insect mitochondrial control region:A review of its structure, evolution and usefulness in evolutionary studies. Biochemical Systematics and Ecology, 25(2): 99-120.
|
Zuker M. 2003. Mfold web server for nucleic acid folding and hybridization prediction. Nucleic Acids Research, 31(13): 3406-3415.
|