 2020, Vol. 38
Institute of Oceanology, Chinese Academy of Sciences
Article Information
- WANG Jianfeng, YU Fei, REN Qiang, WEI Chuanjie
- Spatial and temporal variability of turbulent mixing in the near-field of the Changjiang River
- Journal of Oceanology and Limnology, 38(4): 1138-1152
- http://dx.doi.org/10.1007/s00343-020-0008-7
Article History
- Received Jan. 7, 2020
- accepted in principle Mar. 1, 2020
- accepted for publication Apr. 9, 2020


2 Center for Ocean Mega-Science, Chinese Academy of Sciences, Qingdao 266071, China;
3 Pilot National Laboratory for Marine Science and Technology (Qingdao), Qingdao 266237, China;
4 University of Chinese Academy of Sciences, Beijing 100049, China
A river plume is a complex system that is influenced by river discharge, tides, circulation, wind, complex bathymetry, and presence of artificial structures (Pu et al., 2016). Horner-Devine et al. (2009) proposed four dynamic regimes: the source (i.e., estuary), near-field plume, recirculating plume, and far-field plume. In this study, we focused on the mixing in the near-field plume. The near-field region is the jet-like area of initial plume expansion where the momentum of the plume layer dominates its buoyancy, and results in intense mixing (Horner-Devine et al., 2015). Compared to estuaries, characteristics of near-field plume are three-dimensional because river plume is not constrained to river channels. The near-field river plume can be characterized by supercritical Froude numbers, intense mixing, and rapid water mass modification (Stacey et al., 2011). The turbulence in the near-field plume is closely linked to plume spreading (e.g., Chen et al., 2009; MacDonald and Chen, 2012) because it functions as the source of energy and matter for the far-field region (Fong and Geyer, 2001; Lentz, 2004; Horner-Devine et al., 2009).
The Changjiang (Yangtze) River discharges a substantial amount of fresh water (9.24×10¹¹ m3/a, Shen et al., 2003), dissolved inorganic nitrogen (6.1×10¹⁰ mol/a, Liu et al., 2003), and dissolved organic carbon (1.18×10⁷ t/a, Dagg et al., 2004) into the Yellow and East China Seas (Fig. 1). These discharges have caused an increase in eutrophication and harmful algal blooms, as well as hypoxia events (Shen et al., 2011; Kang et al., 2016; Kong et al., 2016). The temporal and spatial variations of these detrimental events are correlated to the mixing and spreading of the Changjiang River plume (i.e. Rabouille et al., 2008; Zhang et al., 2019).

|
| Fig.1 Distribution of stations at Changjiang River cruise Conductivity, temperature, and depth sensor casts were taken at stations marked with black solid dots; the 25-h microstructure and shipboard Acoustic Doppler Current Profilers (ADCP) in October and November 2014 measurements were taken at the station marked with a black star; isobaths are shown in the figure as black solid lines. |
The discharge of the Changjiang River has a distinct seasonal variation that ranges from 1×10⁴ to 6×10⁴ m3/s (Zhu et al., 2001), depending on the year and the season. The Changjiang estuary is a mesotidal estuary with a tidal range between 4 m and 5 m during the spring tide and 2 m during the neap tide (Zhu et al., 2015). Currents off the Changjiang River include the north intrusion of the bottom Taiwan Warm Current inshore branch (Wang et al., 2019) and the Yellow Sea Coastal Currents along the Jiangsu Province (Xuan et al., 2016).
Mixing and stratification of the Changjiang River plume are rather complicated. The combination of discharge variability and tidal currents cause changes in mixing intensities over time at the same location (Shen and Zhang, 1992; Ding et al., 2018). Additionally, tidal forcing enhances vertical mixing in the near-field plume, which can affect the exchange of water masses in river plumes (Wang et al., 2015).
Early works studied the spreading of the Changjiang River far-field plume (Beardsley et al., 1985; Bang and Lie, 1999; Chang and Isobe, 2003; Chen et al., 2008; Shi and Lu, 2011; Rong and Li, 2012; Wu et al., 2014; Ge et al., 2015; Zhu et al., 2015; Yuan et al., 2016). The far-field plume is usually called Changjiang Diluted Water (CDW) and has a salinity less than 31; the near-field Changjiang plume has a salinity less than 26 (Mao et al., 1963), which is consistent with the definition of near-field plume conditions (Hetland, 2005). As compared to the substantial research on spreading in the Changjiang River far-field plume, fewer observation studies focus on the mixing process in the Changjiang near-field plume. Numerical models are used to study mixing in the Changjiang River plume as an alternative, since there is a high cost for direct observation. The mixing between CDW and surrounding water was first studied by Mao et al. (1963). They defined the near-field (salinity less than 26) and far-field plumes (salinity higher than 32) in the Changjiang River. Furthermore, vertical and lateral diffusions have been estimated using a simplified turbulent diffusion equation. Shen and Zhang (1992) determined that the main mechanisms that control the mixing of salt water and fresh water in the Changjiang estuary are the bottom shearing turbulent diffusion caused by flood current and the advection during ebb current. Using numerical experiments, Wu et al. (2011) proposed that tidal forcing increased the vertical mixing, resulting in a strong horizontal salinity gradient at the northern side of the mouth of the Changjiang River along the Jiangsu coast. An additional three-dimensional hydrodynamic model, the Coupled Hydrodynamical-Ecological Model for Regional and Shelf Seas (COHERENS), was employed by Shi and Lu (2011) to understand mixing, stratification, and circulation in the Changjiang River plume. However, numerical models cannot accurately estimate mixing near estuaries owing to complicated bathymetry and physical environments. More observations are needed to quantify turbulent mixing in the near-field plume of the Changjiang River.
In addition to numerical studies, other studies have been performed to characterize mixing in the Changjiang River plume using the gradient Richardson number and the Froude number. The gradient Richardson number, 

Early studies were mainly based on parameter estimates that controlled stratification, such as Rig and F1, because of a lack of direct microstructure observations in the Changjiang River plume. Mao et al. (1993) defined the front of the Changjiang River plume by calculating F1, and proposed that the front induced strong mixing in the river plume. Shen and Zhang (1992) calculated the stratification coefficient (buoyancy frequency, 
A number of studies have directly measured the turbulence structure in other river plumes. Wright and Coleman (1971), who measured the currents and density structure of the flow out of South Pass, which is one of the Mississippi River Delta Head of Passes, first described the characteristic features of the supercritical outflow region. Stacey et al. (1999) used an Acoustic Doppler Current Profiler (ADCP) variance method to investigate the evolution of turbulence in the partially mixed San Francisco Bay. MacDonald and Geyer (2004) proposed control volume approaches to quantify indirectly the turbulence in the Fraser River. Nash et al. (2009) studied the estuary Richardson number, RiE (Fischer, 1972), using downward looking ADCP in the Columbia River, which suggested that turbulent mixing can be predicted through RiE.
Modern numerical models do not adequately resolve processes within the supercritical near-field plume. Because the water leaving the river mouth may be modified tremendously within the near-field, both numerical and analytical predictions of far-field plume structure could be inaccurate if they are based directly on estuary outflow properties. However, only rare examples can be found in the Changjiang River plume. Recently, Matsuno et al. (2006) presented the results of microstructure measurements of the turbulent kinetic energy (TKE) dissipation rate (ε) in the far-field Changjiang River plume. It is difficult to find work that studies turbulent mixing in the near-fi eld Changjiang River plume, although it is important to understand this behavior. For that reason, observation of the turbulent energy dissipation rate (ε) in the near-field plume of the Changjiang River is required. We have obtained high quality microstructure data that can be used to study the distribution and variation of TKE dissipation. This paper presents the quantitative results of the observed TKE dissipation rate in the near-field plume and discusses its variation with tide.
Our paper is organized as follows: first, we describe our fieldwork measurements and methods (Section 2); we then describe the variation of TKE dissipation rate in a tidal cycle (Section 3). In Section 4, we discuss the potential mechanism that affects the TKE dissipation rate. Conclusions are presented in Section 5.
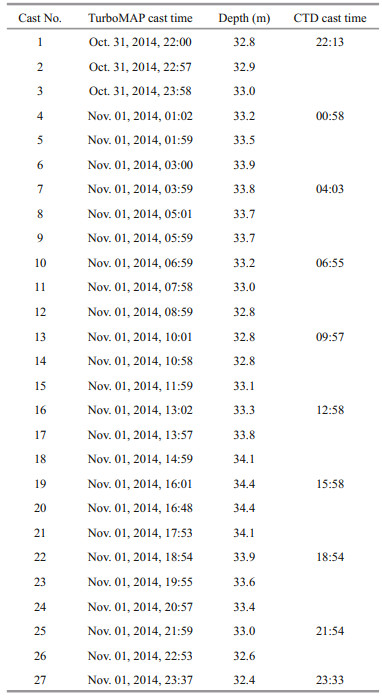
2 MATERIAL AND METHOD 2.1 MeasurementTo measure TKE dissipation in the near-field Changjiang River plume, we used the newly developed Turbulence Ocean Microstructure Acquisition Profiler (TurboMAP). TurboMAP is a quasi-free-falling vertical profiler that measures hydrographic parameters (conductivity, temperature, and pressure) and turbulent parameters (∂u/∂z, where u and z are the turbulent velocity fluctuations and depth, respectively). The turbulent velocity fluctuations are measured using two standard shear probes, which are cross-installed. All sensors are set onto a parabolically shaped cap at the head of the instrument to ensure the sensors are undisturbed during deployment. TurboMAP descended freely with a sinking velocity of approximately 0.5 m/s. A 5-mm diameter data transmission line covered with Kevlar rope was used to send the data to a PC onboard the research vessel and bring the instrument back to the surface after each downcast measurement. The TurboMAP equipment is described in detail by Wolk et al. (2002). The turbulent sensors sampled at a rate of 512 Hz.
Observations used in this study included microstructure data measured by TurboMAP, hydrographic data measured by conductivity temperature depth (CTD) sensors, and current data measured by ADCP. We took observations at station A, which is located off the mouth of the Changjiang River (31.00°N, 122.83°E, Fig. 1 station A). There are two crossed shear probes on TurboMAP, resulting in two profiles for each deployment. Measurements using TurboMAP were repeated twice every hour, yielding 52 downcasts for a diurnal observation from October 31, 2014 to November 1, 2014. The other four TurboMAP casts were taken on June 9, 2014 at stations CJ1a, CJ2, CJ2a, and CJ3, respectively. Analysis of the microstructure data and estimation of ε followed the procedures described by Wolk et al. (2002). CTD casts were conducted every 3 h following the measurement of TurboMAP (Table 1).
During the observation period, the downward looking bottom track ADCP (RDI-workhorse: 300 kHz) was mounted on the bottom of the vessel to obtain the background structure of the current and the fine-scale velocity shear with 2 m vertical bins. The blank area of ADCP is 3.1 m using this set up. For this reason, the first available layer of current in this study represented data at 5.1 m below the sea surface. The horizontal velocity was sampled every 2 s and the temporal mean for every minute was used to produce the dataset of the current velocity.
To study the structure of the Changjian River plume, CTD sensors (shown in Fig. 1) were cast along 31°N outside the mouth of the Changjiang River (CJ section), from 122.5°E to 126°E with a spatial interval of 0.5°. The depth changes from 17 m to 69 m in this crosssection. The stations locations are listed in Table 2.
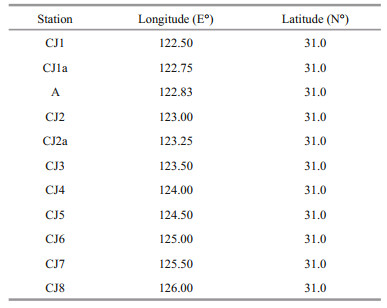
The rate of dissipation of kinetic energy in isotropic turbulence is defined as follows (Wolk et al., 2002):
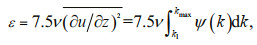
where ν is the kinematic molecular viscosity taken constant at 10-6 m2/s and the over line indicates the spatial average. ∂u/∂z represents either one of the two horizontal components of shear. The shear variance was calculated by integrating the spectrum of the shear signal ψ(k), where k is the vertical wavenumber and ψ(k) is the spectrum of the vertical shear (Osborn, 1980). The lower integration limit, k1, is set to 1 cpm, and the upper limit, kmax, is variable following Shang et al. (2017). The shear spectrum ψ(k) is computed from the shear signal with half-overlapping 2-m depth segments, so the vertical resolution of ε is 1 m.
An estimation of the turbulent diffusivity in the river plume is necessary to determine the role of the river plume in the environment of the East China Sea. Measurements of dissipation rate were performed to estimate the magnitude of the turbulent diffusivity between the river plume and the ambient water. Dissipation rate ε refers to the energy dissipation, and diffusivity Kz refers to the mixing of mass. In a river plume, the turbulent diffusivity Kz is estimated using the squared buoyancy frequency N2 and the observed dissipation ε, following Kz=γε/N2 (Osborn, 1980) with the assumption that γ=0.2. N was calculated using the density gradient obtained from low-resolution CTD sensors mounted on the TurboMAP (Wolk et al., 2002).
Measurements of the microstructure velocity shear are susceptible to vibrations of the instrument and tethered rope. Furthermore, the vertical profile of the dissipation rate itself may have large variability over short time periods. Therefore, we repeated the deployments of the instruments twice for each cast. Several minutes were required for a single deployment and recovery. Therefore, the time difference between each pair of profiles was within 10 min. The two repeated profiles at each station generally showed similar shapes; the significant peaks of ε mostly coincided between the two casts. For similar types of ε from two contiguous deployments, we took the mean value from two shear probes of two deployments as the representative ε profile. However, if the structures of ε were not similar to each other, we checked the spectrum of the shear and used the mean of those ε values with a spectrum matching Nasmyth's spectrum. There were seven out of 52 deployments that produced different structures of ε from different shear probes. Because we took repeated downcasts, the seven downcasts all had high quality results. Thus, reliable and high-quality data were obtained from all time points.
3 RESULT 3.1 Structure of the Changjiang River plumesThe TKE dissipation distribution in the river plume varies with position along the plume (MacDonald et al., 2007; McCabe et al., 2009; Nash et al., 2009). To study the distribution of TKE dissipation in the nearfield plume, we investigated the basic hydrological structure of the Changjiang River plume. Based on salinity distribution of the CJ section, station A was located in the near-field plume. As shown in Fig. 2, the halocline was nearly horizontal near the coast (CJ1 to CJ2), but sloping at the plume front (CJ2 to CJ3). The surface salinity changed rapidly from 22 to 29 between stations CJ1 and CJ2. The thickness of the near-field plume was relatively thin during the observation period. The isohaline showed a lift-off at station CJ2. A lift-off point occurs in a river plume with supercritical state and enhanced shear (Stacey et al., 2011). The lift-off point region is characterized by strong stratification and shear, resulting in rapid mixing of the discharging water and ambient ocean water (Wright and Coleman, 1971). Rapidly thinning and mixing fresh water lay above the saline ambient water in the near-field region. The thickness of the near-field plume changes with tidal phase and river discharge, and the front also shifts with changes in those environmental factors (Geyer and Ralston, 2011). River discharge during the observation period from the Datong gauging station was approximately 1.97×10⁴ m3/s. River discharge was relatively low as compared with higher discharge (6.0×10 m3/s) during flood season (Zhu et al., 2001), which indicated CJ2 station is always influenced by the near-field plume of the Changjiang River.

|
| Fig.2 Temporal variations in the vertical profiles of salinity measured during the Changjiang River cruise in October and November 2014 |
The salinity was less than 30 at station CJ2 and increased to 33 at CJ3, which indicated that the water mass below the Changjiang River plume was north of the intrusion of the TWC. The high salinity water at stations CJ7 to CJ8 represents the Yellow Sea Warm Current (Lie et al., 2015), which occurs in winter.
3.2 Measurement of the turbulent energyMixing in the Changjiang River plume influences the exchange of different water masses, making it important to study the intensity and variation of mixing in the Changjiang River plume. The turbulent energy dissipation rate ε measured by TurboMAP was calculated by integrating the small-scale shear spectrum. We normalized the observed shear power spectrum using the Kolmogorov scale, which is on an order of 10-3 m. This was compared with the empirical universal spectrum, which was measured by Nasmyth (1970), as shown in Fig. 3 (black solid line). The shape of the shear spectra was approximately fitted with the Nasmyth spectrum in most cases. The spectra in Fig. 3a1, b1, & d1 fit the Nasmyth spectrum for both shear probes (black solid line). However, the shape of the spectra of shear probe 2 (red line) in Fig. 3c1 was bent as compared with the Nasmyth spectrum in the low wave number range. The spectra of shear probe 1 in Fig. 3c1 fit the Nasmyth spectrum well, which is presumably caused by damping of shear probe sensitivity or from damage to the shear probes. The resulting ε is shown in Fig. 3a2, b2, c2, & d2. Considering that ocean turbulence is isotropic, the measured vertical structures of ε from different shear probes should be similar to each other in one deployment. The profile of ε was calculated using the mean ε of both shear probes from the repeated deployments for those with a well-defined spectrum, as shown in Fig. 3a2, b2, & d2. Since the spectra of shear probe 2 in Fig. 3c1 was bent, ε cannot be used. We used ε from shear probe 1 and then repeated deployment to represent the dissipation of this deployment. To achieve sufficient quality control, 26 profiles were gathered to study the tidal variation of the mixing in the near-field Changjiang River plume, and four profiles were collected to study the spatial variation.

|
| Fig.3 Examples of the shear spectrum (solid line) and calculated turbulent dissipation rate obtained with TurboMAP at 22:15 on October 31, 2014 (a1 and a2); 04:03 on November 1, 2014 (b1 and b2); 09:54 on November 1, 2014 (c1 and c2); and 16:49 on November 1, 2014 (d1 and d2) Blue and red solid lines represent data from shear probe 1 and shear probe 2, respectively; the black solid line represents the Nasmyth universal spectrum fitted to the observed spectra. |
The spatial distribution of ε within the Changjiang River plume was observed at the section along 31°N (Fig. 4). Station CJ1a was located within the near-field plume (on the shore side of station A) and stations CJ1a, CJ2, and CJ2a were located on the offshore side of station A. The upper layer ε at station CJ1a reached as large as 10-4 W/kg, which is similar to the values located at 6 m, 10 m, 9 m, and 12 m, for stations CJ1a, CJ2, CJ2a, and CJ3, respectively. The value of ε at the bottom of the mixing layer at station CJ1a was 10-7 W/ kg, and ε values were 10-8.1, 10-7.9, and 10-8.2 W/kg for stations CJ2, CJ2a, and CJ3, respectively. This indicates that the mixing became weak with the spreading of the plume. The dissipation rate increased to 10-6 W/kg with the increase of depth at stations CJ1a, CJ2, and CJ3, which may be caused by the intrusion of the TWC inshore branch from the bottom. The TWC layer at station CJ2 did not increase significantly because the cast was too shallow to measure the enhanced mixing by the TWC inshore branch.

|
| Fig.4 Vertical profiles of dissipation rates for the Changjiang River cruise in June 2014 at stations CJ1a, CJ2, CJ2a, and CJ3 Station A represents the 25-h microstructure station in October and November 2014. The dashed lines represent salinity contours. |
Salinity contour in Fig. 4 showed that station A is located in the near-field plume with salinity less than 26 (Mao et al., 1963; Hetland, 2005). The up layer dissipation rate ε in the near-field plume from our observation at CJ1a, CJ2 and CJ2a (Fig. 4) reached 10-4 W/kg, and decreased with distance from the river mouth; similar to what was observed by MacDonald et al. (2007). The observed up layer ε at CJ3 was 10-7 W/kg. The dissipation rate changed by three orders of magnitude from the near-field plume (CJ1a) to the far-field plume (CJ3). The vertical distribution of dissipation rates decreased to less than 10-8 W/kg below the river plume and increased to 10-6 W/kg at the layer where the TWC intruded at all the four stations (Fig. 4). The mixing of the Changjiang River plume is complex, and we aim to clarify the variation of mixing in the near-field plume.
3.3 Tidal variation of the turbulent energy dissipation rate εRiver plumes are influenced by the interactions of tides, wind, and freshwater discharge. Fresh water discharge is the fundamental forcing that distinguishes river plumes from other areas. Freshwater-saltwater interaction caused by freshwater input is the fundamental characteristic of river plumes. Barotropic pressure caused by tidal forcing produced oscillatory flow on semidiurnal, diurnal, and longer periods. Semidiurnal and diurnal tidal energies influence the tidal mixing during the flood-ebb and spring-neap cycles, which are the dominant sources of turbulent kinetic energy (Stacey et al., 2011). Wind stress is another important energy source of surface turbulent kinetic energy (Wang et al., 2015).
Hydrologic conditions in the near-field are significantly influenced by tidal phase and river discharge. The observation was carried out during the dry season in November with relatively low river discharge (19 700 m3/s). The daily discharge data showed that discharge increased by 1 300 m3/s during our observation. Wind speed was steady during the observation, and ranged from 4 m/s to 7.2 m/s (Fig. 5a). The observation period covered two tidal cycles with tidal ranges between 1.1 m and 2.0 m, as shown in Fig. 5a. The tidal heights presented in Fig. 5a were measured using an echo sounder installed on the bottom of the ship, and measurements were collected hourly.

|
| Fig.5 Time series of tidal height (a, black solid line), wind speed (a, red solid line), and salinity (b) at station A L and H represent low tide and high tide, respectively. |
Strong salinity variation was observed. The halocline rose and became thinner as the flood progressed. This suggests that during flood tide, local stratification associated with intrusion of the salt wedge dominated mixing at the interface. Fresh water was detected in the upper layer with salinity less than 26, which was considered the threshold of near-field water. The halocline stayed between 4 m and 8 m where most shear enhanced turbulence occurred in the river plume. The intensity of the halocline varied with tidal phase as shown in Fig. 5b. The halocline decayed with the flood tide at station A, because the flooding water forced the fresh water back to the river mouth. Station A was controlled by the ambient water at the bottom, and the halocline became weak. During the ebb tide, the Changjiang River discharged a significant amount of fresh water into the East China Sea, and the fresh water enhanced the halocline in the upper layer. A high salinity core occurred under the halocline during the flood tide. The observed salinity was greater than 32, indicating that the source of the high salinity water was the TWC (Wang et al., 2019).
With the start of the second ebb tide, the upper halocline intensified dramatically. The surface salinity was as low as 23, which was significantly less saline than during first ebb. The isohaline with salinity of 28 was deeper than the first tidal cycle. The enhanced halocline could be induced by stronger upstream river discharges, which can also result in intense shear turbulent mixing as showed in Fig. 6.

|
| Fig.6 Time series of vertical distribution of dissipation rate ε at station A from October 31, 2014 to November 1, 2014 The color bar is indicated with a log10 scale. L and H represent low tide and high tide, respectively. |
The asymmetry in salinity observed at station A shows characteristics associated with tidal asymmetry (Jay and Smith, 1990; Simpson et al., 1990). Interaction between tidal flow and river discharge intends to establish stratification during ebb tide and destroy it during flooding. Tidal straining and internal tidal asymmetry are widely accepted mechanisms for tidal asymmetry. Simpson et al. (1990) explained the internal structure of Liverpool Bay using tidal straining, and Jay and Musiak (1994) used internal asymmetry to explain the observed strong mean flow and internal tides in the Columbia. Similar concepts have been applied to rivers such as the Hudson (Geyer et al., 2000) and numerous other river plumes. Turbulence in a river plume is mainly produced by shear at the density interface at tidal frequencies, which may destabilize the stable stratification induced by the river discharge. This mixing varies on tidal timescales, due to the tidal forcing of the interfacial shear between plume and ambient water. The turbulence dissipation along this interface originates from the destabilization induced by velocity shear.
Observations of the TKE dissipation rate were conducted in the near-field plume to study the tidal variation of turbulent mixing in the Changjiang River plume over 25 h (two semidiurnal tidal cycles). TKE ε was clearly related to the tidal phase as shown in Fig. 6. Our plume observations proved the occurrence of tidal asymmetries in mixing, and we noted that dissipation rates were stronger during ebb tide than flood tide. This is a result of increased shear associated with the river flow and tidal current-induced shear, which is similar to that observed in the Fraser River (Geyer and Smith, 1987; Nash et al., 2009). The magnitude of dissipation rate ε was larger than 10-7 W/kg in the Changjiang River plume (Fig. 6). In addition, a strong dissipation rate ε was observed during ebb tide in the upper layer, which reached 10-4 W/kg. The variation is similar to observations in the Merrimack River plume (Wang et al., 2015) and Columbia River plume (Nash et al., 2009). Comparing this to the salinity plot (Fig. 5b), we found that strong dissipation coincided with fresh water input. When the halocline was weaker and shallower, the magnitude of ε was smaller. The dissipation rate decreased under the river plume, resulting in a value of ε less than 10-8 W/kg between 10 m and 14 m, which coincided with salinity distribution. Otherwise, the enhanced dissipation rate was observed during flood tides when a salt wedge intruded from the TWC layer bringing TWC water to the Changjiang River mouth. The intense dissipation rate can also reach 10-5 W/kg. Therefore, the vertical structure of ε was large in the surface and TWC layers, and less at the halocline in the near-field plume.
4 DISCUSSION 4.1 The observed stratification N2 and turbulent diffusivity KzIn river plumes, TKE is produced by variations in velocity, which is known as shear production. Part of the energy is transferred to the Kolmogrov scale at which molecular viscosity can effectively dissipate the energy. The rate at which energy is dissipated by viscosity is the TKE dissipation rate (Stacey et al., 2011). To understand the vertical transport of mass in stratified turbulence, turbulent diffusivity for mass, Kz, is defined as the rate at which the transport occurs. Moreover, the diffusivity influences the rate at which heat, mass, contaminants, and biota are distributed throughout the turbulent fluid (Barry et al., 2001).
Time series of the square of the buoyancy frequency N2, and the vertical turbulent diffusivity Kz are shown in Fig. 7 at station A. The surface layer of the river plume at station A was well mixed as indicated by a large Kz. The magnitude of Kz varied in time with values greater than 10-4 m2/s and increased up to 10-2 m2/s near the surface between t=4–11 h. The observed ε was large because of shear-induced turbulence during the first ebb between t=4–11 h, and N2 was relatively small, which resulted in increased diffusion. Diffusion in the Changjiang River is similar to that observed by MacDonald and Geyer (2004) in the Fraser River. The magnitude of N2 was small in the surface layer within the river plume and increased through the halocline, resulting in a small ε value of less than 10-8 W/kg, as shown in Fig. 6. In the second flood beginning at t=11 h, there was enhanced stratification with fresher water at the surface layer, and both ε (Fig. 6) and Kz (Fig. 7) were reduced. The N2 in the river plume was strong and reached as high as 10-2 1/s2, indicating that the diffusion was constrained by the enhanced stratification. High stratification was also observed at the TWC layer below 12 m during the flood tide. The high stratification indicated the intrusion of TWC water from the bottom. Higher Kz was also observed at the TWC layer in the morning (t=5–6 h) and evening (t=21–22 h). The enhanced diffusion indicated that the TWC water that intruded during flood tide mixed with upper layer water during ebb tide, which corresponded with a dramatically deeper halocline (Fig. 5). A large Kz was identified at the TWC layer, reflecting the large ε value shown in Fig. 6 and weak stratification. As shown in Figs. 5b & 7a, the halocline deepened during low tide at t=10 h, which indicated that the halocline was affected by internal waves. The displacement of vertical halocline was ~4 m and occurred over a period of ~4 h (Figs. 5b & 7a). The displacement could be caused by the passage of an internal wave of elevation with amplitude of ~4–5 m (Liu et al., 2009). Lee et al. (2006) reported a series of internal waves in the East China Sea, which were associated with the low barotropic tide. The deepened pycnocline here was also observed during low tide, which supports our hypothesis that the passage of an internal wave could be responsible for this phenomenon. The internal wave was accompanied by a significant enhanced vertical shear (Fig. 8a), low Rig zone (Fig. 8b), and intense turbulence dissipation (Fig. 6).

|
| Fig.7 Time series of vertical distribution of square of buoyancy frequency N2 (a) and turbulent diffusivity Kz (b) at station A from October 31, 2014 to November 1, 2014 The color bar is indicated with a log10 scale. L and H represent low tide and high tide, respectively. |
The enhanced ε and N2 overlapped with each other, as shown in Figs. 6 & 7a, and were both induced by the Changjiang River plume, whereas diffusion was constrained by stratification. The dissipation, stratification, and diffusivity showed tidal variations with a time lag. The influence of the tide on river plume turbulence is clearly shown from in ε, N2, and Kz plots. The competition between shear and stratification plays a crucial role in plume dynamics in opposing ways: shear acts to enhance turbulence, while stratification acts to weaken mixing and transform TKE to potential energy. This competition is parameterized as gradient Richardson number, Rig=N2/S2 (Turner, 1973), where N is the density stratification and S is the velocity shear. Rig provides instability (Rig < 1/4) (Miles, 1961). Strongly stratified shear flow in river plumes with Rig < 1/4 usually generates shear instability and breaks down into turbulence. In this process, kinetic energy from the mean flow is converted to viscous dissipation and buoyancy flux. Turbulence mixing continues until the system returns to a stable Rig.
The structure of ε and Kz depend on the competition between stratification, which acts to reduce mixing and TKE production, and shear intensification associated with the river discharge (Stacey et al., a necessary but insufficient condition for turbulent 2011). Shear intensification produces rapid acceleration in the near-field plume, resulting in a supercritical state and enhanced shear. During deployments of the microstructure profiler, the ADCP was used to obtain the fine-scale velocity shear. The contour of the square of vertical shear (S2) is shown in Fig. 8a. The shear components were calculated following Liu et al. (2009). We calculated smoothed velocity shear as S2= (∂u/∂z)2+(∂v/∂z)2. The smoothed u and v were calculated using the second order Butterworth low-pass filter with a cut-off wavenumber of klp= 0.13 cpm. Because of the occurrence of the blank zone in the ADCP, the first layer of shear is at 6.1 m where the halocline and intense mixing remains. As the bin size of ADCP is 2 m, the ε and N2 profiles were interpolated into 2-m intervals to match S2 and obtain Rig.

|
| Fig.8 Time series of vertical distribution of square of velocity shear S2 (a) and gradient Richardson number Rig (b) at station A from October 31, 2014 to November 1, 2014 The color bar is indicated with a log10 scale. L and H represent low tide and high tide, respectively. |
In the river plume, strong shear was observed during ebb tide at t=6–14 h, which was consistent with a high dissipation rate. Velocity shear varied by orders of magnitude due to the variation in tidal current. A low shear layer occurred below the river plume where there was low dissipation and high stratification (Fig. 8). The shear at the TWC layer showed significant tidal variation, indicating that stronger shear occurred at ebb tide. The occurrence of strong shear did not coincide with high dissipation (Fig. 6) because of the variation in stratification, and the shear induced by intrusion of the TWC was not strong enough to overcome the stratification. The time series of S2 (Fig. 8) and N2 (Fig. 7) showed tidal asymmetries, as N2 increased during ebbs and induced a highly sheared transition to flood.
In the upper layer where the river plume exists, the contour of the variation of Rig at station A (Fig. 8b) shows that there was a high potential for shear instability (Rig < 1/4) during the ebb tide at t=7–12 h (approximately 5-h long). This segment of low Rig occurred concurrently with a strong displacement in the halocline (Fig. 5b), which was assumed to be caused by the high discharge of fresh water and induced soliton through the observational period. Water below the river plume had a relatively high Rig, which is consistent with the structure of N2, ε, and S2. High shear instability was observed at the TWC layers, which showed similar patterns as Rig (Fig. 8b). Rig decreased during ebbs owing to enhanced shear from tidal currents. In addition, at all heights from the observed bottom to the lower boundary of the halocline, Rig was always greater than 1/4. The distribution of ε at the TWC layer was not consistent with the shear, because the strongest shear was trapped by high stratification. Early studies showed that shear instability developed in river plumes with strong gradients, where Rig is proportional to N but inversely proportional to S. Hence, if N and S are intensified or weakened by the same factor, Rig stays the same while the susceptibility to turbulence is increased. To study the mixing turbulence, we need to consider dissipation, diffusivity, and the gradient Richardson number.
5 CONCLUSIONThe hydrographical condition in the near-field Changjiang River plume is complicated because it is occupied by a fresh river plume in the upper layer and saline TWC water intruding from the bottom during flood tide. Many biological organisms are sensitive to mixing between different water masses, because it provides a sufficient influx of nutrients to biological communities (Kudela and Peterson, 2009), and influences biological productivity through changing nutrients and light (Lohan and Bruland, 2006). Nevertheless, few observations have been performed to quantify turbulent mixing because of measurement difficulties. We used a newly developed microstructure profiler (TurboMAP) to investigate turbulent mixing and hydrographic parameters in the near-field Changjiang River plume.
Surface dissipation rate ε in near-field plume reached 10-4 W/kg, and it decreased with distance from the river mouth. The observed ε was 10-7 W/kg, which indicated the dissipation rate changed by three orders of magnitude from near-field to far-field plume. The dissipation rate decreased to less than 10-8 W/kg below the river plume and increased to 10-6 W/kg at the layer where the TWC intruded. In addition to the spatial variation of dissipation, variation of the mixing rate with time is important to study. We investigated the temporal distribution of turbulent mixing in the near-field plume. The strongest turbulent mixing was observed in the river plume during strong ebb tide, and the relevant dissipation and diffusion were observed to be more than 10-4 W/kg and 10-2 m2/s, respectively. Minimal mixing was also observed in the plume during flood tide and low discharge periods, and ε and Kz were 10-7.5 W/kg and 10-5.5 m2/s, respectively. The tidal cycle variations had a three orders of magnitude change of ε and Kz in the Changjiang River near-field plume, which is consistent with turbulent observation in other river plumes (MacDonald and Geyer, 2004; Nash et al., 2009; Wang et al., 2015). The depth of the halocline changed with tidal cycle, and stratification varied by one order of magnitude; less than ε and Kz. Stratification in the TWC layer followed the distribution of the halocline, which is opposite of the dissipation structure. The TWC layer mixing was influenced by a combination of the intrusion of the TWC and the river plume. Tidal current led to the intrusion and mixing between two water masses. The observed ε and Kz were as strong as in the river plume, but occurred for a relatively shorter time during ebb tide.
Velocity shear acts to enhance turbulence, while stratification weakens turbulent mixing. The competition between shear and stratification is estimated as Rig. To study the dynamics of turbulent mixing in the near-field plume, we deployed a shipmounted ADCP to obtain the shear distribution. The structure of velocity shear was similar to the dissipation rate in both the river plume and the TWC layer. However, the velocity shear in the TWC layer did not match the stratification structure. In high dissipation rate areas, the gradient Richardson number was less than the critical value (Rig < 1/4). The structure of Rig was also consistent with the shear and dissipation distribution, indicating that turbulent mixing in the near-field of the Changjiang River is controlled by a combination of shear induced by discharged river flow and tidal current.
6 DATA AVAILABILITY STATEMENTThe datasets generated during and/or analyzed during the current study are available from the corresponding author on reasonable request.
7 ACKNOWLEDGMENTWe thank Dr. NAN Feng from Institute of Oceanology, Chinese Academy of Sciences for the useful discussions on this topic.
Armi L, Farmer D M. 1986. Maximal two-layer exchange through a contraction with barotropic net flow. Journal of Fluid Mechanics, 164: 27-51.
DOI:10.1017/S0022112086002458 |
Bang I, Lie H J. 1999. A numerical experiment on the dispersion of the Changjiang River plume. Journal of the Korean Society of Oceanography, 34: 873-883.
|
Barry M E, Ivey G N, Winters K B, Imberger J. 2001. Measurements of diapycnal diffusivities in stratified fluids. Journal of Fluid Mechanics, 442: 267-291.
DOI:10.1017/S0022112001005080 |
Beardsley R C, Limeburner R, Yu H, Cannon G A. 1985. Discharge of the Changjiang (Yangtze River) into the East China Sea. Continental Shelf Research, 4(1-2): 57-76.
DOI:10.1016/0278-4343(85)90022-6 |
Chang P H, Isobe A. 2003. A numerical study on the Changjiang diluted water in the Yellow and East China Seas. Journal of Geophysical Research, 108(C9): 3 299.
DOI:10.1029/2002JC001749 |
Chen C S, Xue P F, Ding P X, Beardsley R C, Xu Q C, Mao X M, Gao G P, Qi J H, Li C Y, Lin H C, Cowles G, Shi M C. 2008. Physical mechanisms for the offshore detachment of the Changjiang diluted water in the East China Sea. Journal of Geophysical Research, 113(C2): C02002.
DOI:10.1029/2006JC003994 |
Chen F, MacDonald D G, Hetland R D. 2009. Lateral spreading of a near-field river plume: observations and numerical simulations. Journal of Geophysical Research, 114(C7): C07013.
DOI:10.1029/2008JC004893 |
Dagg M, Benner R, Lohrenz S, Lawrence D. 2004. Transformation of dissolved and particulate materials on continental shelves influenced by large rivers: plume processes. Continental Shelf Research, 24(7-8): 833-858.
DOI:10.1016/j.csr.2004.02.003 |
Ding J, Shao Y C, Wu D A. 2018. Effect of tidal currents on the transport of saline water from the north branch in the Changjiang River estuary. Journal of Oceanology and Limnology, 36(6): 2 085-2 097.
DOI:10.1007/s00343-018-7357-5 |
Fischer H. 1972. Mass transport mechanisms in partially stratified estuaries. Journal of Fluid Mechanics, 53(4): 671-687.
DOI:10.1017/S0022112072000412 |
Fong D A, Geyer W R. 2001. Response of a river plume during an upwelling favorable wind event. Journal of Geophysical Research, 106(C1): 1 067-1 084.
DOI:10.1029/2000JC900134 |
Ge J Z, Ding P X, Chen C S. 2015. Low-salinity plume detachment under non-uniform summer wind off the Changjiang estuary. Estuarine, Coastal and Shelf Science, 156: 61-70.
DOI:10.1016/j.ecss.2014.10.012 |
Geyer W R, Ralston D K. 2011. The dynamics of strongly stratified estuaries. Treatise on Estuarine and Coastal Science, 2: 37-51.
DOI:10.1016/B978-0-12-374711-2.00206-0 |
Geyer W R, Smith J D. 1987. Shear instability in a highly stratified estuary. Journal of Physical Oceanography, 17(10): 1 668-1 679.
DOI:10.1175/1520-0485(1987)017<1668:SIIAHS>2.0.CO;2 |
Geyer W R, Trowbridge J H, Bowen M M. 2000. The dynamics of a partially mixed estuary. Journal of Physical Oceanography, 30(8): 2 035-2 048.
DOI:10.1175/1520-0485(2000)030<2035:TDOAPM>2.0.CO;2 |
Hetland R D. 2005. Relating river plume structure to vertical mixing. Journal of Physical Oceanography, 35(9): 1 667-1 688.
DOI:10.1175/JPO2774.1 |
Horner-Devine A R, Hetland R D, MacDonald D G. 2015. Mixing and transport in coastal river plumes. Annual Review of Fluid Mechanics, 47: 569-594.
DOI:10.1146/annurev-fluid-010313-141408 |
Horner-Devine A R, Jay D A, Orton P M, Spahn E Y. 2009. A conceptual model of the strongly tidal Columbia River plume. Journal of Marine Systems, 78(3): 460-475.
DOI:10.1016/j.jmarsys.2008.11.025 |
Howard L N. 1961. Note on a paper of John W. Miles. Journal of Fluid Mechanics, 10(4): 509-512.
DOI:10.1017/S0022112061000317 |
Jay D A, Musiak J D. 1994. Particle trapping in estuarine tidal flows. Journal of Geophysical Research, 99(C10): 20 445-20 461.
DOI:10.1029/94JC00971 |
Jay D A, Smith J D. 1990. Residual circulation in shallow estuaries: 2. Weakly stratified and partially mixed, narrow estuaries. Journal of Geophysical Research, 95(C1): 733-748.
DOI:10.1029/JC095iC01p00733 |
Kang Z J, Yu R H, Kong F Z, Wang Y F, Gao Y, Chen J H, Guo W, Zhou M J. 2016. Records of bulk organic matter and plant pigments in sediment of the "red-tide zone" adjacent to the Changjiang River estuary. Chinese Journal of Oceanology and Limnology, 34(5): 915-927.
DOI:10.1007/s00343-016-4313-0 |
Kong F Z, Xu Z J, Yu R C, Yuan Y Q, Zhou M J. 2016. Distribution patterns of phytoplankton in the Changjiang River estuary and adjacent waters in spring 2009. Chinese Journal of Oceanology and Limnology, 34(5): 902-914.
DOI:10.1007/s00343-016-4202-6 |
Kudela R M, Peterson T D. 2009. Influence of a buoyant river plume on phytoplankton nutrient dynamics: What controls standing stocks and productivity?. Journal of Geophysical Research, 114(C2): C00B11.
DOI:10.1029/2008JC004913 |
Lee J H, Lozovatsky I, Jang S T, Jang C J, Hong C S, Fernando H J S. 2006. Episodes of nonlinear internal waves in the northern East China Sea. Geophysical Research Letters, 33(18): L18601.
DOI:10.1029/2006GL027136 |
Lentz S. 2004. The response of buoyant coastal plumes to upwelling-favorable winds. Journal of Physical Oceanography, 34(11): 2 458-2 469.
DOI:10.1175/JPO2647.1 |
Lie H J, Cho C H, Jung K T. 2015. Occurrence of large temperature inversion in the thermohaline frontal zone at the Yellow Sea entrance in winter and its relation to advection. Journal of Geophysical Research, 120(1): 417-435.
DOI:10.1002/2014JC010653 |
Liu S M, Zhang J, Chen H T, Wu Y, Xiong H, Zhang Z F. 2003. Nutrients in the Changjiang and its tributaries. Biogeochemistry, 62(1): 1-18.
DOI:10.1023/A:1021162214304 |
Liu Z Y, Wei H, Lozovatsky I D, Fernando H J S. 2009. Late summer stratification, internal waves, and turbulence in the Yellow Sea. Journal of Marine Systems, 77(4): 459-472.
DOI:10.1016/j.jmarsys.2008.11.001 |
Lohan M C, Bruland K W. 2006. Importance of vertical mixing for additional sources of nitrate and iron to surface waters of the Columbia River plume: Implications for biology. Marine Chemistry, 98(2): 260-273.
DOI:10.1016/j.marchem.2005.10.003 |
MacDonald D G, Chen F. 2012. Enhancement of turbulence through lateral spreading in a stratified-shear flow:development and assessment of a conceptual model. Journal of Geophysical Research, 117(C5): C05025.
DOI:10.1029/2011JC007484 |
MacDonald D G, Geyer W R. 2004. Turbulent energy production and entrainment at a highly stratified estuarine front. Journal of Geophysical Research, 109(C5): C05004.
DOI:10.1029/2003JC002094 |
MacDonald D G, Geyer W R. 2005. Hydraulic control of a highly stratified estuarine front. Journal of Physical Oceanography, 35(3): 374-387.
DOI:10.1175/JPO-2692.1 |
MacDonald D G, Goodman L, Hetland R D. 2007. Turbulent dissipation in a near-field river plume: a comparison of control volume and microstructure observations with a numerical model. Journal of Geophysical Research, 112(C7): C07026.
DOI:10.1029/2006JC004075 |
Mao H L, Kan T C, Lan S F. 1963. A preliminary study of the Yangtze diluted water and its mixing processes. Oceanologia et Limnologia Sinica, 5(3): 183-206.
(in Chinese with English abstract) |
Mao Z C, Shen H T, Yao Y D. 1993. Analysis of sources of saltwater intrusion along south bank of south branch of Yangtse River estuary. Marine Science Bulletin, 12(3): 17-25.
(in Chinese with English abstract) |
Matsuno T, Lee J S, Shimizu M, Kim S H, Pang I C. 2006. Measurements of the turbulent energy dissipation rate ε and an evaluation of the dispersion process of the Changjiang Diluted Water in the East China Sea. Journal of Geophysical Research, 111(C11): C11S09.
DOI:10.1029/2005JC003196 |
McCabe R M, MacCready P, Hickey B M. 2009. Ebb-tide dynamics and spreading of a large river plume. Journal of Physical Oceanography, 39(11): 2 839-2 856.
DOI:10.1175/2009JPO4061.1 |
Miles J W. 1961. On the stability of heterogeneous shear flows. Journal of Fluid Mechanics, 10(4): 496-508.
DOI:10.1017/S0022112061000305 |
Nash J D, Kilcher L F, Moum J N. 2009. Structure and composition of a strongly stratified, tidally pulsed river plume. Journal of Geophysical Research, 114(C2): C00B12.
|
Nasmyth P. 1970. Oceanic turbulence. University of British Columbia, Vancouver. 69p.
|
Ni Z H, Chen H, Dong L X, Shi Z, Wang D Z, Zhai Q. 2012. Measurement and analysis of vertical mixing and stratification within the plume outside the Changjiang River estuary. Journal of Shanghai Jiaotong University, 46(11): 1 862-1 873.
(in Chinese with English abstract) DOI:10.16183/j.cnki.jsjtu.2012.11.030 |
Osborn T R. 1980. Estimates of the local rate of vertical diffusion from dissipation measurements. Journal of Physical Oceanography, 10(1): 83-89.
DOI:10.1175/1520-0485(1980)010<0083:EOTLRO>2.0.CO;2 |
Pu X, Shi J Z, Hu G D. 2016. Analyses of intermittent mixing and stratification within the north passage of the Changjiang(Yangtze) River estuary, China: a three-dimensional model study. Journal of Marine Systems, 158: 140-164.
DOI:10.1016/j.jmarsys.2016.02.004 |
Rabouille C, Conley D J, Dai M H, Cai W J, Chen C T A, Lansard B, Green R, Yin K, Harrison P J, Dagg M, McKee B. 2008. Comparison of hypoxia among four riverdominated ocean margins: the Changjiang (Yangtze), Mississippi, Pearl, and Rhône Rivers. Continental Shelf Research, 28(12): 1 527-1 537.
DOI:10.1016/j.csr.2008.01.020 |
Rong Z R, Li M. 2012. Tidal effects on the bulge region of Changjiang River plume. Estuarine, Coastal and Shelf Science, 97: 149-160.
DOI:10.1016/j.ecss.2011.11.035 |
Shang X D, Qi Y F, Chen G Y, Liang C R, Lueck R G, Prairie B, Li H. 2017. An expendable microstructure profiler for deep ocean measurements. Journal of Atmospheric and Oceanic Technology, 34(1): 153-165.
DOI:10.1175/JTECH-D-16-0083.1 |
Shen H T, Mao Z C, Zhu J R. 2003. Saltwater Intrusion in the Changjiang estuary. China Ocean Press, Beijing. 175p.
(in Chinese)
|
Shen H T, Zhang C L. 1992. Mixing of salt water and fresh water in the Changjiang River estuary and its effects on suspended sediment. Chinese Geographical Science, 2(4): 373-381.
DOI:10.1007/BF02664568 |
Shen L, Xu H P, Guo X L, Li M. 2011. Characteristics of largescale harmful algal blooms (HABs) in the Yangtze River estuary and the adjacent East China Sea (Ecs) from 2000 to 2010. Journal of Environmental Protection, 2(10): 1 285-1 294.
DOI:10.4236/jep.2011.210148 |
Shi J Z, Lu L F. 2011. A short note on the dispersion, mixing, stratification and circulation within the plume of the partially-mixed Changjiang River estuary, China. Journal of Hydro-environment Research, 5(2): 111-126.
DOI:10.1016/j.jher.2010.06.002 |
Simpson J H, Brown J, Matthews J, Allen G. 1990. Tidal straining, density currents, and stirring in the control of estuarine stratification. Estuaries, 13(2): 125-132.
|
Stacey M T, Monismith S G, Burau J R. 1999. Measurements of reynolds stress profiles in unstratified tidal flow. Journal of Geophysical Research, 104(C5): 10 933-10 949.
DOI:10.1029/1998JC900095 |
Stacey M T, Rippeth T P, Nash J D. 2011. Turbulence and stratification in estuaries and coastal seas. Treatise on Estuarine and Coastal Science, 2: 9-35.
DOI:10.1016/B978-0-12-374711-2.00204-7 |
Turner J S. 1973. Buoyancy Effects in Fluids. Cambridge University Press, Cambridge. 382pp.
|
Wang J F, MacDonald D G, Orton P M, Cole K, Lan J. 2015. The effect of discharge, tides, and wind on lift-off turbulence. Estuaries and Coasts, 38(6): 2 117-2 131.
DOI:10.1007/s12237-015-9958-y |
Wang J F, Yu F, Ren Q, Si G C, Wei C J. 2019. The observed variations of the north intrusion of the bottom Taiwan Warm Current inshore branch and its response to wind. Regional Studies in Marine Science, 30: 100690.
DOI:10.1016/j.rsma.2019.100690 |
Wolk F, Yamazaki H, Seuront L, Lueck R G. 2002. A new freefall profiler for measuring biophysical microstructure. Journal of Atmospheric and Oceanic Technology, 19(5): 780-793.
DOI:10.1175/1520-0426(2002)019<0780:ANFFPF>2.0.CO;2 |
Wright L D, Coleman J M. 1971. Effluent expansion and interfacial mixing in the presence of a salt wedge, Mississippi River delta. Journal of Geophysical Research, 76(36): 8 649-8 661.
DOI:10.1029/JC076i036p08649 |
Wu H, Shen J, Zhu J R, Zhang J, Li L. 2014. Characteristics of the Changjiang plume and its extension along the Jiangsu coast. Continental Shelf Research, 76: 108-123.
DOI:10.1016/j.csr.2014.01.007 |
Wu H, Zhu J R, Shen J, Wang H. 2011. Tidal modulation on the Changjiang River plume in summer. Journal of Geophysical Research, 116(C8): C08017.
|
Xuan J L, Yang Z Q, Huang D J, Wang T P, Zhou F. 2016. Tidal residual current and its role in the mean flow on the Changjiang bank. Journal of Marine Systems, 154: 66-81.
DOI:10.1016/j.jmarsys.2015.04.005 |
Yuan R, Wu H, Zhu J R, Li L. 2016. The response time of the C hangjiang plume to river discharge in summer. Journal of Marine Systems, 154: 82-92.
DOI:10.1016/j.jmarsys.2015.04.001 |
Zhang W X, Wu H, Hetland R D, Zhu Z Y. 2019. On mechanisms controlling the seasonal hypoxia hot spots off the Changjiang River estuary. Journal of Geophysical Research, 124(12): 8 683-8 700.
DOI:10.1029/2019JC015322 |
Zhu J R, Ding P X, Hu S, Yang L H. 2001. Observation of the Changjiang diluted water, plume front and upwelling off the Changjiang mouth during August 2000, Process of the Eleventh PAMS/JECSS Workshop, 210-221.
|
Zhu J R, Wu H, Li L. 2015. Hydrodynamics of the Changjiang estuary and adjacent seas. In: Zhang J ed. Ecological Continuum from the Changjiang (Yangtze River)Watersheds to the East China Sea Continental Margin.Springer, Cham. p.19-45, https: //doi.org/10.1007/978-3-319-16339-0_2.
|