Institute of Oceanology, Chinese Academy of Sciences
Article Information
- REN Qiang, YU Fei, NAN Feng, WANG Jianfeng, XU Anqi
- Intraseasonal variability of the Kuroshio east of Taiwan, China, observed by subsurface mooring during 2016-2017
- Journal of Oceanology and Limnology, 38(5): 1408-1420
- http://dx.doi.org/10.1007/s00343-020-9286-3
Article History
- Received Nov. 18, 2019
- accepted in principle Dec. 30, 2019
- accepted for publication Jun. 15, 2019
2 University of Chinese Academy of Sciences, Beijing 100049, China;
3 Center for Ocean Mega-Science, Chinese Academy of Sciences, Qingdao 266071, China;
4 Pilot National Laboratory for Marine Science and Technology(Qingdao), Qingdao 266071, China
The Kuroshio is one of the strongest western boundary current that originates as the northward branch of the North Equatorial Current bifurcation along the east coast of the Philippines (Zhang et al., 2001; Qiu and Chen, 2010a). It primarily flows northward, passing through east of the Luzon Strait and around eastern Taiwan, China, before reaching the East China Sea along the continental slope. It transports heat and salt from the equatorial current system to the mid-latitudes, thereby influencing climate and ocean-atmosphere interactions along its flow path (Nitani, 1972; Kwon et al., 2010; Jan et al., 2015). Variability of the Kuroshio to the east of Taiwan, China, on long timescales (order of days to years) has been widely studied (e.g., Zhang et al., 2001; Book et al., 2002; Hsin et al., 2008, 2010, 2013; Chang and Oey, 2011; Gawarkiewicz et al., 2011; Chang et al., 2015). Earlier studies on seasonal variability of the transport of the Kuroshio northeast of Taiwan, China, have shown increased (decreased) magnitude in summer (winter), offshore (inshore) shift of current axis in spring (summer), and a path close to the continental slope in fall (winter) caused by the reversal of the East Asian monsoon (Sun, 1987; Chuang and Liang, 1994). Some studies have indicated that seasonal variability of the Kuroshio is related to mesoscale eddies that propagate to the western boundary from the Subtropical Countercurrent (Lee et al., 2001; Zhang et al., 2002; Qiu and Chen, 2010b; Ramp et al., 2017).
Variation of the Kuroshio on timescales from days to a month has largely been proven and a number of studies have examined the mechanisms underlying this intraseasonal variability (ISV). Possible factors causing ocean ISV include eddy activity, atmospheric forcing, bottom topography, and baroclinic instability (Zhang et al., 2001; Lau and Waliser, 2005). Combining satellite data and results from a numerical model, Hsin et al. (2010) found a fluctuation in the Kuroshio between Taiwan, China, and Lan-Yu Island that has a period of 2–4 weeks; this could have been caused by change of negative wind stress curl in the northeastern South China Sea in winter and typhooninduced intense wind in summer. Velocity and transport variability with a period of 30–50 days is generated by baroclinic instability (Zhang et al., 2001). Strong wind stress curl can cause reversal of flow direction and considerable ISV in velocity (Wu et al., 2005).
Mesoscale eddies induce ISV in the Kuroshio to the east of Taiwan, China, with long periods that cannot be attributed to wind forcing. Using empirical orthogonal function analysis, Zhang et al. (2001) found that current axis and transport mode are the primary factors underlying Kuroshio variability east of Taiwan, China. They also found that variability on timescales of 70–200 days is related to mesoscale eddies. Sea level difference across the Kuroshio increases (decreases) because of anticyclonic (cyclonic) eddies, enhancing (reducing) Kuroshio transport (Yang et al., 1999; Lien et al., 2014). Using pressure-sensor-equipped inverted echo sounders, Tsai et al. (2015) found that data collected from the east of Taiwan, China, behaved differently from those collected to the northeast of Luzon. They concluded that anticyclonic (cyclonic) periods correspond to increase (decrease) of sea surface and pycnocline slopes across the Kuroshio, which lead to changes in Kuroshio transport. In their study on the Intermediate Water (IW) east of Taiwan, China, Mensah et al. (2015) examined the variable contributions of the water masses from the South China Sea, North Pacific, and upstream Kuroshio, and concluded that IW variability is caused by westward propagating eddies that could persist for approximately 100 days. Based on 11 shipboard acoustic Doppler current profiler (ADCP) and mooring ADCP measurements obtained along an approximate 24°N transect from November 2012 to October 2014, they suggested that poleward transport is enhanced (reduced) by an increasing (decreasing) sea level anomaly (SLA) when anticyclonic (cyclonic) eddies interact with the Kuroshio, and that the relationship is supported by a coefficient of correlation of 0.82.
This study focuses on ISV of the Kuroshio east of Taiwan, China. Combining satellite altimetry data, numerical ocean model simulations, and data from a subsurface mooring system deployed at 23°N/122°E, we investigated ISV in the upper ocean and discussed its possible causes. We also explored the IW variability east of Taiwan, China. In addition, we proposed a possible mechanism for the Kuroshio ISV.
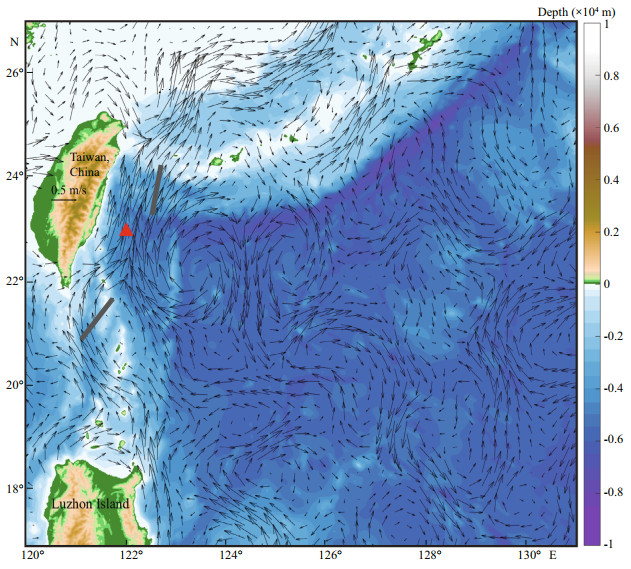
2 DATA AND METHOD 2.1 Mooring dataIn 2016, the Institute of Oceanology, Chinese Academy of Sciences conducted a cruise off the east coast of Taiwan, China, and deployed a mooring at 23°N/122°E (Fig. 1). The mooring rested at a depth of 400 m where the water depth is approximately 4 900 m, and obtained ocean currents between sea surface and 800 m depth. It worked for about 17 months from January 2016 to May 2017. It had two 75-kHz ADCPs (one upward-looking and one downward-looking). Vertical profiles comprised hourly measurements at a vertical resolution of 8 m in 70 bins. Data from the ADCPs were subjected to strict quality control, and only data that lie within the following ranges were used: current speeds between -2 and approximately +2 m/s, roll and pitch angles less than 15°, and beam coverage greater than 70%. Daily data were averaged to remove tidal signals and other high frequency fluctuations. Data of the upper 20 m were removed because of a stronger echo intensity that reduced data quality. Conductivitytemperature-depth (CTD) sensors were deployed at intervals of 100 m at depths of 400–800 m, and acquired measurements at 10-min intervals. However, the main float that was originally deployed at a depth of 400 m experienced considerable vertical movement, and was at a depth of 700 m in July 2016 because of current variations. As a result, the CTDs were unable to acquire measurements at the prescribed depths, and all CTD data were interpolated across depth and average daily values were calculated.
|
| Fig.1 Bottom topography (color shading) and surface geostrophic currents (black arrows) east of Taiwan, China, derived from satellite altimetry data Mooring was located at 23°N/122°E (red triangle) where water depth is approximately 4 900 m. Observations were made between January 2016 and May 2017. Topography data are from ETOPO1 (https://www.ngdc.noaa.gov/), and surface current data are derived from Archiving, Validation, and Interpretation of Satellite Data in Oceanography (AVISO). |
To study the westward propagation of mesoscale eddies, an Archiving, Validation, and Interpretation of Satellite Data in Oceanography (AVISO) altimetry dataset was used. The SLA dataset had a spatial resolution of 1/4°×1/4°, extended from December 2015 to May 2017, and provided satisfactory overlap with mooring data. Geostrophic current data were also obtained from the Global ARMOR3D L4 Reprocessed dataset (http://marine.copernicus.eu/services-portfolio/access-to-products/). This dataset combines satellite (SLA, geostrophic surface current, and sea surface temperature) and in situ (temperature and salinity profile) observations through statistical methods. The data are averaged weekly and have the same spatial resolution as the SLA data.
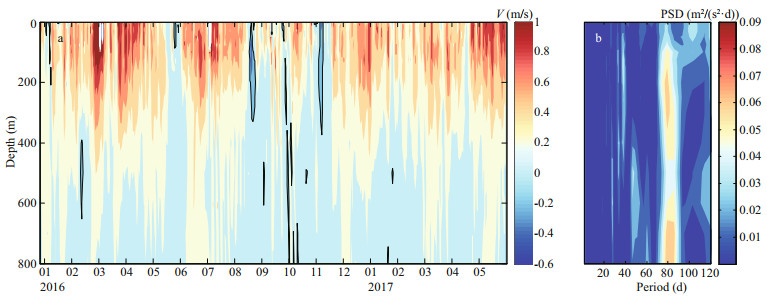
2.3 Hybrid Coordinate Ocean Model data and validationHybrid Coordinate Ocean Model (HYCOM) assimilation data from the Naval Research Laboratory for January 2016 to May 2017 were used to study the current along a 23°N transect east of Taiwan, China. The products include daily data with horizontal resolution of 1/12° and vertical data in the upper 800 m at 17 levels (0, 10, 20, 30, 50, 75, 100, 125, 150, 200, 250, 300, 400, 500, 600, 700, and 800 m). Time series of the Kuroshio meridional velocity at the mooring site from HYCOM data (Fig. 2) has similar structure compared with observational result (Fig. 3b). Observations indicate reversals of flow direction in June and November, which are also captured by the model. In particular, power spectrum density shows that HYCOM data are able to capture the variability with a period of approximately 85 days (Fig. 2b). Thus, as this study focused on qualitative interpretation, the HYCOM assimilation data were considered suitable for the analysis. Quality of the salinity assimilation data is examined in Section 4.
|
| Fig.2 Daily meridional velocity (V) (a) and power spectrum density (PSD) of meridional velocity (b) from the HYCOM data during January 2016 and May 2017, which overlap with mooring observations |
|
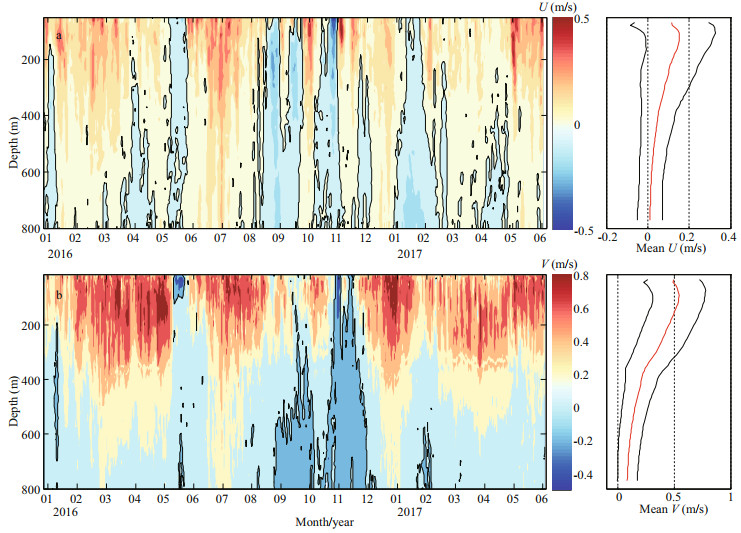
| Fig.3 Zonal (U) (a) and meridional (V) (b) velocities measured by ADCPs between January 2016 and May 2017 at 23°N/122°E (left panel); mean (red line) U and standard deviation (black line) (a) and mean (red line) V and standard deviation (black line) (b) in upper 800 m over the study period (right panel) Color shading indicates magnitude of velocity; black line indicates the zero contour of velocity. |
Meridional velocity from mooring ADCPs shows strong variability in both magnitude and direction (Fig. 3). The Kuroshio is a strong northward flow mainly located in the upper 400 m. Maximum velocities can reach up to 1.0 m/s and are found at the depth of about 100 m. Time-averaged meridional (V) and zonal (U) velocities between the sea surface and 800 m depth over the study period are shown in Fig. 3. Mean zonal and meridional currents have the same structure with the magnitude of U being much smaller than that of V. As the Kuroshio is a mostly northward flow, meridional velocity dominates. At a depth of approximately 100 m, standard deviation of V is large and approximately 0.25 m/s, which is half of the mean flow, indicating that the velocity core is unstable east of Taiwan, China. At depths below 400 m, average speed is considerably smaller than that above 400 m. While flow is northward during most of the study period, V components reversed and flowed southward in May, September, and November in 2016 with a maximum southward velocity of 0.5 m/s lasting for approximately 10 days.
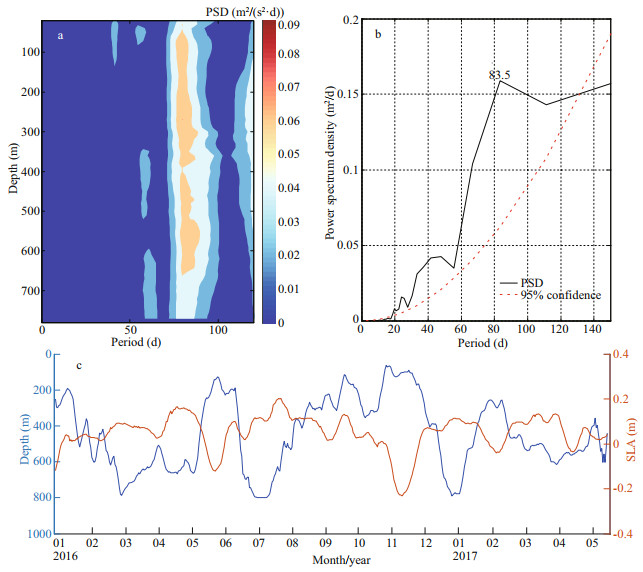
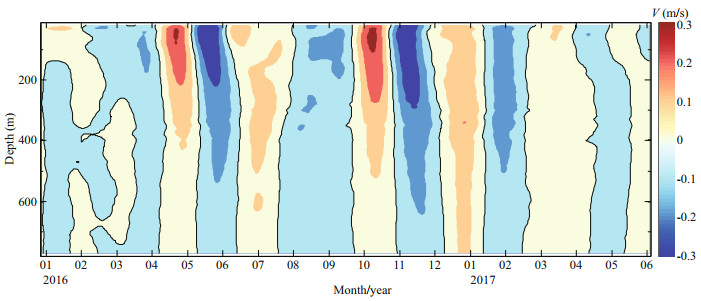
3.2 Intraseasonal variability of the KuroshioThe current at the mooring site to the east of Taiwan, China, is mainly controlled by the Kuroshio, where zonal velocity is much weaker than meridional velocity; therefore, we chose to analyze the meridional velocity in this study. Velocity cores that appeared in the observational data (Fig. 3) indicate variation of Kuroshio periodicity. We evaluated the power spectrum density of V to determine the variability of meridional velocity in the upper 800 m (Fig. 4a). A period of approximately 70–95 d is visible at each depth level. To better understand ISV, we filtered the time series of ADCP current measurements using a 40–100-d band-pass filter (Fig. 5). We found clear regular bands, and a marked ISV signal with a period of 3 months. The largest peak-to-peak structure is found in the upper 300 m with a velocity of around 0.3 m/s, indicating that the near-surface layer is most affected by ISV. Following earlier studies, we used the velocity of 0.2 m/s to represent the boundary of the Kuroshio, and examined variation of the maximum depth of the 0.2 m/s with time series (Fig. 4c). We found that the Kuroshio can reach a depth of 800 m, and currents at this depth have a period of approximately 80 d. We also calculated the correlation coefficient between the depth of the Kuroshio and the SLA. It has a relatively high value of 0.61, indicating interactions between Kuroshio depth and SLA.
|
| Fig.4 Power spectrum density (PSD; units: m2/s2) of meridional velocity (V) in the upper 800 m (a); PSD of sea level anomaly (SLA) at 23°N/122°E (b). Red dotted line indicates 95% confidence level; daily mean of maximum depth of the 0.2 m/s (blue) from ADCPs measurements and SLA (red) over the study period (c) |
|
| Fig.5 Time series of 40–100-d band-pass filtered meridional velocity from mooring measurements |
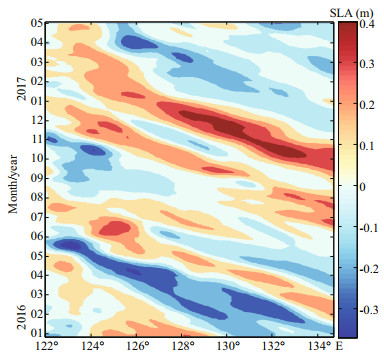
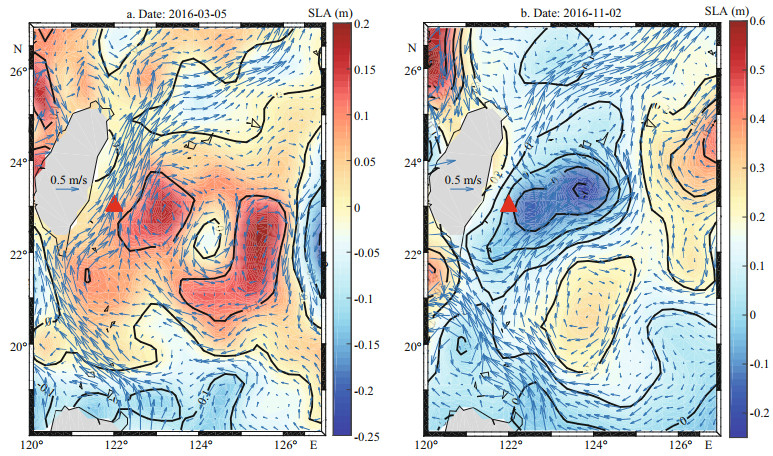
Westward propagation of both cyclonic and anticyclonic mesoscale eddies is evident to the east of Taiwan, China, with periods of approximately 100 d (Yang et al., 1999; Zhang et al., 2001). Figure 6 confirms the presence of these eddies in the area of the Subtropical Countercurrent. The power spectrum of the SLA (Fig. 4b) shows peaks with periods of approximately 85 d, which are in agreement with the period of meridional velocity variation, indicating that mesoscale eddies travel intraseasonally through the region to the east of Taiwan, China. Positive and negative bands of SLA appear alternately along 23°N between 122°E and 135°E (Fig. 6). These eddies travel westward from 135°E to 122°E over a period of approximately five months at an average speed of 10 cm/s. They then disappear when encountering the Kuroshio and the western boundary. Thus, the mooring site is continually influenced by eddy movement from the inner ocean. Kuroshio velocity is clearly influenced by westward propagating mesoscale eddies. Over the study period, there are two positive and negative SLA periods, which represent cyclonic and anticyclonic events (Fig. 7). For example, a strong anticyclonic eddy on March 5, 2016 was associated with higher Kuroshio meridional velocity; a cyclonic eddy on November 2, 2016 was associated with lower Kuroshio meridional velocity; there is an identical relationship between eddies and meridional velocity (Figs. 3b, 5, & 6).
|
| Fig.6 Longitude-time contours of sea level anomaly along 23°N from January 2016 to May 2017 |
|
| Fig.7 Composite maps of sea level anomaly (color shading) and surface current (blue arrows) on March 5, 2016 in the presence of anticyclonic eddies (a) and November 2, 2016 in the presence of cyclonic eddies (b) Location of mooring sites is indicated by red triangles. |
To examine the ISV of the Kuroshio east of Taiwan, China, we also calculated the correlation between wind and current velocities measured by the moored ADCPs over the study period. We found that the local wind stress has a period of around 10–15 d (figure not shown). This is inconsistent with ISV in the upper 800 m of the Kuroshio, which has a period of 70–85 d, indicating that local wind is not a direct cause of Kuroshio ISV.
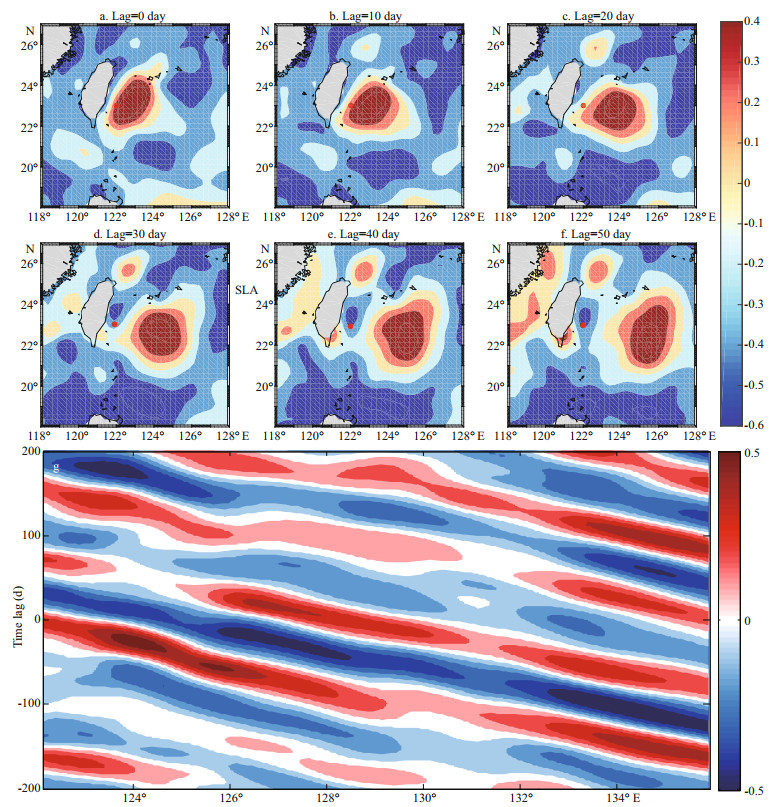
Figure 3b indicates that the maximum velocity of the Kuroshio lies in the upper 400 m; therefore, we calculated mean meridional velocity over the depths of 0–400 m to elucidate the relationship between the SLA and the meridional velocity at the mooring site. Western propagation of mesoscale eddies is visible in maps of correlation coefficients between meridional velocity and SLA in the regions of 18°N–27°N and 120°E–127°E at different lag times. There is also a region of high correlation with a correlation coefficient of approximately 0.4 (shown in red in Fig. 8a–e) east of Taiwan, China, and its distance with eastern Taiwan, China, varies with lag time. Mesoscale eddies propagating to the east of Taiwan, China, clearly influence Kuroshio ISV. Significant positive correlation is found at 22°N/126°E with a lag of 50 days from the mooring site at 23°N/122°E, which corresponding eddy translation speeds of 9.7 cm/s calculated from Fig. 8. Using a pressure-sensorequipped inverted echo sounder array to study correlation with impinging eddies; Tsai et al. (2015) also concluded that eddy speeds near Taiwan, China, are in the range of 11–24 cm/s. These results can be compared with those from Chelton and Schlax (1996) and Chelton et al. (2011) that indicated that westward propagation speed of first-mode baroclinic Rossby waves and nonlinear mesoscale eddies around 20°N is approximately 8 cm/s. These findings are in agreement with those from previous studies and indicate that positive (negative) SLA due to anticyclonic (cyclonic) eddies on the eastern flank of the Kuroshio increases (decreases) Kuroshio velocity (Yang et al., 1999; Lien et al., 2014; Chang et al., 2018). In order to explore the source of ISV of Kuroshio, the longitude-time lag correlations between the V and SLA along 23°N are shown in Fig. 8g. The westward propagation of the correlations was connected to the variation periods of ~90 days at 122°E, which is consistent with the Kuroshio variation periods, and reveal that the ISV of Kuroshio east of Taiwan, China, is traceable to the propagated mesoscale eddies.
|
| Fig.8 Maps of correlation coefficients between sea level anomaly (SLA) and meridional velocity (V) measured by moored Acoustic Doppler Current Profilers averaged over depths of 0–400 m V lags behind SLA by 0 day (a), 10 days (b), 20 days (c), 30 days (d), 40 days (e), and 50 days (f). Color shading indicates value of correlation coefficient with red (blue) indicating positive (negative) correlation. Location of mooring site is indicated by red dot; time-longitude lag correlations between the V and SLA along 23°N during mooring observation time (g). |
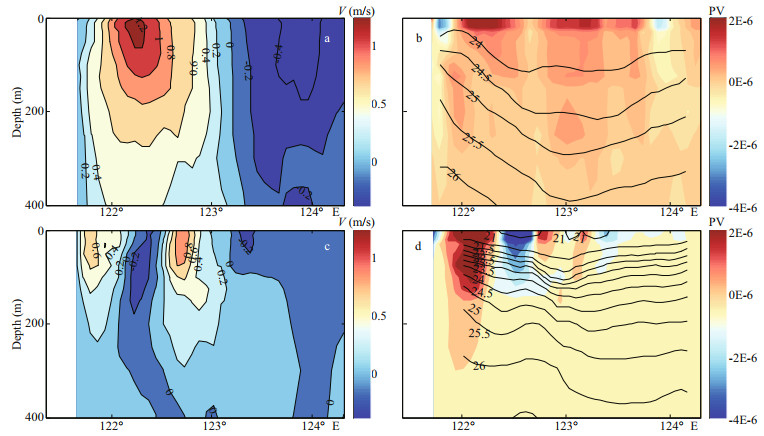
From Fig. 6, we calculated the average periodicity of eddy arrival is about 90 days, which is consistent with Kuroshio ISV. Together with data collected at the ADCP mooring site at 23°N/122°E, it is clear that Kuroshio ISV is caused by western mesoscale eddies. However, the mooring site represents just one location, and our measurements only represent a few in situ observations over a relatively long period; therefore, we have insufficient data to accurately describe the change of current and density along the Kuroshio east of Taiwan, China, over time. Data from HYCOM along 23°N during an anticyclonic eddy (Fig. 9a) and during a cyclonic eddy (Fig. 9c) were used to examine zonal migration of the main axis of the Kuroshio. The Kuroshio boundary is defined by the 0.2 m/s contour. Maximum velocity of the Kuroshio can reach up to 1.2 m/s and the eastern flank of the Kuroshio can reach approximately 122.75°E. Center of the velocity core is at approximately 122°E when an anticyclonic eddy is approaching. When a cyclonic eddy is active, maximum velocity is approximately 0.6 m/s near the shore, and is found at 121.5°E and a depth of 100 m. These results suggest that the width of the Kuroshio changes with the impingement of a western mesoscale eddy. Anticyclonic (cyclonic) eddies correspond to higher (lower) velocities, displacement of the center of the velocity core further offshore (inshore), and a wider (narrower) current. As the zonal migration of the velocity core and the magnitude of the velocity change due to mesoscale eddies, the large fluctuation of the current measured at the mooring site at 23°N/ 122°E displays ISV.
|
| Fig.9 Vertical distribution of meridional velocity (V) during an anticyclonic eddy (a) and a cyclonic eddy (c) along the 23°N section from 121.6°E–123.5°E east of Taiwan, China; vertical distribution of potential vorticity (PV) difference and potential density during an anticyclonic eddy (b) and a cyclonic eddy (d) along the same section In a and c, line contours represent magnitude of velocity; In b and d, line contours and color shading represent potential density and PV difference obtained by subtracting mean PV along the section. |
Meanwhile, there is a positive correlation between Kuroshio velocity and the El Niño-Southern Oscillation (ENSO) with Kuroshio velocity lagging behind ENSO by approximately 2–4 months (Shen at al., 2014). The strong El Niño event in 2015–2016 was followed by a cold phase in 2017. From the ADCP data showed in Fig. 5, we also found a strong ISV signal in the upper layer in 2016, which was weaker in 2017. Therefore, we suggest that ENSO may be one of the factors underlying the large variations in the Kuroshio. However, due to the data limitation, we will study the changes in the Kuroshio caused by ENSO in the future.
4.2 Mechanism of eddy impact on the Kuroshio east of Taiwan, ChinaTo explore how mesoscale eddies impact the Kuroshio, we calculated potential vorticity (PV) and potential density along the 23°N section using HYCOM data during an anticyclonic eddy (Fig. 9b) and during a cyclonic eddy (Fig. 9d). The PV was computed as follows:

where 
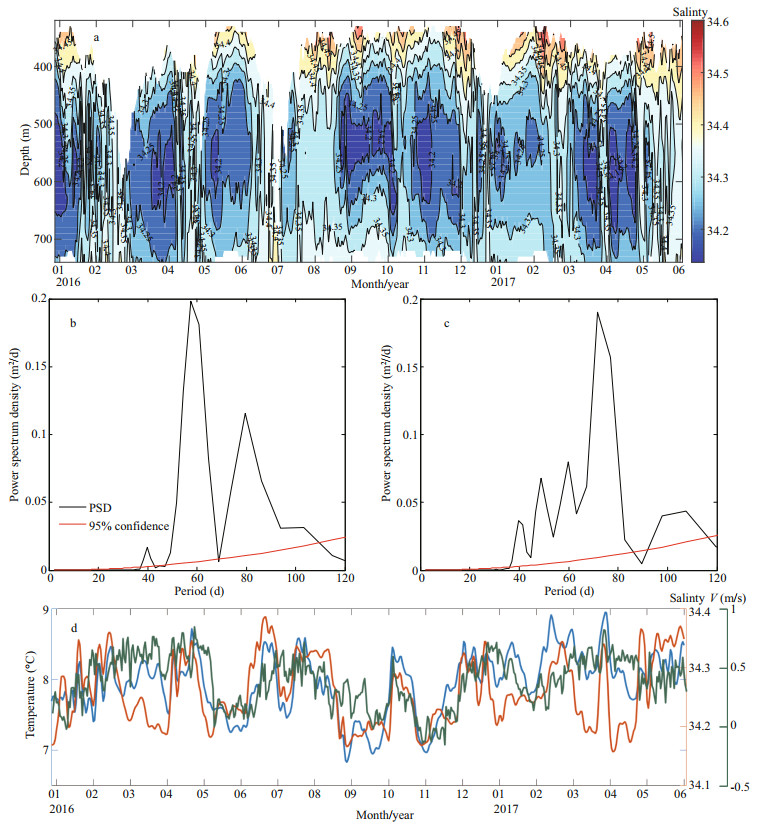
The ISV was also captured by the CTDs deployed on the mooring at depths of between 400 and 800 m at 100-m intervals. Simulated salinity and current from HYCOM data were also used to examine movements of the IW. Although the two salinity time series are not consistent by peak-to-peak, the HYCOM salinity variation shows the ISV with periods of ~80 days, in accordance with mooring salinity variation (Fig. 10b–c). Hence, the HYCOM data is able to reasonably analysis the processes associated with the ISV of salinity in the intermediate layer.
|
| Fig.10 Time series of salinity measured by conductivity-temperature-depth (CTD) sensors deployed at depths of 400–800 m (a); PSD of salinity from mooring (b) and HYCOM (c) data, respectively; temperature (blue line), salinity (red line) and meridional velocity (green line) measured at the depth of 550 m at the mooring site (d) |
The IW to the east of Taiwan, China, comprises North Pacific Intermediate Water (NPIW), Kuroshio Intermediate Water (KIW), and South China Sea Intermediate Water (SCSIW). Earlier research has also confirmed that NPIW has a salinity minimum (Smin) of around 34.10–34.20 (Talley, 1993), whereas KIW and SCSIW have Smin values of 34.31 and 34.40, respectively. The IW Smin of 34.15–34.36 has strong ISV with a peak-to-peak structure (Fig. 10a). Moreover, strong (weak) meridional velocity corresponds to higher (lower) IW salinity.
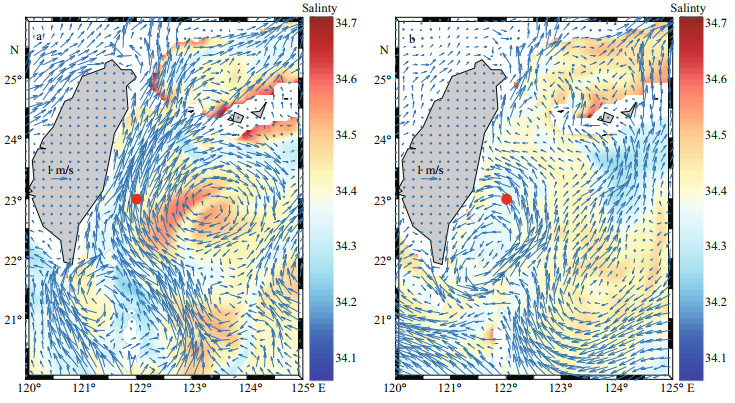
To explore salinity variations, horizontal and vertical movements of IW were examined. Time series of temperature, salinity, and meridional velocity at the depth of 550 m are shown in Fig. 10d. Temperature, salinity, and meridional velocity peak at the same time; correlation coefficient between temperature and salinity is 0.62, indicating the presence of synchronous variations throughout the water column. Composite maps of HYCOM simulated circulation and salinity averaged over depths of 400–600 m show that horizontal flow fields and salinity distribution during periods with anticyclonic eddies are clearly different from those during periods with cyclonic eddies (Fig. 11a & b). At the time of anticyclonic eddies, salinity to the east of Taiwan, China, is clearly higher with a value of 34.5, which is close to the salinity of KIW. At the time of cyclonic eddies, salinity is lower with a value of about 34.3, which is closer to the salinity of NPIW.
|
| Fig.11 Composite maps of Hybrid Coordinate Ocean Model (HYCOM) simulated salinity (color shading) and HYCOM simulated circulation (blue arrows) averaged over depths of 400–600 m during periods with anticyclonic (a) and cyclonic (b) eddies There are different horizontal flow fields and salinity distributions in (a) and (b). Location of mooring site is indicated by red dot. |
As discussed, a larger (smaller) meridional velocity corresponds to an increase (decrease) in salinity of the IW via the following mechanism. Water in the anticyclonic eddy is relatively warm; it causes downwelling, which transfers water with higher salinity to the intermediate layer and exchanges with the IW. Thus, warm water corresponds to higher salinity. Furthermore, an anticyclonic eddy accelerates the Kuroshio, which means that circulation at depth, e.g. 600 m, could be similar to that at the surface. This enhances KIW intrusion to the east of Taiwan, China, which increases IW salinity through horizontal movement. In contrast, a cold cyclonic eddy corresponds to upwelling, which carries the low salinity core upward, maintaining the low salinity of the IW in the vertical. In the horizontal, a cyclonic eddy weakens the Kuroshio and reduces the intrusion of the KIW to the north. A cyclonic eddy transfers more NPIW into the region east of Taiwan, China, and thus the Smin characteristics of the IW become closer to those of the NPIW.
5 CONCLUSIONData acquired by a subsurface mooring between January 2016 to May 2017 at different depths were used in this study to examine the variability and mean velocity structure of the Kuroshio to the east of Taiwan, China. The Kuroshio is a strong northward flow mainly located in the upper 400 m. Maximum velocities can reach up to 1.0 m/s and are found at the depth of about 100 m. Power spectrum analysis reveals ISV with a period of 70–95 d in the upper 800 m. Satellite data show variations of local SLA with a period of approximately 85 d. Lag correlation analysis proves that westward propagating eddies are controlling factor of the Kuroshio ISV east of Taiwan, China. Using altimetry data, we estimated that eddies propagate westward at an average speed of approximately 10 cm/s, which is consistent with results from other studies.
The CTD data acquired at the mooring site at depths of 400–800 m also show strong intraseasonal signals in the IW. Using observation and HYCOM assimilation data, horizontal and vertical movements of IW during periods of cyclonic and anticyclonic eddies were examined.
To elucidate the different impacts of cyclonic and anticyclonic eddies on the Kuroshio, we calculated the flow, PV, and potential density distributions using HYCOM data. Cyclonic (anticyclonic) eddies from the Subtropical Countercurrent cause a negative (positive) sea surface height anomaly, contribute positive (negative) PV, and lead to a decrease (increase) in the northward velocity. Cyclonic (anticyclonic) eddies also lead to stronger (weaker) vertical stratification in the upper ocean. A smaller (larger) angle of the isopycnal slope corresponds to lower (higher) Kuroshio velocity, displacement of the center of the velocity core further inshore (offshore), and a narrower (wider) current.
6 DATA AVAILABILITY STATEMENTThe datasets generated during and/or analyzed during the current study are available from the corresponding author on reasonable request.
7 ACKNOWLEDGMENTThe authors wish to express their sincere gratitude to the crew of R/V Science as well as to all the scientists and technicians involved in the deployment and/or retrieval of the subsurface mooring that provided these valuable data. The provision of satellite data by AVISO and assimilation data from HYCOM is also greatly appreciated.
Book J W, Wimbush M, Imawaki S, Ichikawa H, Uchida H, Kinoshita H. 2002. Kuroshio temporal and spatial variations south of Japan determined from inverted echo sounder measurements. Journal of Geophysical Research:Oceans, 107(C9): 3 121.
DOI:10.1029/2001JC000795 |
Chang M H, Jan S, Mensah V, Andres M, Rainville L, Yang Y J, Cheng Y H. 2018. Zonal migration and transport variations of the Kuroshio east of Taiwan induced by eddy impingements. Deep Sea Research Part Ⅰ:Oceanographic Research Papers, 131: 1-15.
DOI:10.1016/j.dsr.2017.11.006 |
Chang Y L, Miyazawa Y, Guo X Y. 2015. Effects of the STCC eddies on the Kuroshio based on the 20-year JCOPE2 reanalysis results. Progress in Oceanography, 135: 64-76.
DOI:10.1016/j.pocean.2015.04.006 |
Chang Y L, Oey L Y. 2011. Interannual and seasonal variations of Kuroshio transport east of Taiwan inferred from 29 years of tide-gauge data. Geophysical Research Letters, 38(8): L08603.
|
Chelton D B, Schlax M G, Samelson R M. 2011. Global observations of nonlinear mesoscale eddies. Progress in Oceanography, 91(2): 167-216.
DOI:10.1016/j.pocean.2011.01.002 |
Chelton D B, Schlax M G. 1996. Global observations of oceanic Rossby waves. Science, 272(5259): 234-238.
DOI:10.1126/science.272.5259.234 |
Chuang W S, Liang W D. 1994. Seasonal variability of intrusion of the Kuroshio water across the continental shelf northeast of Taiwan. Journal of Oceanography, 50(5): 531-542.
DOI:10.1007/BF02235422 |
Gawarkiewicz G, Jan S, Lermusiaux P F J, McClean J L, Centurioni L, Taylor K, Cornuelle B, Duda T F, Wang J, Yang Y J, Sanford T, Lien R C, Lee C, Lee M A, Leslie W, Haley P J Jr, Niiler P P, Gopalakrishnan G, Velez-Belchi P, Lee D K, Kim Y Y. 2011. Circulation and intrusions northeast of Taiwan:chasing and predicting uncertainty in the cold dome. Oceanography, 24(4): 110-121.
DOI:10.5670/oceanog.2011.99 |
Hsin Y C, Qiu B, Chiang T L, Wu C R. 2013. Seasonal to interannual variations in the intensity and central position of the surface Kuroshio east of Taiwan. Journal of Geophysical Research:Oceans, 118(9): 4 305-4 316, https://doi.org/10.1002/jgrc.20323..
DOI:10.1002/jgrc.20323 |
Hsin Y C, Qu T, Wu C R. 2010. Intra-seasonal variation of the Kuroshio southeast of Taiwan and its possible forcing mechanism. Ocean Dynamics, 60(5): 1 293-1 306.
DOI:10.1007/s10236-010-0294-2 |
Hsin Y C, Wu C R, Shaw P T. 2008. Spatial and temporal variations of the Kuroshio East of Taiwan, 1982-2005:a numerical study. Journal of Geophysical Research:Oceans, 113(C4): C04002.
DOI:10.1029/2007JC004485 |
Jan S, Yang Y J, Wang J, Mensah V, Kuo T H, Chiou M D, Chern C S, Chang M H, Chien H. 2015. Large variability of the Kuroshio at 23. 75°N East of Taiwan. Journal of Geophysical Research:Oceans, 120(3): 1 825-1 840.
DOI:10.1002/2014JC010614 |
Kwon Y O, Alexander M A, Bond N A, Frankignoul C, Nakamura H, Qiu B, Thompson L. 2010. Role of the Gulf Stream and Kuroshio-Oyashio systems in large-scale atmosphere-ocean interaction:a review. Journal of Climate, 23(12): 3 249-3 281.
DOI:10.1175/2010JCLI3343.1 |
Lau W K M, Waliser D E. 2005. Intraseasonal Variability in the Atmosphere-Ocean Climate System. Springer Verlag, Berlin. p.464.
|
Lee T N, Johns W E, Liu C T, Zhang D X, Zantopp R, Yang Y. 2001. Mean transport and seasonal cycle of the Kuroshio east of Taiwan with comparison to the Florida Current. Journal of Geophysical Research:Oceans, 106(C10): 22 143-22 158.
DOI:10.1029/2000JC000535 |
Lien R C, Ma B, Cheng Y H, Ho C R, Qiu B, Lee C M, Chang M H. 2014. Modulation of Kuroshio transport by mesoscale eddies at the Luzon Strait entrance. Journal of Geophysical Research:Oceans, 119(4): 2 129-2 142.
DOI:10.1002/2013JC009548 |
Mensah V, Jan S, Chang M H, Yang Y J. 2015. Intraseasonal to seasonal variability of the intermediate waters along the Kuroshio path East of Taiwan. Journal of Geophysical Research:Oceans, 120(8): 5 473-5 489.
DOI:10.1002/2015JC010768 |
Nitani H. 1972. Beginning of the Kuroshio. In: Stommel H, Yoshida K eds. Kuroshio, Its Physical Aspects. University of Tokyo Press, Tokyo, Japan. p.129-163.
|
Qiu B, Chen S M. 2010a. Interannual variability of the north pacific subtropical countercurrent and its associated mesoscale eddy field. Journal of Physical Oceanography, 40(1): 213-225.
DOI:10.1175/2009JPO4285.1 |
Qiu B, Chen S M. 2010b. Interannual-to-decadal variability in the bifurcation of the North Equatorial current off the Philippines. Journal of Physical Oceanography, 40(11): 2 525-2 538.
DOI:10.1175/2010JPO4462.1 |
Ramp S R, Colosi J A, Worcester P F, Bahr F L, Heaney K D, Mercer J A, Van Uffelen L J. 2017. Eddy properties in the Subtropical Countercurrent, Western Philippine Sea. Deep Sea Research Part Ⅰ:Oceanographic Research Papers, 125: 11-25.
DOI:10.1016/j.dsr.2017.03.010 |
Shen M L, Tseng Y H, Jan S, Young C C, Chiou M D. 2014. Long-term variability of the Kuroshio transport east of Taiwan and the climate it conveys. Progress in Oceanography, 121: 60-73.
DOI:10.1016/j.pocean.2013.10.009 |
Sun X P. 1987. Analysis of the surface path of the Kuroshio in the East China Sea. In: Sun X ed. Essays on the Investigation of Kuroshio. Ocean Press, Beijing. p.1-14.(in Chinese).
|
Talley L D. 1993. Distribution and Formation of North Pacific Intermediate Water. Journal of Physical Oceanography, 23(3): 517-538.
DOI:10.1175/1520-0485(1993)023<0517:DAFONP>2.0.CO;2 |
Tsai C J, Andres M, Jan S, Mensah V, Sanford T B, Lien R C, Lee C M. 2015. Eddy-Kuroshio interaction processes revealed by mooring observations off Taiwan and Luzon. Geophysical Research Letters, 42(19): 8 098-8 105.
DOI:10.1002/2015GL065814 |
Wu C R, Tang T Y, Lin S F. 2005. Intra-seasonal variation in the velocity field of the northeastern South China Sea. Continental Shelf Research, 25(17): 2 075-2 083.
DOI:10.1016/j.csr.2005.03.005 |
Yang Y, Liu C T, Hu J H, Koga M. 1999. Taiwan current(Kuroshio) and impinging eddies. Journal of Oceanography, 55(5): 609-617.
DOI:10.1023/A:1007892819134 |
Zhang D, Johns W E, Lee T N. 2002. The seasonal cycle of meridional heat transport at 24°N in the North Pacific and in the global ocean. Journal of Geophysical Research:Oceans, 107(C7): 3 083.
DOI:10.1029/2001JC001011 |
Zhang D X, Lee T N, Johns W E, Liu C T, Zantopp R. 2001. The Kuroshio east of Taiwan:modes of variability and relationship to interior ocean mesoscale eddies. Journal of Physical Oceanography, 31(4): 1 054-1 074.
DOI:10.1175/1520-0485(2001)031<1054:TKEOTM>2.0.CO;2 |
 2020, Vol. 38


