 2020, Vol. 38
Institute of Oceanology, Chinese Academy of Sciences
Article Information
- LIANG Sijie, ZHANG Zhongyi, LIU Hang, GUO Li, SUN Shiyang, YANG Guanpin
- Digging out molecular markers associated with low salinity tolerance of Nannochloropsis oceanica through bulked mutant analysis
- Journal of Oceanology and Limnology, 38(6): 1867-1879
- http://dx.doi.org/10.1007/s00343-019-9189-3
Article History
- Received Jul. 22, 2019
- accepted in principle Sep. 9, 2019
- accepted for publication Oct. 16, 2019


2 Key Laboratory of Marine Genetics and Breeding of Ministry of Education, OUC, Qingdao 266003, China;
3 College of Fisheries, OUC, Qingdao 266003, China;
4 Institute of Evolution and Marine Biodiversity, OUC, Qingdao 266003, China
The alternative energy sources of fissile fuel are highly appreciated; the problems associating with the fossil fuel consumption have been becoming serious and serious (Leung et al., 2010). Microalgal biomass is considered as one of the promising energy sources; microalgae grow fast, inhabit a wide range of environments, contain very rich lipids, and are highly efficient in photosynthesis (Wijffels et al., 2010). In addition, microalgae feed a large number of economically and ecologically important animals. They are used also by humans as healthy foods and food additives.
Salt tolerance is one of the most important traits of plants. It is also very important for marine microalgae; the salinity may change their growth and metabolism, thus facilitate the accumulation of bioactive materials. Salinity change aids also to control the enemy organisms met in their cultivation. Organisms must have mechanisms to cope with the salinity change. As the documented, the structural characteristics, metabolic pathways among others have been proposed as the mechanisms underlining the salinity tolerance (Guo and Yang, 2015). However, the genetic mechanism underlining microalgal low salinity tolerance remains unclear.
As a fast growing and oil-producing microalga, Nannochloropsis oceanica is monoploidy and reproduces asexually (Pan et al., 2011; Guo et al., 2019). A N. oceanica strain is usually derived from a single cell. At present, mutation is one of the most commonly used genetic improvement methods for its improvement. Chemical mutation may generate a large number of mutants in a short time, which includes, for example, ethyl methane sulfonate (Chaturvedi and Fujita, 2010) and N-methyl-N'-nitro-N-nitrosoguanidine mutations mutation (Iskandarov et al., 2011; Liang et al., 2017). Chemical mutation often causes single nucleotide polymorphisms (SNPs). Unfortunately, SNPs are not suitable for breeding the fast dividing microalgae like N. oceanica; the existing SNPs may mutate reversely, and a large amount of SNPs may be generate newly each cycle of DNA replication (or cellular division) (Lin et al., 2017, 2018). Toward plateau growth stage, a N. oceanica cell should multiply for hundreds of thousand times (generations), during which a large number of SNPs may be generated newly and the existing ones may change also. In comparison, nucleotide insertions and deletions (InDels) are more stable thus applicable for N. oceanica breeding. At least, InDels will change less during cellular division. Zeocin, a bleomycin antibiotics, is synthesized by Streptomyces verticalis, which causes double strand breaks (DBS) of DNA like physical irradiations and introduces InDels during DNA repairing (Todorova et al., 2005). Its mutation effect has been proved in N. oceanica previously (Lin et al., 2017, 2018).
Since its establishment (Klein et al., 2005), genome-wide association study (GWAS) has evolved as a very important method of determining the relationship between marker (gene) and trait in a wide range of organisms. GWAS is effective to decipher the genetic basis of traits; however genotyping a large cohort of individuals is still expensive (Steemers et al., 2006; Fu et al., 2010). In order to determine the relationship between marker (gene) and trait at low costs, the bulk segregant analysis (BSA) has been developed, which genotypes phenotypically pooled individuals rather than individuals one by one (Michelmore et al., 1991). BSA can adopt diverse types of genetic markers, including, for example, randomly amplified polymorphisms of DNA (RAPD), restriction fragment length polymorphism (RFLP), simple sequence repeat (SSR or microsatellite) among others. In companion with the highly developed massively parallel sequencing technologies, SNP, InDel, the coly number of genes among others has been widely adopted by BSA in recent years. Modified from BSA, similar strategies like MutMap (Abe et al., 2012), QTL-seq (Takagi et al., 2013a), MutMap+ (Fekih et al., 2013), MutMap-Gap (Takagi et al., 2013b) and Graded Pool-seq mapping (GPS) (Wang et al., 2019) have also been developed and used. For the monoploidy N. oceanica, the BSA has been modified into bulked mutant analysis (BMA) to decipher its genetic basis of fast growth performance (Liang et al., 2019)
In order to breed elite strains of N. oceanica for cultivation, genetic engineering (Wei et al., 2017b, 2019; Xin et al., 2017, 2019), RNA interference (Wei et al., 2017a) and genome editing (Poliner et al., 2018a, b ; Wang et al., 2016) techniques have been tentatively used in this species. All these early trials target known genes. In this study, we mutated N. oceanica with Zeocin and generated a collection of InDel-containing mutants first, and then genotyped the bulked Zeocin mutants of N. oceanica tolerant to different salinities by whole genome resequencing, aiming to decipher the genetic basis underlining the low salinity tolerance of N. oceanica.
2 MATERIAL AND METHOD 2.1 Zeocin mutation and mutant bulkingIn the exponential growth period, N. oceanica was mutated with Zeocin under the irradiation of 70 mol/ (m2·s) (12 h:12 h) for two days (the average dividing time). The algal cell density was 107 cells/mL, and the concentration of Zeocin was 4 μg/mL. The cells were washed with PBS, suspended in f/2 medium, and incubated in dark overnight. The cells were spread on solid medium with continuously decreasing salinity from f/2 prepared with seawater to BG11 prepared with freshwater. The salinity was changed by replacing f/2 with BG11 step by step, from 0 to 48%, 8% each step; from 48% to 80%, 4% each step; from 80% to 90%, 2% each step; and from 90% to 95%, 1% each step. In 30 days and under the irradiation of 70 mol/(m2·s)(12 h : 12 h), the algal colonies appeared and were counted. The algal colonies on the solid medium containing 0 (control), 56%, 80%, 90% and 93% BG11, respectively, were picked out and amplified in the liquid medium containing the corresponding percentage of BG11. On day twelve, 100 mutants each percentage were randomly selected and combined at approximately equal number of cells (volume in mL×OD750) into 5 bulks (F0, F56, F80, F90, and F93), and used to isolate DNA.
2.2 DNA extraction and BMAThe algal cells each bulk were collected through centrifugation. The DNA was isolated with HP Plant DNA Kit (OMEGA Bio-Tek, USA) following the manufacturer's instructions. The DNA was randomly fragmented with those in desirable lengths recovered after separation through agarose gel electrophoresis. The sequencing library was prepared by fixing the joint primers to the fragments and through PCR amplification and sequenced on an Illumina seq-2000 platform. Raw reads were processed with Perl scripts to filtrate those either contaminated by adaptors or contained > 5% of N or > 50% of nucleotides with Phred quality value < 19. The clean reads were mapped onto the reference genome using the Burrows-Wheeler Aligner (BWA 0.7.12; Li and Durbin, 2009a). The mapped reads were sorted with Samtools V1.2 (Li et al., 2009b) with the duplicated resulting from PCR and the multiple mapped discarded using MarkDuplicates software implemented in Picard Tools V1.13 (http://broadinstitute.github.io/picard/). Statistics was carried out with in house perl script. Our own assemble of N. oceanica genome (GenBank accession numbers CPO38106–CPO38137; Guo et al., 2019) was used as the reference. The Genome Analysis Toolkit (GATK; McKenna et al., 2010) was used for SNP and InDel calling via local re-assembly of haplotypes for population. The unqualified SNP and InDel were filtered with GATK software if their QD < 2.0, ReadPosRankSum <-8.0, FS > 60.0, QUAL < 30.0, DP < 4.0 (for SNP); QD < 2.0, ReadPosRankSum <-20.0, FS > 200.0, QUAL < 30.0, DP < 4.0 (for InDel). The genes containing these markers or around these markers were annotated using ANNOVAR (Wang et al., 2010).
In order to determine the relationship between variations and phenotype, we first calculated the SNP-index for all the variants (Takagi et al., 2013a). For each SNP, the chi-square test was performed using the colony frequency transformed by multiplying the allele frequency with the number of colonies (100 each bulk). The frequencies of individuals between two bulks were tested, and the frequencies were believed to be significantly different if P < 0.01. The Manhattan map was drawn with the position of chromosome as the horizontal axis and -log10(P-value) as the vertical one. A gene in which greater than or equal to one associating markers located was believed to control the trait, which was hung on to be verified functionally in future with the tools available currently. If an associating site was intergenic, then the genes within upstream and downstream 5 kb if any were proposed to control the trait. Similarly, these genes should be functionally verified in future. The same strategy was adopted to process the InDel data.
The majority of SNP detected in this study appeared as two nucleotides, i.e. only two nucleotides were detected each SNP site. Once more than two nucleotides appeared at a site, they were dichotomized into the original and the mutated, with the mutated combined and used in analysis. In other words, all SNP were counted as two alleles, the original and the mutated. The InDel may overlap and be adjacent in position, and be different in sequence even at the same position. We treated these InDel in a way similar to what we did for SNP, combining the overlapped, the adjacent in position and the polymorphic in sequence, dichotomizing them into two alleles, the original and the mutated, and used in analysis. The original allele is usually identical to that in reference genome. At extremely low possibilities, not all alleles at a site may be the original, which was discarded; they cannot be dichotomized absolutely.
3 RESULT 3.1 Construction of mutant bulksThe number of mutant colonies on the solid f/2 medium was counted and documented as the control survival rate (100%). When the percentage of BG11 medium increased, the survival rate decreased gradually. When the percentage of BG11 medium reached 56%, the survival rate of mutants started to decrease dramatically. When the percentage of BG11 medium reached 90%, the survival rate of mutants was only 12.5%. The lethal percentage of BG11 medium to the mutants was 94% at which no mutant grew out (Fig. 1). We selected the mutant colonies at 0%, 56%, 80%, 90%, and 93% of BG11, 100 each percentage, amplified them and combined them at equal cell number to construct mutant bulks.

|
| Fig.1 Survival rate of N. oceanica mutants at different percentages of BG11 medium |
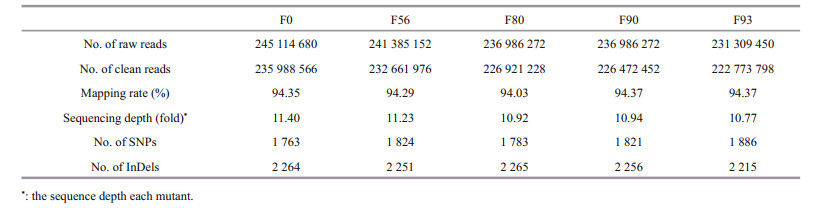
By whole genome resequencing, the bulks were genotyped (Table 1). In average, 238 413 158 raw reads and 228 963 604 clean reads were obtained for all bulks, and such numbers were similar among bulks. The sequencing depth reached 1 105.1 folds (total length/genome size) each bulk and 11.1 folds (1 105.2 folds/100 mutants) each mutant in average. In average, 1 815.4 SNPs and 2 250.2 InDels were identified each bulk. It was very interesting to note that the numbers of SNPs and InDels were highly similar among bulks, varying between 1 763 and 1 886 and between 2 215 and 2 265, respectively, and the differences in the numbers of SNPs and InDels were 123 and 14, respectively. Before identifying the low salinity tolerance associating SNPs and InDels, we have a prejudiced understanding by the first impression that increasing the intensity of selection may aid to focus on less numbers of SNPs and InDels. Zooming in the molecular markers identified between F56 and F0, F80 and F0, F90 and F0 and F93 and F0, it was found that they were similar. It was clear that such prejudice should be rejected in mutant selection practice.
|
The most difference in low salinity tolerance existed between bulks F0 (control, the highest salinity) and F93 (the lowest salinity). In order to imitate GWAS basing on "case-control" data set, we transformed the allele frequency into the colony frequency each allele each bulk, and identified the associating markers according to the P value of chi-square testing. In total, 47 SNPs were found to associate with the low salinity tolerance (Fig. 2a). These SNP scattered on 15 chromosomes (Table 2). Twenty proteins encoding genes were identified around these SNPs. At position 13 041 of chromosome 9 and 384 767 and 384 773 of chromosome 30, two nonsynonymous mutations were detected, which located in the genes encoding serine-protein kinase atm and zinc metalloendopeptidase, respectively, while all other mutations were intergenic. Around the intergenic SNPs, a set of known proteins were identified (Table 2).


|
| Fig.2 Manhattan plots showing the value of -log10(P of χ2 test) of colony frequency difference between F0 and F56 The colony frequency is transformed from SNP (a) and InDel (b). The horizontal dash line indicates the P-value of χ2 test=0.01. |
In total, 112 InDels were found to associate significantly with the low salinity tolerance of N. oceanica (Fig. 2b). These InDel scattered on 28 chromosomes (Table 3), and located in exons, introns and the spacers between genes. These InDels may control or influence the expression of 74 genes encoding proteins with known functions. There were 7 InDels in exons, 4 of them caused frameshift deletion (sites 1 251 405 of chromosome 5 607 636 of chromosome 6 250 955 of chromosome 16 and 5 554 of chromosome 28). The number of InDels was more than that of SNPs, proving that Zeocin is a very efficient mutagen. Since SNP are not stable for breeding thus may not applicable for fast dividing protist like N. oceanica, we prefer to generate rich InDels through Zeocin mutation first and then carry out genetic studies with mutant populations.

We have a working hypothesis that the associating markers and the genes around them repeatedly identified between the control and different bulks constructed at different intensities of selection should play core roles in mediating low salinity tolerance. This hypothesis is enlightened by the idea that the genes expressed in different tissues play roles upstream a physiological cascade (Guo et al., 2016). In total, 32 associating genes were identified simultaneously between F0 and F56, F0 and F80, F0 and F90 and F0 and F93. Of these genes, 17 have been functional annotated (Table 4).

A set of genes were found to function in gene expression, which included serine threonine protein kinase endoribonuclease ire1, anaphase-promoting complex subunit 8 and transcriptional coactivator pterin dehydratase. Two genes, gtp-binding protein and hbs1-like protein, were found to associate with the metabolism of GTP. Tubulin beta and ankyrin repeat-containing protein relate to cellular structure while zinc metalloendopeptidase controls mitochondrial quality, regulates lipid metabolism and maintains energy expenditure under stress conditions (Head et al., 2009). This common set of genes indicated that the genes functioning in gene expression, energy metabolism and cellular structure were associate with the low salinity tolerance of N. oceanica.
4 DISCUSSIONThe genetic study in N. oceanica is scarce. To our knowledge, no genetic basis of its economical and biological traits has been figured out, and no gene has been isolated from scratch (de novo cloned). Changing medium salinity should aid to control the enemy organisms met during its cultivation. As a stress, shifting from the normal salinity to the low one may also facilitate accumulating fatty acids. To these understanding, we generated a population of mutants through Zeocin mutation and deciphered the genetic basis of the low salinity tolerance of N. oceanica with bulked mutant analysis newly, a method modified from bulked segregant analysis ourselves (Liang et al., 2019). Sets of SNPs and InDels and genes either holding these markers or locating around them were found to associate with the low salinity tolerance. A set of annotatable genes commonly found between control and different salinities revealed that the genes functioning in gene expression, energy metabolism and cellular structure are involved in the low salinity tolerance. These associating molecular markers and genes around them should aid to the genetic improvement of N. oceanica.
These markers and genes around them provided us the clues of the biochemical processes relating to the low salinity tolerance of N. oceanica; unfortunately these clues were not verified by the real functions of annotatable proteins and the associating markers. We believed that the functional verification of the new functions of annotatable proteins and the roles played by SNPs and InDels will certainly deepen our understanding of the low salinity tolerance of N. oceanica.
Deciphering the genetic basis of the low salinity tolerance is our second trial following that of the fast growth performance (Liang et al., 2019). The highly appreciated works in future include (1) functional verifications of these associating makers and the genes with the genome modifying tools like genome editing techniques using Cas9 (Baek et al., 2016) and Cpf1 (Ferenczia et al., 2017) available for N. oceanica; (2) understanding the relationship among these markers and genes according to chromatin interaction information (Sandhu et al., 2011; Visscher et al., 2017) which can be revealed by the third generation sequencing platform based Hi-C technique (Dekker et al., 2002; Belton et al., 2012; Gibcus and Dekker, 2013).
Bulked segregant analysis (BSA) has been widely used in diploidy rice, soybean, among others. BSA has been modified into bulked mutant analysis (BMA) for the first time and used in haploidy N. oceanica to decipher the genetic basis of fast growth performance (Liang et al., 2019). In this study, BMA was used to dig out the associating markers of low salinity tolerance of this microalga. As we did early, we introduced stable variations (InDels) by mutating the single cell derived population of N. oceanica cells. As we proposed early, such population is consisted of cells with different SNP genotypes. Once the condition changed, one of these cells may success into the dominant, adapting the changed environments. The SNPs in such population may mutate reversely and the new SNPs may form during fast DNA replication and cell division. In order to overcome the disadvantages of SNPs, we introduced InDels into the population using Zeocin as the mutagen. More number of InDels were found among mutant bulks in this study, suggesting that our mutation was close to saturation and InDels along were appropriate for BMA. With priorities, InDels should be used in GWAS of microalgae.
The mutant population was comparable with a natural population in which GWAS is applicable (Yang et al., 2015). As one of diverse approaches, GWAS uses chi-square test to screen SNPs and InDels based on "case-control" datasets. We transformed the allele frequency each bulk into individual frequency each bulk in order to adopt chi-square test in this study. However, other data processing methods are also appreciated.
5 CONCLUSIONIn this study, a large number of mutants were obtained by mutating N. oceanica with Zeocin. Five mutant bulks were constructed at different salinities of selection. Through bulked mutant analysis (BMA), a set of SNPs and InDels associating with the low salinity tolerance of N. oceanica were dug out, and further a set of genes either containing these markers or being proximate to them were found. From these functional genes, it is still hard to outline the mechanism underlining the low salinity tolerance of N. oceanica due to very limited information; however we may use them to improve N. oceanica.
6 DATA AVAILABILITY STATEMENTThe authors declare that the data supporting the findings of this study are available within the article. The data will be available from the corresponding author on reasonable request.
Abe A, Kosugi S, Yoshida K, Natsume S, Takagi H, Kanzaki H, Matsumura H, Yoshida K, Mitsuoka C, Tamiru M, Innan H, Cano L, Kamoun S, Terauchi R. 2012. Genome sequencing reveals agronomically important loci in rice using MutMap. Nature Biotechnology, 30(2): 174-178.
DOI:10.1038/nbt.2095 |
Baek K, Kim D H, Jeong J, Sim S J, Melis A, Kim J S, Jin F, Bae S. 2016. DNA-free two-gene knockout in Chlamydomonas reinhardtii via CRISPR-Cas9 ribonucleoproteins. Scientific Reports, 6: 30620.
DOI:10.1038/srep30620 |
Belton J M, Mccord R P, Gibcus J H, Naumova N, Zhan Y, Dekker J. 2012. Hi–C: a comprehensive technique to capture the conformation of genomes. Methods, 58(3): 268-276.
DOI:10.1016/j.ymeth.2012.05.001 |
Chaturvedi R, Fujita Y. 2010. Isolation of enhanced eicosapentaenoic acid producing mutants of Nannochloropsis oculata ST-6 using ethyl methane sulfonate induced mutagenesis techniques and their characterization at mRNA transcript level. Phycological Research, 54(3): 208-219.
|
Dekker J, Rippe K, Dekker M, Kleckner N. 2002. Capturing chromosome conformation. Science, 295(5558): 1 306-1 311.
DOI:10.1126/science.1067799 |
Fekih R, Takagi H, Tamiru M, Abe A, Natsume S, Yaegashi H, Sharma S, Sharma S, Kanzaki H, Matsumura H, Saitoh H, Mitsuoka C, Utsushi H, Uemura A, Kanzaki E, Kosugi S, Yoshida K, Cano L, Kamoun S, Terauchi R. 2013. MutMap+: Genetic mapping and mutant identification without crossing in rice. PLoS One, 8(7): e68529.
DOI:10.1371/journal.pone.0068529 |
Ferenczi A, Pyott D E, Xipnitoua A, Molnar A. 2017. Efficient targeted DNA editing and replacement in Chlamydomonas reinhardtii using Cpf1 ribonucleoproteins and single-stranded DNA. Proceedings of the National Academy of Sciences of the United States of America, 114(51): 13 567-13 572.
DOI:10.1073/pnas.1710597114 |
Fu Y, Springer N M, Gerhardt D J, Ying K, Yeh C T, Wu W, Swanson-Wagner R, D'Ascenzo M, Millard T, Freeberg L, Aoyama N, Kitzman J, Burgess D, Richmond T, Albert T J, Barbazuk W B, Jeddeloh J A, Schnable P S. 2010. Repeat subtraction-mediated sequence capture from a complex genome. The Plant Journal, 62(5): 898-909.
DOI:10.1111/j.1365-313X.2010.04196.x |
Gibcus J H, Dekker J. 2013. The hierarchy of the 3D genome. Molecular Cell, 49(5): 773-782.
DOI:10.1016/j.molcel.2013.02.011 |
Guo L, Liang S J, Zhang Z Y, Liu H, Wang S W, Pan K H, Xu J, Ren X, Pei S R, Yang G P. 2019. Genome assembly of Nannochloropsis oceanica provides evidence of host nucleus overthrow by the symbiont nucleus during speciation. Communications Biology, 2: 249.
DOI:10.1038/s42003-019-0500-9 |
Guo L, Wang Y M, Liang S J, Lin G M, Chen S L, Yang G P. 2016. Tissue-overlapping response of half-smooth tongue sole (Cynoglossus semilaevis) to thermostressing based on transcriptome profiles. Gene, 586(1): 97-104.
DOI:10.1016/j.gene.2016.04.020 |
Guo L, Yang G P. 2015. The mechanism of the acclimation of Nannochloropsis oceanica to freshwater deduced from its transcriptome profiles. Journal of Ocean University of China, 14(5): 922-930.
DOI:10.1007/s11802-015-2689-7 |
Head B, Griparic L, Amiri M, Gandre-Babbe S, Van Der Bliek A M. 2009. Inducible proteolytic inactivation of OPA1 mediated by the OMA1 protease in mammalian cells. The Journal of Cell Biology, 187(7): 959-966.
DOI:10.1083/jcb.200906083 |
Iskandarov U, Khozin-Goldberg I, Cohen Z. 2011. Selection of a DGLA-producing mutant of the microalga Parietochloris incisa: I. Identification of mutation site and expression of VLC-PUFA biosynthesis genes. Applied Microbiology and Biotechnology, 90(1): 249-256.
|
Klein R J, Zeiss C, Chew E Y, Tsai J Y, Sackler R S, Haynes C, Henning A K, SanGiovanni J P, Mane S M, Mayne S T, Bracken M B, Ferris F L, Ott J, Barnstable C, Hoh J. 2005. Complement factor H polymorphism in age-related macular degeneration. Science, 308(5720): 385-389.
DOI:10.1126/science.1109557 |
Leung D Y C, Wu X, Leung M K H. 2010. A review on biodiesel production using catalyzed transesterification. Applied Energy, 87(4): 1 083-1 095.
DOI:10.1016/j.apenergy.2009.10.006 |
Li H, Durbin R. 2009a. Fast and accurate short read alignment with Burrows-Wheeler transform. Bioinformatics, 25(14): 1 754-1 760.
DOI:10.1093/bioinformatics/btp324 |
Li H, Handsaker B, Wysoker A, Fennell T, Ruan J, Homer N, Marth G, Abecasis G, Durbin R. 2009b. The sequence alignment/map (SAM) format and SAMtools. Bioinformatics, 25(16): 1 653-1 654.
|
Liang S J, Guo L, Lin G M, Zhang Z Y, Ding H Y, Wang Y M, Yang G P. 2017. Improvement of Nannochloropsis oceanica growth performance through chemical mutation and characterization of fast growth physiology by transcriptome profiling. Chinese Journal of Oceanology and Limnology, 35(4): 792-802.
DOI:10.1007/s00343-017-6023-7 |
Liang S J, Zhang Z Y, Liu H, Guo L, Sun S Y, Yang G P. 2019. Identifying the growth associating genes of Nannochloropsis oceanica by bulked mutant analysis (BMA) and RNA sequencing (BMR-seq). Journal of Applied Phycology: 1-14.
DOI:10.1007/s10811-019-01867-w |
Lin G M, Wang Y M, Guo L, Ding H Y, Hu Y M, Liang S J, Zhang Z Y, Yang G P. 2017. Verification of mutagen function of Zeocin in Nannochloropsis oceanica through transcriptome analysis. Journal of Ocean University of China, 16(3): 501-508.
DOI:10.1007/s11802-017-3231-x |
Lin G M, Zhang Z Y, Guo L, Ding H Y, Yang G P. 2018. Structural variation analysis of mutated Nannochloropsis oceanica caused by Zeocin through genome re-sequencing. Journal of Ocean University of China, 17(5): 1 225-1 230.
DOI:10.1007/s11802-018-3626-3 |
McKenna A, Hanna M, Banks E, Sivachenko A, Cibulskis K, Kernytsky A, Garimella K, Altshuler D, Gabriel S, Daly M, DePristo M A. 2010. The genome analysis toolkit: A map reduce framework for analyzing next-generation DNA sequencing data. Genome Research, 20(9): 1 297-1 303.
DOI:10.1101/gr.107524.110 |
Michelmore R W, Paran I, Kesseli P V. 1991. Identification of markers linked to disease-resistance genes by bulked segregant analysis: a rapid method to detect markers in specific genomic regions by using segregating populations. Proceedings of the National Academy of Sciences of United States of America, 88(21): 9 828-9 832.
DOI:10.1073/pnas.88.21.9828 |
Pan K H, Qin J J, Li S, Dai W K, Zhu B H, Jin Y C, Yu W G, Yang G P, Li D F. 2011. Nuclear monoploidy and asexual propagation of Nannochloropsis oceanica (Eustigmatophyceae) as revealed by its genome sequence. Journal of Phycology, 47(6): 1 425-1 432.
DOI:10.1111/j.1529-8817.2011.01057.x |
Poliner E, Pulman J A, Zienkiewicz K, Childs K, Benning C, Farré E M. 2018b. A toolkit for Nannochloropsis oceanica CCMP1779 enables gene stacking and genetic engineering of the eicosapentaenoic acid pathway for enhanced long-chain polyunsaturated fatty acid production. Plant Biotechnology Journal, 16(1): 298-309.
DOI:10.1111/pbi.12772 |
Poliner E, Takeuchi T, Du Z Y, Benning C, Farré EM. 2018a. Nontransgenic marker-free gene disruption by an episomal CRISPR system in the oleaginous microalga, Nannochloropsis oceanica CCMP1779. ACS Synthetic Biology, 7(4): 962-968.
DOI:10.1021/acssynbio.7b00362 |
Sandhu K S, Li G L, Sung W K, Ruan Y J. 2011. Chromatin interaction networks and higher order architectures of eukaryotic genomes. Journal of Cellular Biochemistry, 112(9): 2 218-2 221.
DOI:10.1002/jcb.23155 |
Steemers F J, Chang W H, Lee G, Barker D L, Shen R, Gunderson K L. 2006. Whole-genome genotyping with the single-base extension assay. Nature Methods, 3(1): 31-33.
DOI:10.1038/nmeth842 |
Takagi H, Abe A, Yoshida K, Kosugi S, Natsume S, Mitsuoka C, Uemura A, Utsushi H, Tamiru M, Takuno S, Innan H, Cano L M, Kamoun S, Terauchi R. 2013a. QTL-seq: Rapid mapping of quantitative trait loci in rice by whole genome resequencing of DNA from two bulked populations. The Plant Journal, 74(1): 174-183.
DOI:10.1111/tpj.12105 |
Takagi H, Uemura A, Yaegashi H, Tamiru M, Abe A, Mitsuoka C, Utsushi H, Natsume S, Kanzaki H, Matsumura H, Saitoh H, Yoshida K, Cano L M, Kamoun S, Terauchi R. 2013b. MutMap-Gap: whole-genome resequencing of mutant F2 progeny bulk combined with de novo assembly of gap regions identifies the rice blast resistance gene Pii. New Phytologist, 200(1): 276-283.
DOI:10.1111/nph.12369 |
Todorova T, Miteva D, Chankova S. 2005. DNA damaging effect of zeocin and methyl methanesulfonate in Saccharomyces Cerevisiae measured by CFGE. Comptes Rendus De L'Academie Bulgare Des Sciences, 68(1): 71-78.
|
Visscher P M, Wray N R, Zhang Q, Sklar P, McCarthy M I, Brown M A, Yang J. 2017. 10 years of GWAS discovery: Biology, function, and translation. The American Journal of Human Genetics, 101(1): 5-22.
DOI:10.1016/j.ajhg.2017.06.005 |
Wang C S, Tang S C, Zhan Q L, Hou Q Q, Zhao Y, Zhao Q, Feng Q, Zhou C C, Lyu D F, Cui L L, Li Y, Miao J S, Zhu C R, Lu Y Q, Wang Y C, Wang Z Q, Zhu J J, Shangguan Y Y, Gong J Y, Yang S H, Wang W Q, Zhang J F, Xie H A, Huang X H, Han B. 2019. Dissecting a heterotic gene through Graded Pool-seq mapping informs a rice-improvement strategy. Nature Communications, 10: 2 982.
DOI:10.1038/s41467-019-11017-y |
Wang L K, Feng Z X, Wang X, Wang X W, Zhang X G. 2010. DEGseq: an R package for identifying differentially expressed genes from RNA-seq data. Bioinformatics, 26(1): 136-138.
DOI:10.1093/bioinformatics/btp612 |
Wang Q T, Lu Y D, Xin Y, Wei L, Huang S, Xu J. 2016. Genome editing of model oleaginous microalgae Nannochloropsis spp. by CRISPR/Cas9. The Plant Journal, 88(6): 1 071-1 081.
DOI:10.1111/tpj.13307 |
Wei L, Shen C, El Hajjami M, You W X, Wang Q T, Zhang P, Jia Y T, Hu H H, Hu Q, Poetsch A, Xu J. 2019. Knockdown of carbonate anhydrase elevates Nannochloropsis productivity at high CO2 level. Metabolic Engineering, 54: 96-108.
DOI:10.1016/j.ymben.2019.03.004 |
Wei L, Wang Q T, Xin Y, Lu Y D, Xu J. 2017b. Enhancing photosynthetic biomass productivity of industrial oleaginous microalgae by overexpression of RuBisCO activase. Algal Research, 27: 366-375.
DOI:10.1016/j.algal.2017.07.023 |
Wei L, Xin Y, Wang Q T, Yang J, Hu H H, Xu J. 2017a. RNAi-based targeted gene knockdown in the model oleaginous microalgae Nannochloropsis oceanica. The Plant Journal, 89(6): 1 236-1 250.
DOI:10.1111/tpj.13411 |
Wijffels R H, Barbosa M J. 2010. An outlook on microalgal biofuels. Science, 329(5993): 796-799.
DOI:10.1126/science.1189003 |
Xin Y, Lu Y D, Lee Y Y, Wei L, Jia J, Wang Q T, Wang D M, Bai F L, Hu H H, Hu Q, Liu J, Li Y T, Xu J. 2017. Producing designer oils in industrial microalgae by rational modulation of co-evolving type-2 diacylglycerol acyltransferases. Molecular Plant, 10(12): 1 523-1 539.
DOI:10.1016/j.molp.2017.10.011 |
Xin Y, Shen C, She Y T, Chen H, Wang C, Wei L, Yoon K, Han D X, Hu Q, Xu J. 2019. Biosynthesis of triacylglycerol molecules with a tailored PUFA profile in industrial microalgae. Molecular Plant, 12(4): 474-488.
DOI:10.1016/j.molp.2018.12.007 |
Yang J L, Jiang H Y, Yeh C T, Yu J M, Jeddeloh J A, Nettleton D, Schnable P S. 2015. Extreme-phenotype genome-wide association study (XP-GWAS): A method for identifying trait-associated variants by sequencing pools of individuals selected from a diversity panel. The Plant Journal, 84(3): 587-596.
DOI:10.1111/tpj.13029 |