 2020, Vol. 38
Institute of Oceanology, Chinese Academy of Sciences
Article Information
- SHI Yongchuang, HUA Chuanxiang, ZHU Qingcheng, HUANG Shuolin, FENG Huili
- Applying the Catch-MSY model to the stock assessment of the northwestern Pacific saury Cololabis Saira
- Journal of Oceanology and Limnology, 38(6): 1945-1955
- http://dx.doi.org/10.1007/s00343-019-9156-z
Article History
- Received Jun. 6, 2019
- accepted in principle Aug. 6, 2019
- accepted for publication Oct. 5, 2019


2 College of Marine Sciences, Shanghai Ocean University, Shanghai 201306, China;
3 National Engineering Research Center for Pelagic Fishery, Shanghai 201306, China;
4 Key Laboratory of Sustainable Exploitation of Oceanic Fisheries Resources, Ministry of Education, Shanghai 201306, China;
5 Institute of Marine Policy & Law, Shanghai Ocean University, Shanghai 201306, China
The Pacific saury (Cololabis saira) is one of the most commercially important pelagic species in the northwest Pacific Ocean (NPO) (Sun et al., 2003; Tian et al., 2004). Japanese fisheries initially exploited the species in the early 1950s, and in recent years, most catches of the Pacific saury are from Japan, Russia, South Korea, and China (including Taiwan, China); the total catch has been increasing since 1990s from 15.8×10⁴ t in 1998, 16.0×10⁴ t in 1999 to 60.7×10⁴ t in 2008 and 62.1×10⁴ t in 2014 (Suyama et al., 2012; North Pacific Fisheries Commission (NPFC), 2017; Shi et al., 2018). According to the FAO (2016), the total catch of the Pacific saury was 62.16×10⁴ t, accounting for 2.83% of the NPO (2 196.77×10⁴ t). In 2003, fleets of mainland China began exploratory fishing to investigate the abundance of the Pacific saury in the NPO and the number of fishing vessels reached 44 in 2014 (Yang et al., 2005; Yu et al., 2006). The annual catch of the Pacific saury by Chinese fleets varied from 2.32×10⁴ t in 2013 to 6.30×10⁴ t in 2016, with an average of 5.27×10⁴ t, which accounted for 11.85% of the global production (FAO, 2016). The Pacific saury is a short-lived species, and its yearly biomass is influenced by environmental variables in the NPO. Sakurai et al. (2000) suggested that the effects of physical and biological environmental variables on spawning and nursery grounds played a significant role in recruitment success and contributed to variations in the stock abundance of short-lived species such as the Pacific saury. Iwahashi et al. (2006) observed that both the locations and spawning intensities change every season, and sea surface temperature (SST) is one of the most important factors on the spawning ground locations of the Pacific saury. Ito et al. (2004) also stated that changes in the SST could directly affect the Pacific saury through bioenergetics and movement. With the global development of Pacific saury fisheries, the number of fishing vessels has been increasing, and Pacific saury fisheries have become an important part of the northwestern Pacific fishery industry. Meanwhile, because of the effects of increasing fishing efforts, marine environment, and climate change, Pacific saury resources fluctuated, and fishing production has undergone annual changes (Tian et al., 2003; Nakaya et al., 2010; Shi et al., 2019). The NPFC established the Pacific saury working group in 2015 and listed the Pacific saury as a priority species (Zavolokin, 2018). Thus, the conservation and scientific management of Pacific saury resources have attracted widespread attention from scholars of global fishery resources, and it is necessary to determine appropriate methods for estimating the maximum sustainable yield (MSY) for this noteworthy species.
A precise stock assessment of the Pacific saury will contribute to the sustainable development of its commercial fishery, resource management, and oceanic ecosystem studies (Jiao et al., 2011; Punt et al., 2011; Guan et al., 2016). However, the lack of long-term sequence age structure data and imperfect biological research make it difficult to evaluate the stock status of the Pacific saury using standard stock assessment models (Magnusson et al., 2007; Punt, 2011; Wang et al., 2016). Since the quality of fishery statistics cannot be solved in a short period of time, regional fisheries management organizations have determined that the data-poor approach is an appropriate research direction for the MSY estimation of data-limited fisheries (Restrepo et al., 1998; Carruthers et al., 2014).
Catch-based methods are widely used for data-poor fisheries. For example, the purpose of depletion-corrected average catch (DCAC) is to estimate yields. DCAC is a one-parameter production model that is facilitated by supplementary information on quantities. This model was constructed based on the potential yield formula of Alverson and Pereyra (1969) and was improved by MacCall (2009). The performance and application of the DCAC model was tested by Wetzel and Punt (2011), Carruthers et al. (2014), and Arnold and Heppel (2015). Further, the depletion-based modification of a stochastic-stock-reduction analysis (DB-SRA) was developed by Dick and MacCall (2011); however, it required knowledge of the entire exploitation history. The application of the model considerably improves the understanding of current stock biomass and potential productivity (Dick and MacCall, 2011). Nonetheless, both the DCAC and the DB-SRA were limited in that these models are not suitable for species that suffer from higher natural mortality, such as small, fast-growing, or annual fishes (MacCall, 2009). Unfortunately, the Pacific saury is a short-lived species with a typical lifespan of less than two years. In 2013, Martell and Froese designed the Catch-MSY model, which utilizes resilience for data-poor stocks, and tested it on 146 stocks. The authors concluded that the method's estimates for the MSY were fairly robust and agreed with the MSY estimates derived from full stock assessments. Further, the Catch-MSY method requires lesser data compared to other methods (Froese et al., 2012; Chrysafi and Kuparinen, 2016). Consequently, this model may be a good choice for the MSY estimation of the Pacific saury.
In recent years, relevant studies on fishing gear and methods (Yu et al., 2006; Xia, 2008; Shi et al., 2016, 2018), distribution of fishing grounds (Iwahashi et al., 2006; Hua et al., 2010; Tseng et al., 2013), and basic biology (Zhang et al., 2013) of the Pacific saury have been conducted. However, the stock of Pacific saury in the NPO still lacks a scientific stock assessment. This study used the Catch-MSY method to estimate the MSY of the Pacific saury stock in the NPO. The sensitivity of the model parameters was analyzed with biological information. Subsequently, management suggestions were proposed based on the results, thereby providing sound theoretical support for the development and management of Pacific saury fishery.
2 DATA AND METHOD 2.1 Fishery dataThe catch data used in this study were downloaded from the NPFC Yearbook (NPFC, 2018). The time series of catches are from 1950 to 2016. The catch data trend of the Pacific saury is shown in Fig. 1.

|
| Fig.1 Trend of Pacific saury catches in the NPO |
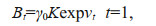
In this study, the Catch-MSY model is based on the Schaefer production model, which was developed to calculate annual biomass (Schaefer, 1991). The basic biomass dynamics are governed by Eqs.1 and 2:
 (1)
(1)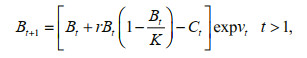 (2)
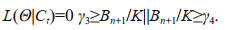
(2)where Bt+1 is the biomass in the subsequent year t+1, Bt is the current biomass, and Ct is the catch in year t, K denotes the carrying capacity of the stock habitat, and r means the intrinsic rate of increase. A lognormal process error structure was assumed, and vt was independent and identically distributed normal with mean 0 and variance σ2. γ0 is the initial depletion level (B1/K) and is usually assumed to be γ0=1 if it is an unexploited stock.
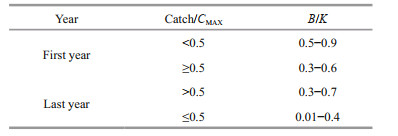
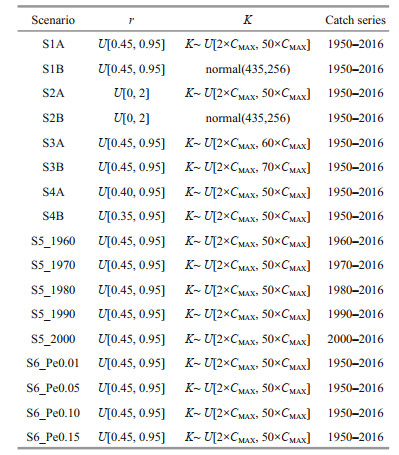
The ranges of the initial and current depletion levels should be specified in the Catch-MSY model. In this study, we derived default ranges of relative biomass in the first and last years of the time series (Froese et al., 2012), as shown in Table 1. For the first year, if the ratio of catch to maximum catch is below 0.5, the range of B/K(γ1, γ2) is 0.5–0.9; otherwise, the range of B/K is 0.3–0.6. For the final year, the range of B/K(γ3, γ4) is 0.01–0.4 if the ratio of catch to maximum catch is below 0.5; otherwise, it is 0.3–0.7.
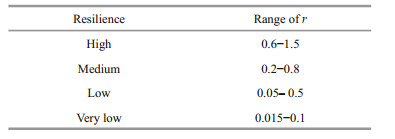
To determine prior information of r parameters for the species under assessment, the proxies for the resilience of the species, as provided in FishBase (Froese and Pauly, 2015), were translated into the r-ranges shown in Table 2. Martell and Froese (2013) suggested that for a specific species, if no other available knowledge regarding r is available, random samples of r could be acquired from Table 2. In this study, based on research by Shi et al. (2019) on the Pacific saury and allowing for uncertainty, the informative prior of r was assigned as U[045, 0.95]. Moreover, the non-informative prior of r was set, and the lower and upper limits of the uniform distribution were assigned as 0 and 2, respectively. Random samples of the carrying capacity parameter (K) were drawn from a uniform distribution wherein the lower and upper limits were given by the maximum catch in the time series and 50 times the maximum catch, respectively. The informative prior of K was set at a normal distribution and denoted by N(435 2562).
For the detection of viable r-K combinations, a random r-K pair was selected from within the prior ranges for r and K. Subsequently, a starting biomass was selected from the prior biomass range for the first year, and Eq.1 or Eq.2 was used to calculate the predicted biomass in subsequent years. In this study, 0 was assigned when the depletion level led to the population exceeding K or going extinct, and 1 was assigned for those results in final depletion level that were between γ3 and γ4. Therefore, the likelihood function of the parameter vector Θ={K, r} can be expressed as follows:
 (3)
(3) (4)
(4)practicable stock in the last year of the data series was derived from this function. The sampling procedure was used to obtain the joint distribution of parameters r and K, and 10 000 iterations were processed for each situation. The geometric mean was selected because it can better capture the distributions of r, K, and MSY (Zhang et al., 2018). According to the Schaefer production model, the MSY can be estimated by r×K/4. The standard deviation of logarithmic mean was used as a measure of uncertainties; hence, approximately 95% of MSY estimates would fall in this range. Five levels of process errors, namely, 0, 0.01, 0.05, 0.10, and 0.15, were considered.
2.3 ScenarioAccording to the priors of the parameters and catch data series, the model was run with 17 scenarios (Table 3). The prior distributions of r were set as informative and non-informative priors. To account for the uncertainty as much as possible, the lower limits of r were set to 0.40 and 0.35, respectively (see S4A and S4B). K also uses a prior distribution with information and no information, as shown in Table 3 below, where S1A and S1B were used for the MSY estimation of the Pacific saury in the NPO. The other scenarios were sensitive analysis scenarios. Additionally, this study also compares the impact of different catch time series on the evaluation model (see S5_1960 to S5_2000).
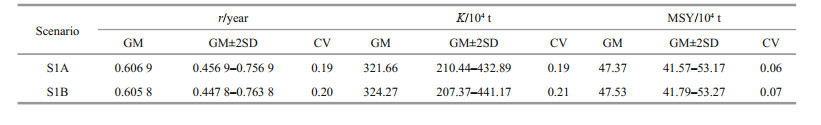
The graphical outputs of the Pacific saury are shown in Figs. 2 and 3 in accordance with the result of the Catch-MSY model under base case. There are no significant differences between the results of the two scenarios. In scenario S1A, Fig. 2a shows the time series of catches with an overlaid estimate of MSY=47.37×10⁴ t and limits (41.57×10⁴ t to 53.17×10⁴ t) that contain about 95% of the MSY estimates derived from the r-k pairs (Fig. 2). In scenario S1B, the overlaid estimate is MSY=47.53×10⁴ t with the limits ranging from 41.79×10⁴ t to 53.27×10⁴ t (Fig. 3). From Figs. 2b & c, 3b & c, the posterior estimation of K concentrated on a narrow range, whereas r had a broad posterior estimation covering the prior range, and there are obvious significant inverse correlations between ln(r) and ln(K). Figures 2d, e, f & 3d, e, f show the posterior densities of r, K, and MSY, respectively. Table 4 shows the parameters and reference points of the Pacific saury in the NPO from S1A and S1B.

|
| Fig.2 Model outputs in case of no process errors for the Pacific saury in the NPO from S1A a. catch history from 1950 to 2016 with the MSY estimation (solid line)±2SD (dash line); b. prior uniform distribution of r and K, and the black dots show the r-K combinations that are compatible with the time series of catches. c. the relationship between ln(r) and ln(K) with the geometric mean MSY (solid line)±2SD (dash line); d–f. posterior densities of r, k, and MSY. The solid lines are geometric means, and the dashes represent geometric means±2SD. |

|
| Fig.3 Model outputs in case of no process errors for the Pacific saury in the NPO from S1B |
|
When using the non-informative priors of parameter r, the posterior distribution of K had a broader range than when using informative priors of r (Fig. 4a). When using the informative priors of parameter r, the smaller lower limit r, the larger mean value of the posterior distribution of K, and the broader distribution of K values were used to maintain those yields (Fig. 4b). There are no significant differences of the posterior distribution of r when using non-informative priors and informative priors of K (Fig. 4c). As shown in Fig. 4d, if the larger upper limit of K was chosen, the mean value of the posterior distribution of r would be larger and the range of r would be wider.

|
| Fig.4 Prior and posterior distribution of the key parameters based on different scenarios |
Upon comparing the effects of different prior distributions of r and K on the estimated MSY, for the r, the MSY increased gradually with an increasing lower limit of the prior distribution of r (Fig. 5a). The MSY is more discrete when the wider range prior distribution of r is given. For the K, we can see that the upper limit of K only slightly influences on the distribution of MSY when using the informative priors of parameter r (Fig. 5b).

|
| Fig.5 Estimated MSY based on different scenarios a. distribution of MSY under the scenarios S1A, S4A and S4B; b. distribution of MSY under the scenarios S1A, S3A and S3B. |
When applying the Catch-MSY model for the Pacific saury, we considered the influence of different levels of process error. For scenario S1A (Fig. 6), there was no significant change in the percentage relative bias (PRB) of r, whereas PRB of K decreased as the process error increased. When the process error was 0.15, the PRB of MSY was the greatest. For scenario S1B (Fig. 7), the results are similar to those of scenario S1A. The PRB of K and MSY decreased as the process error increased, whereas there was no significant variance in the PRB of r.

|
| Fig.6 Percentage relative bias of r, K, and MSY estimated at different process errors for the Pacific saury in the NPO from S1A |

|
| Fig.7 Percentage relative bias of r, K, and MSY estimated at different process errors for the Pacific saury in the NPO from S1B |
According to the catch data of the Pacific saury in the NPO (1950–2016) (Fig. 1), the MSY was estimated using different catch time series. The maximum estimated MSY is 48.05×10⁴ t when the 1960–2016 catch time series was selected, and the minimum estimated MSY is 47.15×10⁴ t when the 1970–2016 catch time series was selected (Fig. 8). There is a little fluctuation of MSY depending on the dataset, which means that the time series of catch data has a limited impact on the estimation of MSY, whereas the results of the model are sensitive to the annual catch in the first and last years.

|
| Fig.8 MSY of the Pacific saury estimated by the CatchMSY model based on different time series |
The Pacific saury is characterized by its short life span, with individuals seldom exceeding two years of age (Suyama, 2002; Hua et al., 2017). Moreover, the Pacific saury stock abundance is highly dependent on the annual recruitment being successful, and its biomass can fluctuate wildly as the environment changes (Tian et al., 2002; Chow et al., 2009). Owing to the lack of long-term series catch-at-age data and systematic biological research, the application of a fully age-structured stock assessment model for a short-lived species such as the Pacific saury might be questionable and difficult (Guan et al., 2013; Wang et al., 2016; Shi et al., 2018). The Catch-MSY model is an internationally listed method that has been used successfully on other stocks, particularly for fisheries with limited data (Froese et al., 2017). It is a simpler and less data-demanding method that is based on the time series of catch data and basic life history information, which is suitable for the current Pacific saury fishery. Therefore, it is reasonable to use the Catch-MSY model to estimate the MSY for the Pacific saury.
Table 4 shows that MSY of the Pacific saury, estimated using the Catch-MSY method, was 47.37×10⁴ t. Shi et al. (2019) determined the estimated MSY on the basis of the Bayesian Schaefer surplus production model as 75.26×10⁴ t; meanwhile, an MSY of 57.07×10⁴ t was obtained by NPFC (2017) using a Bayesian state-space model. These results are not consistent with the results of our study. The reasons for this difference may be the use of different sources of fishery data and different models (Punt and Hilborn, 1997; Li et al., 2010; Jiao et al., 2011). NPFC (2017) used the Japanese survey data to fit the Bayesian state-space model, whereas Shi et al. (2019) applied a Bayesian Schaefer surplus production model using Chinese fishery data. The Schaefer surplus production model and Bayesian state-space model are more complex than the Catch-MSY model, fit more types of fishery data, and take process and observation errors into account. Hence, the estimated MSY from the previous studies should be considered when we provide management advice for the Pacific saury in the NPO. Further, the Catch-MSY model is prone to underestimating the MSY (Martel and Froese, 2013). Therefore, when developing management objectives on the basis of the results of the present study, one should take the underestimated MSY values into consideration.
4.2 Sensitive analysisThe sensitivity analysis shows that the posterior distribution of K would have a broader range when using the non-informative priors of r, which may inflate the estimates of MSY produced by the CatchMSY model. Martell and Froese (2013) observe that the estimates of the most probable central values for r and K are strongly dependent on the lower limit chosen for r and the upper limit chosen for K. In this study, different lower limit of r and different upper limit of K were set to conduct the sensitive analysis. The results show that the smaller the lower limit r, the larger the mean value of the posterior distribution of K, and if the larger upper limit of K was chosen, the range of r would be wider, which corresponded with Martell and Froese's (2013) conclusion. In the sensitivity analysis, we also found that the MSY increases gradually with an increase in the lower limit of the prior distribution of r (Fig. 5a). Consequently, the inaccurate r values directly cause an underestimation or overestimation of the MSY and affect the development of management measures. Therefore, using demographic methods to estimate a prior distribution for r of the Pacific saury is a future research direction. Different process error levels had different influences on the estimated parameters and MSY. Compared to r and K, process error has a greater impact on MSY. In order to apply the Catch-MSY model more accurately, the process error needs to be selected carefully.
In this study, we set up six different time series scenarios, and the estimated MSY are similar. The results of the model are not sensitive to the length of catch data time series. However, because we set the default ranges of relative biomass in the first and last years of the time series (Froese and Demirel, 2017), the results of the model were very sensitive to catch data in the first and last years. Consequently, the use of ranges of relative biomass may also need to be justified on the basis of an understanding of the development of each fishery. This would improve the accuracy of the results of the model.
4.3 Management adviceThe Pacific saury fishery began before 1950, but the catch was low during those years. The trajectories of estimated MSY and catch (Figs. 2 & 3) demonstrated that the Pacific saury fishery suffered from overfishing between the mid-1950s and the early 1960s as well as for several years during the 2000s. The catches were closer to the MSY during these years, whereas in recent years, the catches were under the MSY and were not harmful to the Pacific saury population. This conclusion is consistent with previous studies by Shi et al. (2019) and NPFC (2017). According to the principles of MSY-based management suggested by Martell and Froese (2013), the lower margin of error of MSY should be used as a target for Total Allowable Catch or TAC if stock sizes were above 0.5 K. The MSY of this study is 47.37×10⁴ t, whereas Shi et al. (2019) arrived at a MSY result of 75.26×10⁴ t by using the Bayesian Schaefer production model to evaluate the status of the Pacific saury in the NPO according to the Chinese saury fishery data. Given that the Catch-MSY model may underestimate MSY, the management target should be set between 50×104 t and 70×104 t.
4.4 Uncertainty of the Catch-MSY modelOn the basis of our understanding of the Catch-MSY model and the results of this study, we can conclude that the uncertainty of the models comes primarily from the following. First, there is the uncertainty associated with the time series of catch data because these data evinced observation errors in the process of collection. Second, there is the uncertainty of model parameters because in this model, we assumed that the prior range for the parameters is reasonable; however, owing to the lack of systematic biological research, this may induce biases in the estimation of the MSY and the biomass of the Pacific saury. Additionally, a stationary production formula was assumed, meaning that there were no changes in the parameters of the Schaefer production model over time. To evaluate the sensitivity to the assumed priors, further exploration is needed. Third, since we operate on the basis of a surplus production model, growth, mortality, and recruitment are pooled in the same equation, inevitably ignoring the individual processes. Moreover, the impact of environmental factors on the resources of the Pacific saury was ignored.
In summary, this study showed that the Catch-MSY mode could be used to estimate MSY for the Pacific saury and consequently be used to supply some management advice for this data-poor fishery. This model may also provide a good selection for the MSY estimation of other data-poor fisheries. Finally, these findings suggest that more types of fishery data should be collected in future studies, which should subsequently conduct stock assessments of the Pacific saury using traditional stock assessment models.
5 CONCLUSIONAs one of the most important commercial species in the NPO, the catches of the Pacific saury are increasing every year. However, the stock assessment research of this species was limited and experienced considerable uncertainty. The Catch-MSY model is a promising approach for estimating MSY for data-limited fisheries. The MSY estimation for the Pacific saury was carried out in Catch-MSY model in our study, in which 17 scenarios according to different prior distributions of the r and K were established for sensitivity analysis. We identified that the MSY increases with an increasing lower limit of r and the results of the model are sensitive to the annual catch in the first and last years. The estimated MSY of the Pacific saury was 47.37×10⁴ t (41.57×10⁴ t to 53.17×10⁴ t) in scenario S1A and 47.53×10⁴ t (41.79×10⁴ t to 53.27×10⁴ t) in scenario S1B. Considering the uncertainty of the Catch-MSY model, it is recommended that the management target be kept between 50×104 t and 70×104 t as a better management regulation. The Catch-MSY model can be a better choice for the MSY estimation of data-poor species such as the Pacific saury. Additionally, more types of fishery data should be collected in future studies; subsequently, stock assessments of the Pacific saury could be conducted using traditional stock assessment models, which may provide more reasonable suggestions for the development and management of the Pacific saury.
6 AUTHOR DECLARATION AND DATA AVAILABILITYThe authors declare that they have no conflict of interest.
All applicable international, national, and/or institutional guidelines for the care and use of animals were followed.
The datasets created during and/or analyzed during the current study are available from the corresponding author upon reasonable request.
7 ACKNOWLEDGMENTWe thank all the reviewers for their valuable comments and advice. Thanks are also given to other laboratory colleagues for field and laboratory work assistance.
Alverson D L, Pereyra W T. 1969. Demersal fish explorations in the northeastern Pacific Ocean—an evaluation of exploratory fishing methods and analytical approaches to stock size and yield forecasts. Journal of Fisheries Research Board of Canada, 26(8): 1 985-2 001.
DOI:10.1139/f69-188 |
Arnold L M, Heppel S S. 2015. Testing the robustness of data-poor assessment methods to uncertainty in catch and biology: a retrospective approach. ICES Journal of Marine Science, 72(1): 243-250.
DOI:10.1093/icesjms/fsu077 |
Carruthers T R, Punt A E, Walters C J, MacCall A, McAllister M K, Dick E J, Cope J. 2014. Evaluating methods for setting catch limits in data-limited fisheries. Fisheries Research, 153: 48-68.
DOI:10.1016/j.fishres.2013.12.014 |
Chow S, Suzuki N, Brodeur R D, Ueno Y. 2009. Little population structuring and recent evolution of the Pacific saury (Cololabis saira) as indicated by mitochondrial and nuclear DNA sequence data. Journal of Experimental Marine Biology and Ecology, 369(1): 17-21.
DOI:10.1016/j.jembe.2008.10.023 |
Chrysafi A, Kuparinen A. 2016. Assessing abundance of populations with limited data: Lessons learned from data-poor fisheries stock assessment. Environmental Reviews, 24(1): 245-250.
|
Dick E J, MacCall A D. 2011. Depletion-based stock reduction analysis: a catch-based method for determining sustainable yields for data-poor fish stocks. Fisheries Research, 110(2): 331-341.
|
FAO. 2016. Report of the FAO/CECAF Working Group on the Assessment of Small Pelagic Fish-Subgroup South. CECAF/ECAF SERIES 12/74, FAO, Accra, Ghana.
|
Froese R, Demirel N, Coro G, Kleisner K M, Winker H. 2017. Estimating fisheries reference points from catch and resilience. Fish and Fisheries, 18(3): 506-526.
DOI:10.1111/faf.12190 |
Froese R, Pauly D. 2015. FishBase. World Wide Web electronic publication. www.fishbase.org. Accessed on 2015-10.
|
Froese R, Zeller D, Kleisner K, Pauly D. 2012. What catch data can tell us about the status of global fisheries. Marine Biology, 159(6): 1 283-1 292.
DOI:10.1007/s00227-012-1909-6 |
Guan W J, Tang L, Zhu J F, Tian S Q, Xu L X. 2016. Application of a Bayesian method to data-poor stock assessment by using Indian Ocean albacore (Thunnus alalunga) stock assessment as an example. Acta Oceanologica Sinica, 35(2): 117-125.
DOI:10.1007/s13131-016-0814-0 |
Guan W J, Tian S Q, Zhu J F, Chen X J. 2013. A review of fisheries stock assessment models. Journal of Fishery Sciences of China, 20(5): 1 112-1 120.
(in Chinese with English abstract) DOI:10.3724/SP.J.1118.2013.01112 |
Hua C X, Gao Y Z, Zhu Q C, Zhou Y F, Li S S. 2017. Age and growth of Pacific saury (Cololabis saira) in the northwest Pacific Ocean Based on statolith microstruture. Acta Oceanologica Sinica, 39(10): 46-53.
(in Chinese with English abstract) |
Hua C X, Zhu Q C, Xu W. 2010. Fishing ground distribution of cololabis saira in the Northwestern Pacific. Shandong Fisheries, 27(10): 10-13.
(in Chinese with English abstract) |
Ito S, Kishi J M, Kurita Y, Oozeki Y, Yamanaka Y, Megrey B A, Werner F E. 2004. Initial design for a fish bioenergetics model of Pacific saury coupled to a lower trophic ecosystem model. Fisheries Oceanography, 13(S1): 111-124.
DOI:10.1111/j.1365-2419.2004.00307.x |
Iwahashi M, Isoda Y, Ito S, Oozeki Y, Suyama S. 2006. Estimation of seasonal spawning ground locations and ambient sea surface temperatures for eggs and larvae of Pacific saury (Cololabis saira) in the western North Pacific. Fisheries Oceanography, 15(2): 125-138.
DOI:10.1111/j.1365-2419.2005.00384.x |
Jiao Y, Cortés E, Andrews K, Guo F. 2011. Poor-data and data-poor species stock assessment using a Bayesian hierarchical approach. Journal of Applied Ecology, 21(7): 2 691-2 708.
DOI:10.1890/10-0526.1 |
Li G, Chen X J, Guan W J. 2010. Stock assessment and risk analysis of management strategies for Scomber japonicus in the East China Sea and Yellow Sea using a Bayesian approach. Journal of Fisheries of China, 34(5): 740-750.
(in Chinese with English abstract) DOI:10.3724/SP.J.1231.2010.05941 |
MacCall A D. 2009. Depletion-corrected average catch: a simple formula for estimating sustainable yields in data-poor situations. ICES Journal of Marine Science, 66(10): 2 267-2 271.
DOI:10.1093/icesjms/fsp209 |
Magnusson A, Hilborn R. 2007. What makes fisheries data informative?. Fish and Fisheries, 8(4): 337-358.
DOI:10.1111/j.1467-2979.2007.00258.x |
Martell S, Froese R. 2013. A simple method for estimating MSY from catch and resilience. Fish and Fisheries, 14(4): 504-514.
DOI:10.1111/j.1467-2979.2012.00485.x |
Nakaya M, Morioka T, Fukunaga K, et al. 2010. Growth and maturation of Pacific saury Cololabis saira under laboratory conditions. Fisheries Science, 76(1): 45-53.
DOI:10.1007/s12562-009-0179-9 |
North Pacific Fisheries Commission. 2018. NPFC Yearbook 2017. 385p. Available at www.npfc.int
|
NPFC PSWG. 2017. Report of the 1st Meeting of the Technical Working Group on Pacific Saury Stock Assessment. NPFC-2017-TWG PSSA01-Final Report. NPFC, Shanghai, China. p.43-74.
|
Punt A E, Hilborn R. 1997. Fisheries stock assessment and decision analysis: the Bayesian approach. Reviews in Fish Biology and Fisheries, 7(1): 35-63.
DOI:10.1023/A:1018419207494 |
Punt A E, Smith D C, Smith A D M. 2011. Among-stock comparisons for improving stock assessments of data-poor stocks: the "Robin Hood" approach. ICES Journal of Marine Science, 68(5): 972-981.
DOI:10.1093/icesjms/fsr039 |
Punt A E. 2011. Extending production models to include process error in the population dynamics. Canadian Journal of Fisheries and Aquatic Sciences, 60(10): 1 217-1 228.
|
Restrepo V R, Thompson G G, Mace P M, Gabriel W L, Low L L, MacCall A D, Methot R D, Power J E, Taylor B L, Wade P R, Witzig J F. 1998. Technical Guidance on the Use of Precautionary Approaches to Implementing National Standard 1 of the Magnuson-Stevens Fishery Conservation and Management Act. US Department of Commerce, National Oceanic and Atmospheric Administration, National Marine Fisheries Service, Seattle. 1998.
|
Sakurai Y, Kiyofuji H, Saitoh S, Goto T, Hiyama Y. 2000. Changes in inferred spawning areas of Todarodes pacificus (Cephalopoda: Ommastrephidae) due to changing environmental conditions. ICES Journal of Marine Science, 57(1): 24-30.
DOI:10.1006/jmsc.2000.0667 |
Schaefer M B. 1991. Some aspects of the dynamics of populations important to the management of the commercial marine fisheries. Bulletin of Mathematical Biology, 53(1-2): 253-279.
DOI:10.1016/S0092-8240(05)80049-7 |
Shi Y C, Zhu Q C, Hua C X, Zhang Y D, Hua C X, Zhou W B. 2016. Factors influencing the rope tension of saury stick-held lift nets. Journal of Fishery Sciences of China, 23(3): 704-712.
(in Chinese with English abstract) |
Shi Y C, Zhu Q C, Hua C X, Zhang Y D. 2018. Sinking and rising performance of saury stick-held based on field measurements. Marine Science Bulletin, 37(4): 459-467.
(in Chinese with English abstract) |
Shi Y C, Zhu Q C, Huang S L, Hua C X. 2019. Stock assessment of pacific suary (Cololabis Saira) in the northwest pacific using a bayesian schaefer model. Progress in Fishery Sciences, 40(5): 1-10.
(in Chinese with English abstract) |
Sun M C, Ye X C, Zhang J, Qian W G. 2003. Probe into Pacific saury fisheries in the northwest Pacific Ocean. Marine Fisheries, 25(3): 112-115.
(in Chinese with English abstract) |
Suyama S, Nakagami M, Naya M, Ueno Y. 2012. Migration route of Pacific saury Cololabis saira inferred from the otolith hyaline zone. Fisheries Science, 78(6): 1 179-1 186.
DOI:10.1007/s12562-012-0546-9 |
Suyama S. 2002. Study on the age, growth, and muturation process of Pacific saury Cololabis saira (Brevoort) in the North Pacific. Bulletin of Fisheries Research Agency, 5: 68-113.
|
Tian Y J, Akamine T, Suda M. 2003. Variations in the abundance of Pacific saury (Cololabis saira) from the northwestern Pacific in relation to oceanic-climate changes. Fisheries Research, 60(2/3): 439-454.
|
Tian Y J, Akamine T, Suda M. 2004. Modeling the influence of oceanic-climatic changes on the dynamics of Pacific saury in the northwestern Pacific using a life cycle model. Fisheries Oceanography, 13(S1): 125-137.
DOI:10.1111/j.1365-2419.2004.00314.x |
Tian Y J, Ueno Y, Sud M, Akamine T. 2002. Climate-ocean variability and the response of Pacific saury (Cololabis saira) in the northwestern Pacific during the last half century. Fisheries Science, 68(S1): 158-161.
|
Tseng C T, Su N J, Sun C L, Punt A E, Yeh S Z, Liu D C, Su W C, et al. 2013. Spatial and temporal variability of the Pacific saury (Cololabis saira) distribution in the northwestern Pacific Ocean. ICES Journal of Marine Science, 70(5): 991-999.
DOI:10.1093/icesjms/fss205 |
Wang J T, Yu W, Chen X, Chen Y. 2016. Stock assessment for the western winter-spring cohort of neon flying squid (Ommastrephes bartramii) using environmentally dependent surplus production models. Scientia Marina, 80(1): 69-78.
|
Wetzel C R, Punt A E. 2011. Model performance for the determination of appropriate harvest levels in the case of data-poor stocks. Fisheries Research, 110(2): 342-355.
|
Xia H. 2008. The Illumination Distribution Model of the Pacific Saury (Cololabis saira) Stick-held Dip Net Fishing. Shanghai Ocean University, Shanghai. p.1-54. (in Chinese with English abstract)
|
Yang X L, Wang P F, Jiao Y L, Zhou Q L, Li H D, Li Y C, Liu G, Zhang H G. 2005. Study on the culture technique in the middle stage and the growing character of Apostichopus japonicus. Shandong Fishery, 22(10): 43-46.
(in Chinese with English abstract) |
Yu Y F, Zhang X, Huang H L, Xu B S, Wang M Y. 2006. Study on attracting fish method of stick-held net for Cololabis saira. Journal of Zhejiang Ocean University: Natural Science, 25(2): 154-156.
(in Chinese with English abstract) |
Zavolokin A. 2018. Priority species. NPFC. https://www.npfc.int/priority-species. Accessed on 2018-06-09.
|
Zhang K, Zhang J, Xu Y W, Sun M S, Chen Z Z, Yuan M. 2018. Application of a catch-based method for stock assessment of three important fisheries in the East China Sea. Acta Oceanologica Sinica, 37(2): 102-109.
DOI:10.1007/s13131-018-1173-9 |
Zhang Y, Zhu Q C, Yan L, Shang L L. 2013. Preliminary Study on Biological Characteristics of Cololabis Saira in the Northwest Pacific Ocean in Spring. Transactions of Oceanology and Limnology, (1): 53-60.
(in Chinese with English abstract) |