 2021, Vol. 39
Institute of Oceanology, Chinese Academy of Sciences
Article Information
- Sundari Devi CHANTHRAN Shyama, Eem LIM Phaik, POONG Sze-Wan, DU Jianguo, LOH Kar-Hoe
- Relationships between sagittal otolith size and body size of Terapon jarbua (Teleostei, Terapontidae) in Malaysian waters
- Journal of Oceanology and Limnology, 39(1): 372-381
- http://dx.doi.org/10.1007/s00343-019-9193-7
Article History
- Received Aug. 2, 2019
- accepted in principle Sep. 19, 2019
- accepted for publication Dec. 17, 2019


2 Institute for Advanced Studies, University of Malaya, Kuala Lumpur 50603, Malaysia;
3 Third Institute of Oceanography, Ministry of Natural Resources, Xiamen 361005, China;
4 Fujian Provincial Station for Field Observation and Research of Island and Coastal Zone in Zhangzhou, Xiamen 361005, China;
5 Fujian Provincial Key Laboratory of Marine Ecological Conservation and Restoration, Xiamen 361005, China
Terapon jarbua (Forskål, 1775) is commonly known as tiger perch, or "ikan mengkerong" in the local name (Department of Fisheries Malaysia, 2009; Du et al., 2019; Shyama et al., 2020). They are also called grunters in reference to the sound emitted by their unique swim bladder that is equipped with extrinsic muscles (Vari, 1978). T. jarbua is a catadromous species (Riede, 2004), in which they are born in saltwater, and subsequently migrate to freshwaters as juveniles before migrating back into the ocean as adults for spawning (Rao et al., 2000). The total length of an adult is generally between 20 and 27 cm (Vari, 1978), but sometimes can reach up to 36 cm (Froese and Pauly, 2018).
The estimation on length-weight relationships (LWR) parameters for T. jarbua has been reported from populations in New Caledonia (Vari, 1978), Thailand (Yamagawa, 1994), Indonesia (Pauly et al., 1996), South Africa (Harrison, 2001), China (Zhang et al., 2002), India (Manoharan et al., 2013; Nandikeswari et al., 2014), and the Philippines (Gumanao et al., 2016). Length weight regressions have been used frequently to estimate weight from length because direct weight measurement can be time consuming in the field (Kalaycı et al., 2007). Establishment of a relationship between weight and length is essential for the calculation of production and biomass of a fish population (Khan et al., 1987). We can also evaluate the conditions (i.e., environment, food availability), reproduction and spawning activities, ontogenetic changes, life cycle, and the general health of a fish by using the LWR (Bayhan et al., 2008). Such information is useful to improve, optimize and produce economically feasible and higher biomass yield on a commercial scale basis.
Allometry is the study of consequences of size and shape. In allometry, the relationship between two parts of an organism's body over a wide size range is calculated (Reiss, 1991). According to Jones et al. (1999), b values less than 3 (b < 3), indicates negative allometric growth. This shows that weight will decrease with the increase of fish length, causing the specimen to become less rotund. Positive allometric growth occurs when b value is greater than 3 (b>3). It implies a significant positive relationship between fish weight and fish length thus causing the weight to increase with its length, and the fish becomes more rotund (Jones et al., 1999). When the b value is equal or close to 3, growth of aquatic species is isometric and growth occurs equally in all dimensions (Wootton, 1990).
Otoliths are calcium carbonate structures located in the inner ears of bony fishes. They are responsible for providing stability and sound detection in bony fishes (Campana and Thorrold, 2001). Otoliths have distinct shapes, which vary widely among fish families and can be highly species-specific (Harvey, 2000; Tuset et al., 2008). Sagittae is the largest among the three pairs of otoliths (asteriscus, lapillus, sagittae) present in bony fishes, hence it has been chosen in this study (Harvey, 2000). In stomach content analyses, the identification and quantification of fish prey is difficult when specimens are partially or totally digested.
To date, studies on the LWR and otolith of T. jarbua have not been reported in Malaysia. The outcome of this study is expected useful for assessment of their age, growth, and production. The basic information on LWR and otolith for fish resources is important as it provides much needed information and allows estimations of fish growth in different regions. Hence, the present study focused on compensating the gap of information in this area in order to carry out ecosystem-based fisheries management (EBFM).
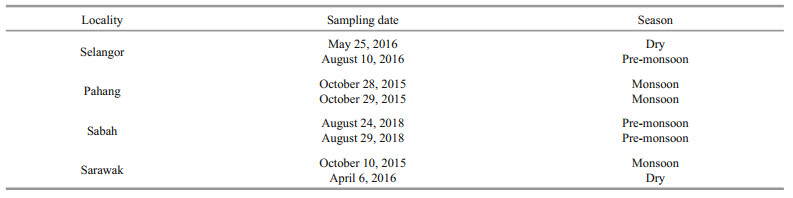
2 MATERIAL AND METHODTerapon jarbua was collected from various local markets and landing sites across east and west Malaysia. A total of 165 specimens were collected randomly to represent a wider size range of fishes. Of these, 53 were collected from Selangor, 32 from Pahang, 60 from Sabah and 20 from Sarawak (Fig. 1). The specimens were collected from October 2015 to August 2018 (Appendix 1).

|
| Fig.1 The sampling locations from East (Sandakan, Sabah and Mukah, Sarawak) and West Malaysia (Sungai Besar, Selangor and Kuantan, Pahang) |
The total length (TL, cm) and total weight (Wt, g) were initially measured for each specimen. The otoliths were then removed through a cut in the cranium and no preservative was used before extraction. The otoliths were cleaned and photographed in the laboratory. The left and right otoliths were considered separately. Damaged or broken otoliths were excluded from the analyses. The following measurements were subsequently obtained from each specimen: otolith length (OL, cm), the longest distance between the most anterior and posterior points; otolith width (OW, cm), the longest distance between the ventral and dorsal edges; and the weight of the sagittal (OWt). The otolith aspect ratio (OAS) was calculated by dividing OL by OW (See et al., 2016). Digital images of each pair of otoliths were recorded with a stereomicroscope (Olympus SZ61) as shown in Fig. 2.

|
| Fig.2 Image of otolith captured under the stereomicroscope OW (width) was measured from anterior to posterior. OL (length) was measured from dorsal to ventral. |
As there was no significant statistical difference observed between the left and right fish otoliths (paired t-test, P>0.05), data of the left otolith was used in this study. This is consistent with the observation that the otolith pairs are mirror images of each other. Least square linear regression based on logarithms for each locality and all localities combined was used to determine the relationship between TL against Wt and OL against OWt. The relationship was determined by fitting into the equation, W=aLb. Parameters a and b of the length-weight relationships (LWR), were estimated from the intercept and slope of the linear regression analysis on the log-transformed weight and length data, log W=loga+b logL (Keys, 1928). The strength of each relationship was evaluated from the determination coefficient (R2). The highest R2 scores were used to determine which type of regression model (linear or exponential) was used between the parameters. All data analyses were carried out using Microsoft Excel ver. 2016. Presence of outliers was taken into consideration according to Froese et al. (2011).
3 RESULT 3.1 Total length-weight relationship of fishA total of 165 fish specimens with an average total length of 20.77 cm (12.5–32.5 cm) and an average total weight of 140.85 g (26.28–444.30 g) were examined. The tabulated data of LWR, regression parameters and significance of correlation according to sampling locations are presented in Table 1.
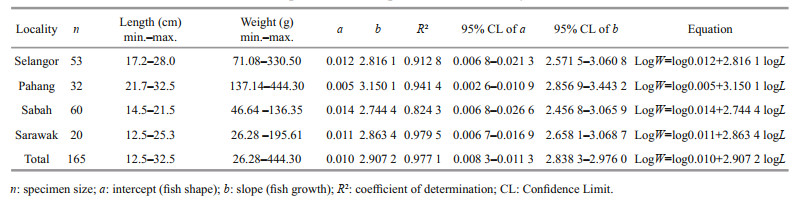
The largest specimen with a length of 32.5 cm was found from Pahang while the smallest with a length of 12.5 cm was obtained from Sarawak. The LWR of T. jarbua conformed to the general formula by fitting into the equation logW=log0.010+2.907 2 logL for the pooled data. The LWR of T. jarbua in Malaysian waters during the study period showed negative allometry based on the regression coefficient (b) values (b < 3; b=2.907 2). This is confirmed by the t-test which showed a high t-statistic with a low P value (P < 0.05). Since all the coefficients of a and b were within the range of 95% confidence limit (CL), the data used in this study is considered to be statistically significant. This study also displayed high regression values in all localities, indicating a good fit between length and weight. The highest b value was observed for specimens from Pahang (b>3; b=3.1501) showing positive allometric growth, while the lowest b value was observed for specimens from Sabah (b < 3; b=2.744), which indicates negative allometric growth. The growth in different localities is depicted in Fig. 3.

|
| Fig.3 LWRs of T. jarbua in Malaysia using log transformed L-W (cm, g) data |
The descriptive statistics of sagittal otoliths from 132 specimens of T. jarbua are shown in Table 2.

|
The otolith length ranged 0.423–1.070 cm, otolith width 0.243–0.595 cm, and otolith weight 0.010 3–0.157 2 g. The biggest otolith was found in Pahang, while the smallest was from Sarawak. The relationship of otolith length and otolith weight was analysed by the exponential model which resulted in a strong linear correlation at 81.26% as illustrated in Fig. 4. The total aspect ratio of otolith (OAS) was 1.79±0.14 (mean±SD). The highest aspect ratio was observed in specimens from Pahang (1.83±0.13) and the lowest was recorded from Sarawak (1.72±0.15). These aspect ratio data were tested for normality and all populations conformed to a normal distribution (Kolmogorov-Smirnov, P>0.05).

|
| Fig.4 Correlation of otolith length and weight based on locations |
Both linear and exponential regression models were used to determine the relationship between the fish length and otolith dimensions. The calculated otolith width and otolith length were linearly correlated to the total fish length and displayed coefficient of determination (R2) of 73.75% and 80.85% respectively. On the other hand, the otolith weight correlates exponentially to the fish length by displaying a rather higher coefficient of determination (R2) of 86.57%. Otolith weight displayed the highest regression value with the fish length in T. jarbua (Fig. 5c) while otolith width (Fig. 5a) and otolith length (Fig. 5b) showed lower regression values. All relations of the fish length and otolith measurements were statistically significant (P < 0.05).

|
| Fig.5 Linear correlations between fish total length-otolith width (a), fish total length-otolith length (b), and exponential relation between fish length-otolith weight (c) |
Slope of the regression line b is the most important parameter in LWR as it helps in predicting the general health condition of the fish (Radhi et al., 2018). The b values in this study lie within the expected range of 2.5–3.5 for members of the Perciformes (Froese, 2006). Positive allometry (b>3) is likely observed when specimens are in good condition (i.e., feeding and environment) or the width increases more than its length, either as a result of a notable ontogenetic change in body shape or that most of the larger specimens were thicker than the smaller specimens. Conversely, negative allometry (b < 3) indicates a decrease in condition or elongation in form accompanied by an increase in length. The larger the difference from 3.0, the larger the change in condition or form (Hile, 1936).
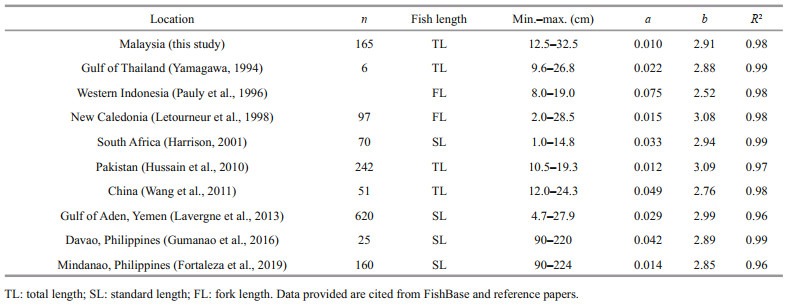
The overall value of b for T. jarbua in Malaysian waters was 2.907 2, indicating negative allometry, in which the fish's body shape becomes streamlined as it grows (Saleem et al., 2016) and this was due to the fish growing faster in length than its width. The LWR parameters of T. jarbua from various locations are presented in Appendix 2. In western Indonesia, the b value recorded was 2.52 (Pauly et al., 1996); East China Sea 2.87 (Zhang et al., 2002); Gulf of Thailand 2.88 (Yamagawa, 1994); Philippines 2.89 (Gumanao et al., 2016); South Africa 2.94 (Harrison, 2001); Yemen 2.99 (Lavergne et al., 2013); New Caledonia 3.08 (Letourneur et al., 1998) and Pakistan 3.09 (Hussain et al., 2010).
The general growth pattern of T. jarbua in Malaysian waters during the study period is suggested as negative allometry (b < 3; b=2.91), which implies that the increase in length and weight dimensions is not proportional. Hence, the specimens are generally less rotund. According to Zakaria et al. (2000), a fish with b value within the range of 2.9–3.0 is considered as having healthy growth. Hence, we can conclude that the conditions such as the food availability, habitat (oxygen, temperature, water quality) or seasons (Isa et al., 2010; Nandikeswari et al., 2014; Ahmed and Benzer, 2015) of T. jarbua in Malaysian waters during the study period is generally good. This is in agreement with the report by Radhi et al. (2018), suggesting that growth patterns for fishes in Malaysia can be considered good even though some variations in b value within fish species were identified.
Specimens from Pahang recorded the highest b value of 3.15, implying that the specimens increased more in width compared to its length. In addition, we predicted some of the specimens were undergoing pre-spawning (results not shown). According to Zakaria et al. (2000), the b value generally rises above 2.8 during the development of gonads. Gonad maturity cannot be measured for this study as all the specimens were collected randomly in different months and years. However, we made a comparison based on the GSI value between the current research and T. jarbua from Taiwan, China (Chang et al., 2008). Chang stated that females with ovaries in the late maturing or later stages usually have GSI greater than 2.5 and are categorized as matured. Meanwhile, males in the mature stage, which possess GSI greater than 1.0, are defined as matured. The female specimens from Pahang showed an average GSI value of 3.16 suggesting that the ovaries are matured. Meanwhile, the male specimens from Pahang showed a lower GSI value of only 0.46, indicating that the male gonads are still immature during the collection period. These comparisons might justify the fish maturity of specimens from Pahang.
Mitra and Naser (1987) found that reduced metabolic activities, accumulation of fat and increased weight of gonads during pre-spawning have resulted in higher b values. In the present study, we predict that the higher b value of female T. jarbua may be attributed to the reduced metabolic activities, higher fat accumulation and increased gonadal weight as compared to its male counterpart due to the huge difference in its gonadal weight and GSI values.
The observed positive allometric growth in specimens from Pahang may also be attributed to seasonal variations as they were collected during the monsoon season in late October. The South China Sea circulation in the east coast of Peninsular Malaysia is strongly driven by the monsoon winds (Shaari and Mustapha, 2017). The increase in primary and secondary production including phytoplankton biomass in the sea might occur during this period, which affects the condition factors and length-weight of T. jarbua (Hong et al., 2002). This in turn is expected to escalate the fish growth. Similarly, a positive allometric growth in T. jarbua during monsoon season was observed previously by Ahmed et al. (2015).
On the other hand, specimens from Sabah recorded the lowest b value of 2.74. This indicates that the increase in fish length is not proportionate to its weight causing the fish to be more streamlined (Manoharan et al., 2013; Nandikeswari et al., 2014). This can be proved as the number of male specimens collected was higher by 86.67% than the females, which was only 13.33% (results not shown). The higher metabolic activity of the male fishes is believed to have led to more growth in length rather than weight. For the female specimens, negative allometry is likely if they were collected after spawning. This result in which the male specimens outnumbered the females is in support of studies done in Sabah on horseshoe crabs (Faridah et al., 2015; Mohamad et al., 2016). This clearly stipulates the male biased LWR is common in T. jarbua in Malaysia. According to Christianus and Saad (2009), this male skewed phenomenon occurs due to the female-biased harvesting especially the gravid females to be sold and served as a delicacy, or exported to fulfil high demands from locals and neighbouring country by the anglers in Malaysia.
Froese (2006) provided a form factor (a3.0) to determine if the body shape of a given species or population is significantly different from others. The body shapes description provided by Froese (2006) refers to a value of fishes whose exponent b equals to 3 (a3.0). When the a value is about 0.001, the fish is more eel-like; 0.008, more elongated; 0.013, fusiform; and 0.018, short and deep (Froese, 2006). For every increase in the slope (b value) of the regression line will generally lead to decrease in the intercept (a value), or vice versa. This concept is in accordance with the widely accepted norm for relationships in fishes (Froese, 2006). Since the mean b value in Malaysian waters is negative allometry (b=2.92), we cannot determine the body shape of T. jarbua based on the classification of Froese (2006).
4.2 Fish length-otolith dimensionsThe results show that otolith weight had more correlation to the fish length compared to otolith length and width. This indicates that for T. jarbua, a better prediction of the fish size can be obtained when otolith weight information is available. However, otolith width and length are still valuable predictors of fish size (Waessle et al., 2003; Corral et al., 2013). Although Zengin et al. (2015) noticed that the linear regression model was preferred for the examination of the relationship between fish length and otolith characteristics in most of the studies, the exponential regression model in the present study gave higher R2 scores than the linear regression model, specifically for TL and OWt. Therefore, an exponential regression model was used to explain relations between these two variables.
Gauldie (1988) reported that the strong relationship between the fish length and otolith length exists because both follow the same metabolic processes. According to Aydin et al. (2004), younger fishes have stronger linear relationship between fish length and otolith dimensions in comparison to older age groups. This is because otolith length correlates linearly to fish length until the fish's growth slows down, thereafter the otolith increases in thickness only (Williams and Bedford, 1974). As the growth halts, the deposition of minerals on the otoliths causes the diameter of the otolith to increase regularly along with the otolith weight in older fishes (Nedreaas, 1990). Hence, the estimation of the total length of T. jarbua based on the otolith length and width is still highly reliable with respect to the strong relationship between fish total length and otolith weight.
The feasibility of using otolith measurements in predicting fish size enables determination of fish size from the recovered otoliths in stomach of predators. This relationship is specifically useful in understanding the prey-predator relationships by examining food habits of possible piscivores predators of T. jarbua from the length and width of recovered otoliths (Cottrell et al., 1996; Al-Busaidi et al., 2017). The predators from which we can expect to recover T. jarbua otoliths include bony fishes from the family Dasyatidae and shore birds of the family Cerylidae or Laridae (Froese and Pauly, 2018). Since otolith dimensions increases with fish length, otolith growth can be correlated with fish growth. To conclude, otolith weight is the best index for estimating fish length (R2=0.865 7) according to the present study. Our findings support previous research on otoliths of T. jarbua from the Philippines, in which all three otolith dimensions are reliable in estimating fish growth (Fortaleza et al., 2019).
5 CONCLUSIONIn general, this study marks the first report on the relations between length, weight, and otolith dimensions of T. jarbua from Malaysian waters. Results of somatic growth and otolith morphometric relationships for T. jarbua indicate that all otolith dimensions can be used to predict size of the fish. The fish LWRs observed are important to the fisheries industry as they help to predict the best length and suitable time to harvest this species. It also provides valuable information for future spatial and temporal comparisons. Factors that may have contributed to the variations in growth include environmental conditions, seasonal variations, sampling time, or a combination of these factors. However, none of these factors was taken into consideration due to time and budget constraints. Hence, more comprehensive studies need to be conducted, which would involve the standardization of the sample size, sampling depths, and sampling season, as well as understanding the biology of the fishes before further inferences could be made on comparisons among these various sites. The T. jarbua in Malaysian waters can be considered as having healthy growth during the study period from October 2015 to August 2018. For better understanding of otolith growth, future studies to explore the age of T. jarbua are recommended. The otolith information gained through this research can be further explored for identification and size estimation of T. jarbua in prey-predator studies. This study contributed to the knowledge of fish populations that could assist fishery management scientists in carrying out future ecological studies in line with the strategies of conservation, restoration, and management of T. jarbua.
6 DATA AVAILABILITY STATEMENTAll data generated or analyses during this study are included in this published article and its supplementary information files.
7 ACKNOWLEDGMENTThe authors would like to thank the Institute of Ocean and Earth Sciences and University of Malaya for providing logistics support to carry out this study.
Ahmed Q, Ali Q M, Bilgin S. 2015. Seasonal changes in condition factor and weight-length relationship of Tiger Perch, Terapon Jarbua (Forsskål, 1775) (FamilyTerapontidae) collected from Korangi fish habour, Karachi, Pakistan. Pakistan Journal of Marine Sciences, 24(1-2): 19-28.
|
Ahmed Q, Benzer S. 2015. Length-weight relationship in Terapon puta (Cuvier, 1829) collected from Karachi Fish Harbour. Journal of Applied Environmental and Biological Science, 5(10): 1-5.
|
Al-Busaidi H K, Jawad L A, Al-Balushi A H. 2017. Relationships between fish and otolith size of the Blackspot Snapper Lutjanus ehrenbergii (Peters, 1869)collected from the coast of Muscat City, Sea of Oman. International Journal of Marine Science, 7(40): 386-393.
DOI:10.5376/ijms.2017.07.0040 |
Aydin R, Calta M, Sen D, Coban M Z. 2004. Relationships between fish lengths and otolith length in the population of Chondrostoma regium (Heckel, 1843) inhabiting Keban Dam Lake. Pakistan Journal of Biological Sciences, 7(9): 1550-1553.
DOI:10.3923/pjbs.2004.1550.1553 |
Bayhan B, Sever T M, Taşkavak E. 2008. Length-weight relationships of seven flatfishes (Pisces:Pleuronectiformes)from Aegean Sea. Turkish Journal of Fisheries and Aquatic Sciences, 8(2): 377-379.
|
Campana S E, Thorrold S R. 2001. Otoliths, increments, and elements:keys to a comprehensive understanding of fish populations?. Canadian Journal of Fisheries and Aquatic Sciences, 58(1): 30-38.
DOI:10.1139/f00-177 |
Chang L M, Joung S J, Wu C C, Su W C, Wu L J. 2008. Reproductive biology of Thornfish Terapon jarbua from the southwestern waters off Taiwan. Journal of the Fisheries Society of Taiwan, 35(4): 335-350.
|
Chanthran S S D, Lim P E, Li Y, Liao T Y, Poong S W, Du J, Hussein MAS, Sade A, Rumpet R, Loh K H. 2020. Genetic diversity and population structure of Terapon jarbua (Forskål, 1775) (Teleostei, Terapontidae) in Malaysian waters. ZooKeys, 911: 139-160.
DOI:10.3897/zookeys.911.39222 |
Christianus A, Saad C R. 2009. Traditional uses of horseshoe crabs in Malaysia and Thailand. In: Tanacredi J T, Botton M L, Smith D R eds. Biology and Conservation of Horseshoe Crabs. Springer, New York. 616p.
|
Corral J M, Soliman V S, Yamaoka K. 2013. Otolith and body length relations in the spiny Siganid (Siganus spinus Linnaeus 1758). Asia Life Sciences, 22(1): 303-311.
|
Cottrell P E, Miller E H, Trites A W. 1996. Assessing the use of hard parts in faeces to identify harbour seal prey:results of captive-feeding trials. Canadian Journal of Zoology, 74(5): 875-880.
DOI:10.1139/z96-101 |
Department of Fisheries Malaysia. 2009. Valid Local Name of Malaysian Marine Fishes. Department of Fisheries Malaysia, Ministry of Agriculture and Agro-based Industry, 180p, https://www.fishbase.se/references/FBRefSummary.php?id=85449.
|
Du J, Loh K H, Hu W, Zheng X, Amri AY, Ooi J L S, Ma Z, Rizman-Idid M, Chan A A. 2019. An updated checklist of the marine fish fauna of Redang Islands, Malaysia. Biodiversity Data Journal, (7): e47537.
DOI:10.3897/BDJ.7.e47537 |
Faridah M, Ismail N, Ahmad A B, Manca A, Rahman M Z F A, Bahri M F S, Sofa M F A M, Ghaffar I H A, Alia'm A A, Abdullah N H, Kasturi M M M. 2015. The population size and movement of coastal horseshoe crab, Tachypleus gigas (Müller) on the east coast of peninsular Malaysia.In: Carmichael R H, Botton M L, Shin P K S, Cheung S C eds. Changing Global Perspectives on Horseshoe Crab Biology, Conservation and Management. Springer, Cham.p.213-228, https://doi.org/10.1007/978-3-319-19542-1_11.
|
Fortaleza M A, Uy R C L, Elumba M E, Nañola Jr C L. 2019. Age-growth parameters of Crescent Grunter, Terapon jarbua (Forsskål, 1775) in Mindanao, Philippines. Philippine Journal of Natural Sciences, 24: 42-49.
|
Froese R, Pauly D. 2018. FishBase. World Wide Web Electronic Publication. http://www.fishbase.org. Accessed on 13 February 2020.
|
Froese R, Tsikliras A C, Stergiou K I. 2011. Editorial note on weight-length relations of fishes. Acta Ichthyologica et Piscatoria, 41(4): 261-263.
DOI:10.3750/AIP2011.41.4.01 |
Froese R. 2006. Cube law, condition factor and weight-length relationships:history, meta-analysis and recommendations. Journal of Applied Ichthyology, 22(4): 241-253.
DOI:10.1111/j.1439-0426.2006.00805.x |
Gauldie R W. 1988. Function, form and time-keeping properties of fish otoliths. Comparative Biochemistry and Physiology Part A:Physiology, 91(2): 395-402.
DOI:10.1016/0300-9629(88)90436-7 |
Gumanao G S, Saceda-Cardoza M M, Mueller B, Bos A R. 2016. Length-weight and length-length relationships of 139 Indo-Pacific fish species (Teleostei) from the Davao Gulf, Philippines. Journal of Applied Ichthyology, 32(2): 377-385.
DOI:10.1111/jai.12993 |
Harrison T D. 2001. Length-weight relationships of fishes from South African estuaries. Journal of Applied Ichthyology, 17(1): 46-48.
DOI:10.1046/j.1439-0426.2001.00277.x |
Harvey J T, Loughlin T R, Perez M A, Oxman D S. 2000.Relationship between fish size and otolith length for 63 species of fishes from the Eastern North Pacific Ocean.NOAA Technical Report NMFS, 150:1-36. https://repository.library.noaa.gov/view/noaa/3159. Accessed on 2019-02-08.
|
Hile R. 1936. Age and Growth of the Cisco, Leucichthys artedi(Le Sueur), in the Lakes of the Northeastern Highlands, Wisconsin. Government Printing Office, Washington.p.211-317.
|
Hong S S, Bang S W, Kim Y O, Han M S. 2002. Effects of rainfall on the hydrological conditions and phytoplankton community structure in the riverine zone of the Pal'tang reservoir, Korea. Journal of Freshwater Ecology, 17(4): 507-520.
DOI:10.1080/02705060.2002.9663929 |
Hussain S M, Paperno R, Khatoon Z. 2010. Length-weight relationships of fishes collected from the Korangi-Phitti Creek area (Indus delta, northern Arabian Sea). Journal of Applied Ichthyology, 26(3): 477-480.
DOI:10.1111/j.1439-0426.2009.01374.x |
Isa M M, Rawi C S M, Rosla R, Shah S A M, Shah A S R M. 2010. Length-weight relationships of freshwater fish species in Kerian River Basin and Pedu Lake. Research Journal of Fisheries and Hydrobiology, 5(1): 1-8.
|
Jones R E, Petrell R J, Pauly D. 1999. Using modified lengthweight relationships to assess the condition of fish. Aquacultural Engineering, 20(4): 261-276.
DOI:10.1016/S0144-8609(99)00020-5 |
Kalaycı F, Samsun N, Bilgin S, Samsun O. 2007. Lengthweight relationship of 10 fish species caught by bottom trawl and midwater trawl from the Middle Black Sea, Turkey. Turkish Journal of Fisheries and Aquatic Sciences, 7(1): 33-36.
|
Keys A B. 1928. The weight-length relation in fishes. Proceedings of the National Academy of Sciences of the United States of America, 14(12): 922-925.
DOI:10.1073/pnas.14.12.922 |
Khan S A, Lyla P S, John B A, Khan S A, Lyla P S, John B A, Kuamr C P, Murugan S, Jalal K C A, Lamb T. 1987. The clustal-X windows interface:flexible strategies for multiple sequence alignment aided by quality analysis tools. Biotechnology, 9(3): 489-522.
|
Lavergne E, Zajonz U, Sellin L. 2013. Length-weight relationship and seasonal effects of the summer monsoon on condition factor of Terapon jarbua (Forsskål, 1775)from the Wider Gulf of Aden including Socotra Island. Journal of Applied Ichthyology, 29(1): 274-277.
DOI:10.1111/j.1439-0426.2012.02018.x |
Letourneur Y, Kulbicki M, Labrosse P. 1998. Length-weight relationship of fishes from coral reefs and lagoons of New Caledonia:an update. Naga, the ICLARM Quarterly, 21(4): 39-46.
|
Manoharan J, Gopalakrishnan A, Varadharajan D, Udayakumar C, Priyadharsini S. 2013. Length-weight relationship of crescent perch Terapon jarbua (Forsskal) from Parangipettai Coast, south east coast of India. Journal of Aquaculture Research & Development, 4(4): 1000181.
DOI:10.4172/2155-9546.1000181 |
Mitra B, Naser M. 1987. Length-weight relationship in Clarius Batrachus (Linn.). Proceedings of the Zoological Society, Calcutta, 36: 29-35.
|
Mohamad F, Manca A, Ahmad A, Fawwaz M, Sofa A M, Alia'M A A, Ismail A N. 2016. Width-weight and lengthweight relationships of the tri-spine horseshoe crab, Tachypleus tridentatus (Leach, 1819) from two populations in Sabah, Malaysia:implications for population management. Journal of Sustainability Science and Management, 11(1): 1-13.
DOI:10.1007/s11625-015-0349-x |
Nandikeswari R, Sambasivam M, Anandan V. 2014. Length weight relationship of Terapon jarbua (Forsskal, 1775)from Puducherry waters. International Journal of Bioengineering and Life Science, 8(3): 271-275.
DOI:10.5281/zenodo.1091772 |
Nedreaas K. 1990. Age determination of northeast Atlantic Sebastes species. ICES Journal of Marine Science, 47(2): 208-230.
DOI:10.1016/j.icesjms.2005.01.018 |
Pauly D, Cabanban A, Torres Jr F S B. 1996. Fishery biology of 40 trawl-caught Teleosts of Western Indonesia. In: Pauly D, Martosubroto P eds. Baseline Studies of Biodiversity: the Fish Resource of western Indonesia.International Center for Living Aquatic Resources Management, Philippines. p.135-216.
|
Radhi A M, Fazlinda M F N, Amal M N A, Rohasliney H. 2018. A review of length-weight relationships of freshwater fishes in Malaysia. Transylvanian Review of Systematical and Ecological Research, 20(1): 55-68.
DOI:10.1515/trser-2018-0005 |
Rao D V, Devi K, Rajan P. 2000. An Account of Ichthyofauna of Andaman & Nicobar Islands, Bay of Bengal. Zoological Survey of India: p.1-434.
|
Reiss M J. 1991. The Allometry of Growth and Reproduction.Cambridge University Press, New York. 198p.
|
Riede K. 2004. Global Register of Migratory Species: from Global to Regional Scales. Final Report of the R & DProjekt 808 05 081. Federal Agency for Nature Conservation, Bonn, Germany. 329p.
|
Saleem B M, Farooq R Y, Masood Z. 2016. Length-weight relationship of Epinephelus diacanthus (Family Serranidae; sub-family Epinephelinae) collected from Karachi fish harbour, Pakistan. FUUAST Journal of Biology, 6(2): 225-229.
|
See M, Marsham S, Chang C W, Chong V C, Sasekumar A, Dhillon S K, loh K H. 2016. The use of otolith morphometrics in determining the size and species identification of eight mullets (Mugiliformes:Mugilidae)from Malaysia. Sains Malaysiana, 45(5): 735-743.
|
Shaari F, Mustapha M A. 2017. Factors influencing the distribution of chl-a along coastal waters of east peninsular Malaysia. Sains Malaysiana, 46(8): 1191-1200.
DOI:10.17576/jsm-2017-4608-04 |
Tuset V M, Lombarte A, Assis C A. 2008. Otolith atlas for the western Mediterranean, north and central eastern Atlantic. Scientia Marina, 72(S1): 7-198.
DOI:10.3989/scimar.2008.72s17 |
Vari R P. 1978. The Terapon Pperches (Percoidei, Teraponidae): a Cladistic Analysis and Taxonomic Revision.
|
Waessle J A, Lasta C A, Favero M. 2003. Otolith morphology and body size relationships for juvenile Sciaenidae in the Río De La Plata estuary (35-36 S). Scientia Marina, 67(2): 233-240.
DOI:10.3989/scimar.2003.67n2233 |
Wang X H, Qiu Y S, Zhu G P, Du F Y, Sun D R, Huang S L. 2011. Length-weight relationships of 69 fish species in the Beibu Gulf, northern South China Sea. Journal of Applied Ichthyology, 27(3): 959-961.
DOI:10.1111/j.1439-0426.2010.01624.x |
Williams T, Bedford B C. 1974. The use of otoliths for age determination. In: Bagenal T B ed. The Ageing of Fish.Unwin Brothers Ltd, Old Working, England. p.114-123.
|
Wootton R J. 1990. Ecology of Teleost Fishes. Chapman & Hall, London. p.159-195.
|
Yamagawa H. 1994. Length-weight relationship of Gulf of Thailand fishes. Naga, the ICLARM Quarterly, 17(4): 48-52.
|
Zakaria M Z, Jalal K C A, Ambak M A. 2000. Length weight relationship and relative condition factor of Sebarau, Hampala Macrolepidota (van Hasselt) in Kenyir Lake, Malaysia. Pakistan Journal of Biological Sciences, 3(5): 721-724.
DOI:10.3923/pjbs.2000.721.724 |
Zengin M, Saygin S, Polat N. 2015. Otolith shape analyses and dimensions of the anchovy Engraulis encrasicolus L. in the Black and Marmara Seas. Sains Malaysiana, 44(5): 657-662.
DOI:10.17576/jsm-2015-4405-03 |
Zhang J D, Song B L, Chen G. 2002. Study on the age and growth of Therapon jarbua. Marine Sciences, 26(7): 62-66.
(in Chinese) |