 2021, Vol. 39
Institute of Oceanology, Chinese Academy of Sciences
Article Information
- SHI Yunlong, YANG Dezhou, HE Yijun
- Numerical study on interaction between eddies and the Kuroshio Current east of Taiwan, China
- Journal of Oceanology and Limnology, 39(2): 388-402
- http://dx.doi.org/10.1007/s00343-020-0010-0
Article History
- Received Jan. 14, 2020
- accepted in principle Mar. 16, 2020
- accepted for publication Apr. 1, 2021


2 Key Laboratory of Ocean Circulation and Waves, Institute of Oceanology, Chinese Academy of Sciences, Qingdao 266071, China;
3 Function Laboratory for Ocean Dynamics and Climate, Qingdao National Laboratory for Marine Science and Technology, Qingdao 266000, China;
4 Center for Ocean Mega-Science, Chinese Academy of Sciences, Qingdao 266071, China
The Kuroshio Current is a very strong western boundary current in the world ocean and plays an important role in oceanic thermal transport and climate change in the Northwestern Pacific. Northeast of Taiwan, China, the northward-flowing Kuroshio Current turns northwestward and then flows northeastward into the East China Sea (ECS). The low-frequency variations in the Kuroshio volume transport (KVT) directly affect the sea surface temperature (SST) anomalies in the Kuroshio area, which affect the atmospheric circulation and precipitation and then have important influence on regional climates, coastal ecosystems and fisheries (Chow et al., 2015; Kamidaira et al., 2017). A large number of studies have pointed out that the temporal variability in the structure and strength of the Kuroshio east of Taiwan, China, is mainly caused by eddies, which propagate from the interior ocean to the region east of Taiwan, China (Yang et al., 1999; Zhang et al., 2001; Liu et al., 2004; Lee et al., 2013; Wu et al., 2017; Wang et al., 2019). On the basis of satellite altimetry, surface buoy drifters, hydrographic observations and tidal stations, Yang et al. (1999) reported that cyclonic (anticyclonic) eddies impinging on the Kuroshio east of Taiwan, China, decrease (increase) the KVT through the East Taiwan Channel (ETC). Zhang et al. (2001) concluded that the 100 day KVT variation observed by Johns et al. (2001) is related to Subtropical Countercurrent (STCC) eddies generated through barotropic and baroclinic instabilities (Gill et al., 1974; Qiu, 1999; Qiu et al., 2014). Lee et al. (2013) showed that the KVT fluctuation east of Taiwan, China, is related to the impinging eddies. Using the 20 year JCOPE2 reanalysis data, Chang et al. (2015) analyzed the effects of eddies on the upstream Kuroshio and pointed out that warm (cold) eddies enhance (weaken) the strength of the Kuroshio Current due to upstream convergence (divergence) and downstream divergence (convergence). Yan et al. (2016) showed that both cyclonic and anticyclonic eddies are able to weaken or strengthen the KVT, depending on the relative strength of the mass divergence and convergence produced upstream and downstream of the eddies. Yin et al. (2017) explained the influence of the eddies on the Kuroshio onshore intrusion northeast of Taiwan, China, from the perspectives of potential vorticity gradient and the shelf slope constraint.
Using a numerical simulation method, Chern and Wang (2005) studied the interaction between the western boundary current (WBC) and a cyclonic eddy induced by a typhoon through the reduced gravity primitive equation model. Their results showed that the interaction causes the eddy deform into an ellipse and transferred energy from the eddy into the mean flow. Kuo and Chern (2011) further pointed out that an anticyclonic eddy can extract energy from the mean flow during the eddy-flow interaction. However, the anticyclonic eddy still decays due to friction dissipation during the interaction period. Based on results from one-and-ahalf layer models, Vandermeirsch et al. (2003) concluded that weak eddies drift quasi-steadily along the jet, while strong eddies can cross a jet and generate an opposite-sign vorticity patch due to their interactions with the jet. In especial, they pointed out that the β effect is insufficient to drive all eddies through the jet. Using the three-dimensional primitive equations ocean model (POM), Geng et al.(2016, 2018) studied the eddy-mean flow interaction, where eddies are generated by an idealized typhoon to the east of the Philippine Islands. The results show that eddies propagate toward the Kuroshio after generation and that once they reach the Kuroshio, they will translate northward along the eastern side of the Kuroshio. Waseda et al. (2002) studied the interaction between a mesoscale eddy and the Kuroshio Current using a fine-resolution regional general circulation model and revealed that the mesoscale eddy to the southeast of Kyushu can trigger short-term Kuroshio meanders south of Japan. Using semi-idealized numerical simulations, Jan et al. (2017) studied the evolution of interactions between eddies and the Kuroshio Current, and showed that when eddies impinge on the Kuroshio within latitudes 21.5°N–22.5°N east of Taiwan, China, the velocity and volume transport in the Kuroshio at 23.7°N change first, followed by opposite vertical displacements in the sea surface height and isopycnal. These eddies eventually dissipate and are absorbed by the Kuroshio along the shelf break in the ECS, or partly split to the southeast of the Ryukyu Islands. Sheu et al. (2010) examined the conditions when eddies can or cannot freely propagate westward through the Luzon Strait into the South China Sea (SCS) using a numerical model and identified that the key factors are the strength of transport of the Kuroshio and the curvature of the Kuroshio just north of Luzon Island. Zheng et al. (2011) further analyzed the interaction between eddies and the Kuroshio at the Luzon Strait using satellite altimeter data and the scale analysis indicated that for small eddies, the Kuroshio serve as a dynamic shield to block eddies' westward propagation; large eddies can alter the Kuroshio and penetrate through the Luzon Strait. Affected by the island of Taiwan, China, the Kuroshio east of Taiwan, China, is relatively stable. What is the collision process between eddies and the Kuroshio? Whether the eddy can cross the Kuroshio to reach the western side of the Kuroshio is important in studying the exchange of water, matter and energy between the ocean and the continental shelf, especially the shelf of the East China Sea (ECS). It is emphasized that the present study is designed to examine the effects only of an eddy's type on the Kuroshio and importantly, the water exchange between ocean and continental shelf.
A large number of data analyses show that there are significant multiscale temporal changes of KVT east of Taiwan, China. At present, it is generally accepted that the 100-day oscillation of the Kuroshio Current east of Taiwan, China, is mainly attributed to eddies from the interior ocean. Figure 1 shows the spatial and temporal evolution of mesoscale eddies detected from AVISO when they impinge on the Kuroshio Current east of Taiwan, China. However, the interaction between eddies and the Kuroshio Current is very complicated, and the effects of different types of eddies on the Kuroshio are significantly different. Previous research has mainly focused on the analysis of observational data and on simple numerical simulations such as the reduced gravity primitive equation model (Chern and Wang, 2005). Although short-term measurements have partly revealed these processes, the spatial and temporal observations are too coarse to capture the interaction process in detail. Satellite altimeters and buoy drifters only provide data at the sea surface and cannot be used to analyze the three-dimensional structure of the interaction between eddies and the Kuroshio Current, and the spatial and temporal resolution of mooring data are too coarse to resolve the process. There are currently insufficient observations to analyze the trajectory of the water mass in the eddies. Therefore, it remains unclear how the eddies influence the curvature and shape of the Kuroshio path, and the water exchange between ocean and shelf

|
| Fig.1 Spatial and temporal evolution of mesoscale eddies and the Kuroshio east of Taiwan, China, detected from AVISO sea surface heights and the corresponding geostrophic currents a. an anticyclonic eddy interacts with Kuroshio; b. a cyclonic eddy interacts with Kuroshio. The eddy center is marked by white "+". AVISO sea surface heights and associated products are available at http://www.aviso.oceanobs.com/en/data/products.html. |
In this paper, we designed fine-resolution numerical experiments to simulate the interactions between isolated eddies and the Kuroshio Current. The propagation characteristics of different types of eddies, three-dimensional variations in the Kuroshio Current when eddies impinge on them east of Taiwan, China, the distribution characteristics of the water carried by eddies off Taiwan, China, and the dynamic mechanism for the eddy-Kuroshio interaction will be discussed in detail. The structure of this paper is organized as follows. The model description and methodology will be presented in Section 2. The interaction between eddies and the Kuroshio Current will be discussed in Section 3, and our conclusions follow in Section 4.
2 MODEL DESCRIPTION AND METHODOLOGY 2.1 Model descriptionThe model is based on the Regional Ocean Modeling System (ROMS), which is a three-dimensional, free surface, terrain-following (Song and Haidvogel, 1994) numerical model that solves the primitive equation for momentum, salinity and temperature. For details of the ROMS computational algorithms, please refer to Shchepetkin and McWilliams (2005). The box outlined by the black solid line in Fig. 2 shows the model domain (105°E–136°E, 15.5°N–41°N). The horizontal resolution is 1/20°×1/20°cosφ (φ is latitude), and 31 nonlinear, terrain-following sigma layers are used in the vertical direction. Spatial resolution is about 4 km and time step is 240 s. The configuration of the model is the same as that in Yang et al. (2012). The bottom topography is obtained from a combination of topographic data sets ETOPO1 and ETOPO5 (http://www.ngdc.noaa.gov/mgg/global/). For spin-up of the model, it is forced by monthly mean climatology data with an annual cycle of 360 days and integrated for 9 years. The climatology data are composed of the monthly mean wind stresses, net heat fluxes, net freshwater fluxes, surface solar shortwave radiation, sea surface temperatures, and sea surface salinities from COADS (Diaz et al., 2002). The model is also forced by tidal forcing (10 constituents) from the TPX007 (Egbert and Erofeeva, 2002). The open boundary conditions and initial fields of the model are interpolated from the model results of the North Pacific region with coarse resolution (Yang et al., 2012). For more detailed configuration of the model used by spinup runs, please refer to Yang et al.(2011, 2012, 2018).

|
| Fig.2 Model domain The red point is the initial position of the anticyclonic eddy (126°E, 23°N), the blue point is the initial position of the cyclonic eddy (126°E, 22°N). Gray contours are isobaths (m) |
After a spin-up period of 9 years, the model reaches an equilibrium state, and one more year is calculated as the control (CT) experiment. Figure 3 is the nearsurface (10 m) flow field of the CT model result for spring, summer, autumn and winter. The Kuroshio path in the Luzon Strait tends to loop into the SCS in winter, while it tends to leap across the Luzon Strait (LS) in summer (Centurioni et al., 2004; Wu and Chiang, 2007). Using Argos satellite tracked drifters, Centurioni et al. (2004) found surface Kuroshio water can intrude far westward into the SCS, especially in winter. Our model results are consistent with the flow patterns in this region.

|
| Fig.3 Near-surface currents of the CT experiment Current speeds are color shaded: spring (averaged from March to May), summer (averaged from June to August), autumn (averaged from September to November), and winter (averaged from December to February). |
Northeast of Taiwan, China, the Kuroshio Current is blocked by the ECS shelf break in summer (Hsueh et al., 1993), and intrudes onto the shelf of the ECS in winter and spring (Hsueh et al., 1992; Tang et al., 2000). The KVT northeast of Taiwan, China, is stronger in summer and weaker in winter (Hsin et al., 2011). From the mooring array deployed along the PCM-1 section across the ETC between September 1994 and May 1996, the flow direction varies greatly, and the mean KVT obtained is 21.5±2.5 Sv with a dominant period of 100 days (Johns et al., 2001; Zhang et al., 2001). Our model results are also consistent with the flow patterns in this region, and the annual mean KVT obtained from CT experiment is 19.7 Sv. In addition, our model simulates the dual-core structure of Kuroshio east of Taiwan, China (Andres et al., 2015; Jan et al., 2015; Yang et al., 2015). Therefore, our model results capture the main structure of the Kuroshio Current in this area and can be used to study the influence of eddies on the Kuroshio Current.
2.3 Eddy initializationWe use quasi-geostrophic theory to construct an ideal mesoscale eddy and then insert it into our initial model fields. Considering the linear potential vorticity equation (Pedlosky, 1987), the following is obtained:
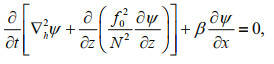 (1)
(1)where ψ is the stream function, f0 is the local Coriolis parameter, N is the buoyancy frequency, and β is the gradient of the Coriolis parameter. For a flat bottom, ψ can be expressed as
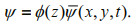 (2)
(2)Substituting Eq.2 into Eq.1, we obtain
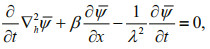 (3)
(3)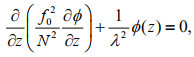 (4)
(4)where λ2 is the separation constant. The boundary conditions of the vertical structure ϕ are subject to
 (5)
(5)Equations 4 & 5 form an eigenvalue problem, which can be solved by numerical methods. Figure 4 shows the vertical modes (one barotropic mode and the first three baroclinic modes) of the Rossby wave at (126°E, 23°N). The space-time character of the dynamic anomaly in the ocean is very similar to that expected for freely propagating, linear, first baroclinic Rossby waves, so only the first mode of the vertical structure is used (Chelton and Schlax, 1996).

|
| Fig.4 Vertical mode ϕ(z): one barotropic mode and the first three baroclinic modes of the Rossby wave at (126°E, 23°N) The temperature and salinity data are derived from WOA09 (http://www.nodc.noaa.gov/OC5/WOA09/pubwoa09.html). |
In polar coordinates, the horizontal structure of the steam function is
 (6)
(6)here LE is the eddy length scale and M is the intensity of the eddy which can be determined by the observation the of eddy in the ocean. u, v, ρ can be obtained by using
 (7)
(7)Note that the barotropic mode is included to make the bottom velocity zero. The sea surface elevation is computed to be consistent with the surface flow. The temperature field is obtained from the linear equation of state (assuming salinity is constant)
 (8)
(8)where ρ0, T0 and S0 are the values for reference density, temperature, and salinity, respectively; T is the temperature, S is the salinity, α is the thermal expansion coefficient and β is the haline contraction coefficient. These are the fields used to configure the ideal mesoscale eddy. To integrate the ideal mesoscale eddy into the background field, we design a function
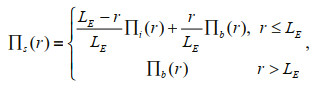 (9)
(9)where LE is the radius of the mesoscale eddy, Πi is the variable field of the ideal mesoscale eddy, Πb is the background variable field, and Πs is the composite variable field. The method of constructing mesoscale eddy is applicable to both anticyclonic eddy and cyclonic eddy. The only difference is the sign of M, positive sign indicates anticyclonic eddy, and negative sign indicates cyclonic eddy. Figures 5&6 show the sea surface height, velocity field, temperature profile and velocity profile of anticyclonic eddy and cyclonic eddy after merging with background field respectively. By analyzing satellite altimeter data, the typical sea surface height anomaly of the eddies east of Taiwan, China, is 0.5 m and the radius is 100 km as shown in Fig. 1. Therefore, in the paper we choose the sea surface height anomaly of the eddy to be 0.6 m and the width to be 120 km. The constructed eddy structure is reasonable, and the temperature and velocity distribution characteristics are consistent with the results from observations (Yang et al., 2013; Dai et al., 2020).

|
| Fig.5 The characteristics of the anticyclonic eddy a. the sea surface height; b. the velocity field of the sea surface; c. the temperature profile; d. the velocity profile. |

|
| Fig.6 The characteristics of the cyclonic eddy a. the sea surface height; b. the velocity field of the sea surface; c. the temperature profile; d. the velocity profile. |
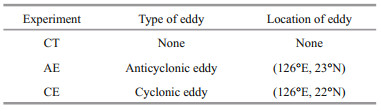
After a spin-up period of 9 years, the model reaches the equilibrium state, and one more year is calculated as the control (CT) experiment. Combine the model results at the end of the 9th model year with the constructed ideal field of an anticyclonic eddy (AE) and cyclonic eddy (CE) and then integrate the model for 1 year; the results are recorded as the AE experiment and as the CE experiment (Table 1). According to nonlinear quasi-geostrophic theory, anticyclonic eddies propagate westward with some southward deflection, and cyclonic eddies propagate westward with some northward deflection (Shi et al., 2018). This result also has been confirmed by observations (Chelton et al., 2007, 2011). Therefore, to make the eddy collide with the Kuroshio Current east of Taiwan, China, the initial position of the cyclonic eddy is moved southward relative to the anticyclonic eddy. In addition, a passive tracer is released in the eddies from top to bottom with a constant concentration of 3 kg/m3 to track the water trajectory.
|
The model results show good capability for reproducing the main features regarding the interaction between eddies and Kuroshio east of Taiwan, China, as shown in Fig. 7. Anticyclonic (cyclonic) eddies propagate westward with equatorward (poleward) deflection due to the combination of the β effect and self-advection (Chelton et al., 2007, 2011; Shi et al., 2018). During the interaction between eddies and the Kuroshio Current, anticyclonic eddies cannot cross the Kuroshio to reach the region west of the Kuroshio Current but are advected northward along the eastern side of the Kuroshio Current. However, cyclonic eddies can be entrained to the region west of the Kuroshio Current and then flow northward along the western side of the Kuroshio Current, causing large offshore Kuroshio meandering. Compared with Fig. 1, the modeled spatial and temporal evolution of mesoscale eddies and the Kuroshio Current reveals the typical characters of eddy-Kuroshio interactions and can be used to examine the detailed evolution of eddy-Kuroshio interactions.

|
| Fig.7 Near-surface currents and tracer to the east of Taiwan, China a. AE experiment, where the solid red and blue lines indicate the K1 and K2 sections, respectively; b. CE experiment. |
The ETC is the key location for the exchange of water between the oceanic waters and the ECS shelf. We focus on the temporal and spatial variations of the eddy and the Kuroshio Current east of Taiwan, China, especially along the K1 (east of Taiwan, China, to Yonaguni Island) and K2 (Yonaguni Island to Ishigaki Island, see Fig. 7) sections, and the destination of waters carried by eddy after it impinges on the Kuroshio Current.
3.1 The influence of an anticyclonic eddy on the Kuroshio CurrentThe anticyclonic eddy influence on the Kuroshio Current can be clearly shown by the tracer experiment. The tracer distribution from the AE experiment in Fig. 7 shows that the anticyclonic eddy moves slightly southward during its westward propagation and then moves northward after reaching Kuroshio (123°E, 22°N). The near-surface current and tracer patterns suggest that the seawater carried by the eddy cannot cross the Kuroshio and reach the eastern coast of Taiwan, China; instead, it moves northward along the eastern side of the Kuroshio Current. At the same time, the mainstream of the Kuroshio Current crosses the Ilan ridge, flows directly northeastward and weakens its intrusion onto the shelf of ECS. Figure 8 is the tracer and velocity v profile along the 22.5°N section on April 11. The seawater above 600 m in the eddy flows northward due to advection of the Kuroshio Current; however, the seawater below 600 m moves westward and reaches the region east of Taiwan, China, and then some water flows northward along the shelf break accompanied by an upwelling of deep water. In the CT experiment, the tracer also reaches the areas east of Taiwan, China, but they appear approximately half a month later than in the AE experiment. It is important to note that due to the anticyclonic eddy, the tracer east of Taiwan, China, appears one month earlier than for the CT run. At the end of April, the anticyclonic eddy arrives at the K1 and K2 sections. Due to the influence of topography, the eddy swirls rapidly and the seawater near its western edge enters the ECS, causing a large meridional velocity at the K1 section. Eventually, the eddy dissipates to the south of Iriomote Island.

|
| Fig.8 Profile along 22.5°N on 11 April in the AE experiment a. meridional velocity v profile; b. tracer profile. |
To understand the spatial and temporal changes in the Kuroshio Current when it is impinged upon by an anticyclonic eddy, the KVT and velocity v profile along the K1 and K2 sections will be discussed. In this paper, KVT is calculated from the upper 600 m of the Kuroshio Current. In Fig. 9, the KVT across the K1 (K2) section first decreases (increases) and then increases (decreases) during the interaction between the anticyclonic eddy and the Kuroshio Current. The KVT in the K1 section reaches a minimum (maximum) value at the beginning of March (at the end of April). The mean KVT is 17 Sv with a standard deviation of 5 Sv, which is consistent with the observations of Chang et al. (2018). Along the K1 and K2 sections, the profile velocity v comparisons between the AE and CT experiments in Fig. 10 show that the Kuroshio velocity decreases, the main axis moves offshore, and the flow direction reverses from south to north between Yonaguni Island and Ishigaki Island. From the near-surface current east of Taiwan, China, it can be seen that the Kuroshio Current is split into two branches northwest of the eddy when the anticyclonic eddy reaches the domain east of Taiwan, China, and south of Yonaguni Island. The mainstream flows through the K1 section into ECS, and the other branch flows through the K2 section flow into the ECS.

|
| Fig.9 KVT above 600 m in the CT experiment, AE experiment, and CE experiment |

|
| Fig.10 Meridional velocity v along 24.5°N, calculated from model results |
The distribution of the tracer in the CE experiment (Fig. 7) shows that the cyclonic eddy moves northward during the westward propagation and reaches the area (123.5°E, 22.5°N) on February 6. When the western edge of the cyclonic eddy collides with the eastern edge of the Lanyu cold eddy (see Fig. 7), it causes a large cyclonic meander of the Kuroshio Current east of Taiwan, China, and moves the Kuroshio main axis to the eastern side of the cyclonic eddy; the eddy then moves northward and eventually dissipates between 23°N–24°N east of Taiwan, China. This phenomenon also has been discussed by Yang et al. (2015) using surface velocity program drifter data. On February 20, under the influence of the near-surface flow, part of the tracer in the eddy moves northward and arrives at an area northeast of Taiwan, China, and continental shelf, and part of the tracer moves southward and reaches the domain southeast of Taiwan, China.
As shown in Fig. 9, the KVT variation along the K1 (K2) section reaches the minimum (maximum) value at the beginning of April due to the interaction between a cyclonic eddy and the Kuroshio Current. From the profile of velocity v for the K1 and K2 sections, the velocity of the Kuroshio is smaller on April 6 than the CT experiments, the main axis of Kuroshio moves eastward away from the shelf break and the flow between Yonaguni Island and Ishigaki Island goes northward. From the near-surface current field east of Taiwan, China, in Fig. 7, it can be seen that the cyclonic eddy reaches a domain east of Taiwan, China, and south of Ilan Ridge, causing the Kuroshio to be divided into two branches northeast of the eddy. The main branch goes northward through the K1 section into the ECS, and the other branch flows northward into the ECS through the K2 section.
Figure 11 shows the tracer profile at 23°N (AE experiment) and at 22°N (CE experiment) at the end of the modeling calculations. It can be seen that both the anticyclonic and cyclonic eddies are capable of transporting water as deep as 2 000 m.

|
| Fig.11 The tracer profile on 26 December a. along 23°N in the AE experiment; b. along 22°N in the CE experiment. |
To summarize, when an anticyclonic eddy arrives at (123°E, 22°N), the seawater above 600 m flows northward into the ECS along the eastern side of Kuroshio, while the seawater between 600 and 1 500 m flows westward through the bottom of Kuroshio. When the cyclonic eddy arrives at (124°E, 22.5°N), it collides with Kuroshio, causing a large seaward bending of the Kuroshio and entraining the eddy to the region west of the Kuroshio, which then flows northward with the Kuroshio Current. In the CE, the seawater above 600 m can cross the Ilan Ridge to enter the ECS and intrude onto the shelf of the ECS, while the seawater below 600 m mostly flows eastward and joins the waters east of Ryukyu Islands under the influence of topography (not shown). The impact of Kuroshio on the eddies is mainly confined within the upper 600 m. Due to the complex hydrological and topographical features to the east of Taiwan, China, the destinations of seawater below 600 m will be analyzed in detail future.
3.3 Dynamical mechanismIn this section, we discuss the dynamical mechanism for the different water exchange patterns induced by cyclonic and anticyclonic eddies. The vertical structures of density, Brunt-Väisälä frequency, and potential vorticity along the sections approximately across the eddies center during the eddy-Kuroshio collision are shown in Fig. 12. The Brunt-Väisälä frequency is calculated using 


|
| Fig.12 Snapshots of near-surface currents and vertical profiles of density, Brunt-Väisälä frequency, and potential vorticity a. near-surface currents on March 11 in AE experiment (red line indicates the zonal section crossing the anticyclonic eddy center; b. profile of Brunt-Väisälä frequency in AE experiment (red contours are density, and red dashed line is the position of the anticyclonic eddy center); c. profile of Brunt-Väisälä frequency in CT experiment (black contours are density); d. the difference (AE-CT); e. profile of potential vorticity in AE experiment; f. near-surface currents on February 21 in CE experiment (blue line indicates the zonal section crossing the cyclonic eddy center; g. profile of Brunt-Väisälä frequency in CE experiment (blue contours are density, and blue dashed line is the position of the cyclonic eddy center); h. profile of Brunt-Väisälä frequency in CT experiment (black contours are density); i. the difference (CE-CT); j. profile of potential vorticity in CE experiment. |
Based on the stratified fluid quasi-geostrophic theory, ideal cyclonical and anticyclonal eddies are constructed, and we conduct the fine-resolution numerical experiments to simulate the interaction between the eddies and the Kuroshio Current. The propagation characteristics of different types of eddies, the three-dimensional structure of the eddies and of the Kuroshio Current, the water destinations of eddies and the dynamic mechanism for the eddyKuroshio interaction are discussed. The eddies propagate westward at a velocity of the first baroclinic Rossby wave due to the β effect. After the eddy reaches the domain east of Taiwan, China, the spatial structure of the Kuroshio Current is changed by the interaction between the eddy and the Kuroshio Current, which induces significant KVT fluctuations.
When an anticyclonic eddy collides with the Kuroshio Current, the upper water of anticyclonic eddy cannot cross the Kuroshio to reach the west side of the Kuroshio but instead flows northward along the eastern side of the Kuroshio Current. When an anticyclonic eddy reaches the K1 and K2 sections, the Kuroshio main axis in the K1 and K2 sections is first offshore then onshore, causing the KVT at the K1 (K2) section to first decrease (increase) and then to increase (decrease). When the oceanic water carried by the anticyclonic eddies reaches the area east of Taiwan, China, the upper water (< 600 m) flows into the ECS along the eastern side of Kuroshio. In contrast, the water below 600 m continues to flow westward through the bottom of the Kuroshio due to the weak influence of Kuroshio. On the other hand, when a cyclonic eddy collides with the Kuroshio Current, a cyclonic eddy can be entrained to a region west of the Kuroshio and then flow northward along the western side of the Kuroshio Current, causing offshore Kuroshio meandering and low (high) KVT at the K1 (K2) section. The materials carried by cyclonic eddies can go through the Kuroshio Current and reach the region west of the Kuroshio Current. The upper 600 m waters can cross the Ilan Ridge to enter the ECS and intrude onto the shelf of the ECS. The waters below 600 m cannot flow over Ilan Ridge due to the topography but flow toward the region east of the Ryukyu Islands before reaching the Ilan Ridge.
The effects of different types of eddies on water and materials exchange between the upper open ocean and the ECS are significantly different. This study suggests a mechanism that the cyclonic (anticyclonic) eddy decrease (increase) the horizontal PV gradient, or PV barrier, whereby the upper cyclonic (anticyclonic) eddy can (cannot) cross the Kuroshio Current. It is critical for understanding the water and material exchange between the interior ocean and the ECS. This study implies that the ECS continental shelf can potentially be influenced by a cyclonic eddy in the open ocean, which can transport heat, and material in upper open ocean across the Kuroshio Current to the ECS shelf waters. In a realistic environment, the eddy-Kuroshio interactions are much more complex. The present study only considers the interactions between a typical size eddy and Kuroshio Current. The velocity magnitude and width of the Kuroshio, the size and depth range of the eddy play roles as well. For cyclonic eddy, if the Kuroshio Current is very strong or the eddy is very small, it is likely that the eddy cannot cross the Kuroshio Current. For anticyclonic eddy, if the Kuroshio Current is weak or the eddy is very large, it is not easy to speculate whether the eddy can cross the Kuroshio Current. We will examine them in the further. Due to the complex hydrological and topographical features to the east of Taiwan, China, the destinations of seawater below 600 m carried by eddies also will be analyzed in detail future.
5 DATA AVAILABILITY STATEMENTAVISO sea surface heights and associated products are available at http://www.aviso.oceanobs.com/en/data/products.html. Model outputs and cruise data are available upon request from the corresponding author (yangdezhou@qdio.ac.cn).
Andres M, Jan S, Sanford T B, Mensah V, Centurioni L R, Book J W. 2015. Mean structure and variability of the Kuroshio from northeastern Taiwan to southwestern Japan. Oceanography, 28(4): 84-95.
DOI:10.5670/oceanog.2015.84 |
Centurioni L R, Niiler P P, Lee D K. 2004. Observations of inflow of Philippine Sea surface water into the South China Sea through the Luzon Strait. Journal of Physical Oceanography, 34(1): 113-121.
DOI:10.1175/1520-0485(2004)034<0113:OOIOPS>2.0.CO;2 |
Chang M H, Jan S, Mensah V, Andres M, Rainville L, Yang Y J, Cheng Y C. 2018. Zonal migration and transport variations of the Kuroshio east of Taiwan induced by eddy impingements. Deep Sea Research Part Ⅰ: Oceanographic Research Papers, 131: 1-15.
DOI:10.1016/j.dsr.2017.11.006 |
Chang Y L, Miyazawa Y, Guo X Y. 2015. Effects of the STCC eddies on the Kuroshio based on the 20-year JCOPE2 reanalysis results. Progress in Oceanography, 135: 64-76.
DOI:10.1016/j.pocean.2015.04.006 |
Chelton D B, Schlax M G, Samelson R M, De Szoeke R A. 2007. Global observations of large oceanic eddies. Geophysical Research Letters, 34(15): L15606.
DOI:10.1029/2007GL030812 |
Chelton D B, Schlax M G, Samelson R M. 2011. Global observations of nonlinear mesoscale eddies. Progress in Oceanography, 91(2): 167-216.
DOI:10.1016/j.pocean.2011.01.002 |
Chelton D B, Schlax M G. 1996. Global observations of oceanic Rossby waves. Science, 272(5259): 234-238.
DOI:10.1126/science.272.5259.234 |
Chern C S, Wang J. 2005. Interactions of mesoscale eddy and western boundary current: a reduced-gravity numerical model study. Journal of Oceanography, 61(2): 271-282.
DOI:10.1007/s10872-005-0037-z |
Chow C H, Liu Q Y, Xie S P. 2015. Effects of Kuroshio intrusions on the atmosphere northeast of Taiwan Island. Geophysical Research Letters, 42(5): 1465-1470.
DOI:10.1002/2014GL062796 |
Dai J, Wang H Z, Zhang W M, An Y Z, Zhang R. 2020. Observed spatiotemporal variation of three-dimensional structure and heat/salt transport of anticyclonic mesoscale eddy in Northwest Pacific. Journal of Oceanology and Limnology.
DOI:10.1007/s00343-019-9148-z |
Diaz H F, Folland C K, Manabe T, Parker D. 2002. Workshop on advances in the use of historical marine climate data. WMO Bulletin, 51(4): 377-380.
|
Egbert G D, Erofeeva S Y. 2002. Efficient inverse modeling of barotropic ocean tides. Journal of Atmospheric and Oceanic Technology, 19(2): 183-204.
DOI:10.1175/1520-0426(2002)019<0183:EIMOBO>2.0.CO;2 |
Geng W, Xie Q, Chen G X, Liu Q Y, Wang D X. 2018. A threedimensional modeling study on eddy-mean flow interaction between a Gaussian-type anticyclonic eddy and Kuroshio. Journal of Oceanography, 74(1): 23-37.
DOI:10.1007/s10872-017-0435-z |
Geng W, Xie Q, Chen G X, Zu T T, Wang D X. 2016. Numerical study on the eddy-mean flow interaction between a cyclonic eddy and Kuroshio. Journal of Oceanography, 72(5): 727-745.
DOI:10.1007/s10872-016-0366-0 |
Gill A E, Green J S A, Simmons A J. 1974. Energy partition in the large-scale ocean circulation and the production of mid-ocean eddies. Deep Sea Research and Oceanographic Abstracts, 21(7): 499-508.
DOI:10.1016/0011-7471(74)90010-2 |
Hsin Y C, Chiang T L, Wu C R. 2011. Fluctuations of the thermal fronts off northeastern Taiwan. Journal of Geophysical Research: Oceans, 116(C10): C10005.
DOI:10.1029/2011JC007066 |
Hsueh Y, Chern C S, Wang J. 1993. Blocking of the Kuroshio by the continental shelf northeast of Taiwan. Journal of Geophysical Research: Oceans, 98(C7): 12351-12359.
DOI:10.1029/93JC01075 |
Hsueh Y, Wang J, Chern C S. 1992. The intrusion of the Kuroshio across the continental shelf northeast of Taiwan. Journal of Geophysical Research: Oceans, 97(C9): 14323-14330.
DOI:10.1029/92JC01401 |
Jan S, Mensah V, Andres M, Chang M H, Yang Y J. 2017. Eddy-Kuroshio interactions: local and remote effects. Journal of Geophysical Research: Oceans, 122(12): 9744-9764.
DOI:10.1002/2017JC013476 |
Jan S, Yang Y J, Wang J, Mensah V, Kuo T H, Chio M D, Chern C S, Chang M H, Chien H. 2015. Large variability of the Kuroshio at 23.75°N east of Taiwan. Journal of Geophysical Research: Oceans, 120(3): 1825-1840.
DOI:10.1002/2014JC010614 |
Johns W E, Lee T N, Zhang D X, Zantopp R, Liu C T, Yang Y. 2001. The Kuroshio east of Taiwan: moored transport observations from the WOCE PCM-1 array. Journal of Physical Oceanography, 31(4): 1031-1053.
DOI:10.1175/1520-0485(2001)031<1031:TKEOTM>2.0.CO;2 |
Kamidaira Y, Uchiyama Y, Mitarai S. 2017. Eddy-induced transport of the Kuroshio warm water around the Ryukyu Islands in the East China Sea. Continental Shelf Research, 143: 206-218.
DOI:10.1016/j.csr.2016.07.004 |
Kuo Y C, Chern C S. 2011. Numerical study on the interactions between a mesoscale eddy and a western boundary current. Journal of Oceanography, 67(3): 263-272.
DOI:10.1007/s10872-011-0026-3 |
Lee I H, Ko D S, Wang Y H, Centurioni L, Wang D P. 2013. The mesoscale eddies and Kuroshio transport in the western North Pacific east of Taiwan from 8-year (2003-2010) model reanalysis. Ocean Dynamics, 63(9-10): 1027-1040.
DOI:10.1007/s10236-013-0643-z |
Liu W, Liu Q Y, Jia Y L. 2004. The Kuroshio transport east of Taiwan and the Sea Surface Height Anomaly from the interior ocean. Journal of Ocean University of China, 3(2): 135-140.
DOI:10.1007/s11802-004-0023-x |
Pedlosky J. 1987. Geophysical Fluid Dynamics. Springer-Verlag, New York. 710p. https://doi.org/10.1007/978-1-4612-4650-3.
|
Qiu B, Chen S M, Klein P, Sasaki H, Sasai Y. 2014. Seasonal mesoscale and submesoscale eddy variability along the North Pacific Subtropical Countercurrent. Journal of Physical Oceanography, 44(12): 3079-3098.
DOI:10.1175/JPO-D-14-0071.1 |
Qiu B. 1999. Seasonal eddy field modulation of the North Pacific Subtropical Countercurrent: TOPEX/Poseidon observations and theory. Journal of Physical Oceanography, 29(10): 2471-2486.
DOI:10.1175/1520-0485(1999)029<2471:SEFMOT>2.0.CO;2 |
Shchepetkin A F, McWilliams J C. 2005. The regional oceanic modeling system (ROMS): a split-explicit, free-surface, topography-following-coordinate oceanic model. Ocean Modelling, 9(4): 347-404.
DOI:10.1016/j.ocemod.2004.08.002 |
Sheu W J, Wu C R, Oey L Y. 2010. Blocking and westward passage of eddies in the Luzon Strait. Deep Sea Research Part Ⅱ: Topical Studies in Oceanography, 57(19-20): 1783-1791.
DOI:10.1016/j.dsr2.2010.04.004 |
Shi Y L, Yang D Z, Feng X R, Qi J F, Yang H W, Yin B S. 2018. One possible mechanism for eddy distribution in zonal current with meridional shear. Scientific Reports, 8(1): 10106.
DOI:10.1038/s41598-018-28465-z |
Song Y H, Haidvogel D. 1994. A semi-implicit ocean circulation model using a generalized topographyfollowing coordinate system. Journal of Computational Physics, 115(1): 228-244.
DOI:10.1006/jcph.1994.1189 |
Tang T Y, Tai J H, Yang Y J. 2000. The flow pattern north of Taiwan and the migration of the Kuroshio. Continental Shelf Research, 20(4-5): 349-371.
DOI:10.1016/S0278-4343(99)00076-X |
Vandermeirsch F O, Carton X J, Morel Y G. 2003. Interaction between an eddy and a zonal jet: Part Ⅱ. Two-and-a-halflayer model. Dynamics of Atmospheres and Oceans, 36(4): 271-296.
DOI:10.1016/S0377-0265(02)00066-0 |
Wang H Z, Liu Q H, Yan H Q, Song B, Zhang W M. 2019. The interactions between surface Kuroshio transport and the eddy field east of Taiwan using satellite altimeter data. Acta Oceanologica Sinica, 38(4): 116-125.
DOI:10.1007/s13131-019-1417-3 |
Waseda T, Mitsudera H, Taguchi B, Yoshikawa Y. 2002. On the eddy-Kuroshio interaction: evolution of the mesoscale eddy. Journal of Geophysical Research: Oceans, 107(C8): 3088.
DOI:10.1029/2000JC000756 |
Wu C R, Chiang T L. 2007. Mesoscale eddies in the northern South China Sea. Deep Sea Research Part Ⅱ: Topical Studies in Oceanography, 54(14-15): 1575-1588.
DOI:10.1016/j.dsr2.2007.05.008 |
Wu C R, Wang Y L, Lin Y F, Chao S Y. 2017. Intrusion of the Kuroshio into the South and East China Seas. Scientific Reports, 7(1): 7895.
DOI:10.1038/s41598-017-08206-4 |
Yan X M, Zhu X H, Pang C G, Zhang L L. 2016. Effects of mesoscale eddies on the volume transport and branch pattern of the Kuroshio east of Taiwan. Journal of Geophysical Research: Oceans, 121(10): 7683-7700.
DOI:10.1002/2016JC012038 |
Yang D Z, Yin B S, Chai F, Feng X R, Xue H J, Gao G D, Yu F. 2018. The onshore intrusion of Kuroshio subsurface water from February to July and a mechanism for the intrusion variation. Progress in Oceanography, 167: 97-115.
DOI:10.1016/j.pocean.2018.08.004 |
Yang D Z, Yin B S, Liu Z L, Bai T, Qi J F, Chen H Y. 2012. Numerical study on the pattern and origins of Kuroshio branches in the bottom water of southern East China Sea in summer. Journal of Geophysical Research: Oceans, 117(C2): C02014.
DOI:10.1029/2011JC007528 |
Yang D Z, Yin B S, Liu Z L, Feng X R. 2011. Numerical study of the ocean circulation on the East China Sea shelf and a Kuroshio bottom branch northeast of Taiwan in summer. Journal of Geophysical Research: Oceans, 116(C5): C05015.
DOI:10.1029/2010JC006777 |
Yang G, Wang F, Li Y L, Lin P F. 2013. Mesoscale eddies in the northwestern subtropical Pacific Ocean: statistical characteristics and three-dimensional structures. Journal of Geophysical Research: Oceans, 118(4): 1906-1925.
DOI:10.1002/jgrc.20164 |
Yang Y J, Jan S, Chang M H, Wang J, Mensah V, Kuo T H, Tsai C J, Lee C Y, Andres M, Centurioni L R, Tseng Y H, Liang W D, Lai J W. 2015. Mean structure and fluctuations of the Kuroshio East of Taiwan from in situ and remote observations. Oceanography, 28(4): 74-83.
DOI:10.5670/oceanog.2015.83 |
Yang Y, Liu C T, Hu J H, Koga M. 1999. Taiwan Current(Kuroshio) and impinging eddies. Journal of Oceanography, 55(5): 609-617.
DOI:10.1023/A:1007892819134 |
Yin Y Q, Lin X P, He R Y, Hou Y J. 2017. Impact of mesoscale eddies on Kuroshio intrusion variability northeast of Taiwan. Journal of Geophysical Research: Oceans, 122(4): 3021-3040.
DOI:10.1002/2016JC012263 |
Zhang D X, Lee T N, Johns W E, Liu C T, Zantopp R. 2001. The Kuroshio east of Taiwan: modes of variability and relationship to interior ocean mesoscale eddies. Journal of Physical Oceanography, 31(4): 1054-1074.
DOI:10.1175/1520-0485(2001)031<1054:TKEOTM>2.0.CO;2 |
Zheng Q A, Tai C K, Hu J Y, Lin H Y, Zhang R H, Su F C, Yang X F. 2011. Satellite altimeter observations of nonlinear Rossby eddy-Kuroshio interaction at the Luzon Strait. Journal of Oceanography, 67(4): 365-376.
DOI:10.1007/s10872-011-0035-2 |