 2021, Vol. 39
Institute of Oceanology, Chinese Academy of Sciences
Article Information
- LI Xue, ZHANG Xiaolong, FU Dongyang, LIAO Shan
- Strengthening effect of super typhoon Rammasun (2014) on upwelling and cold eddies in the South China Sea
- Journal of Oceanology and Limnology, 39(2): 403-419
- http://dx.doi.org/10.1007/s00343-020-9239-x
Article History
- Received Sep. 26, 2019
- accepted in principle Feb. 23, 2020
- accepted for publication May. 3, 2021


2 State Key Laboratory of Marine Environmental Science, College of Ocean and Earth Sciences, Xiamen University, Xiamen 361102, China;
3 Marine Resources Big Data Center of South China Sea, Southern Marine Science and Engineering Guangdong Laboratory, Zhanjiang 524088, China;
4 Meteorological Bureau, Yan'an 716000, China;
5 School of Cybersecurity, Sichuan University, Chengdu 610065, China
Typhoons are powerful and severe weather phenomena that affect marine dynamics and the ecological environment. They can trigger violent disturbances in the upper layers of the ocean and upwelling in the interior ocean (Zhang et al., 2016). They can bring nutrients to the surface layer that increase phytoplankton biomass and primary production in the ocean (Price, 1981; Marra et al., 1990). Also, they can lead to a decrease in sea surface temperature (SST) and cause heavy precipitation (Stramma et al., 1986; Sanford et al., 1987; Lonfat et al., 2004; Wada, 2005; Chen et al., 2006; D'Asaro et al., 2007; Fu et al., 2020).
Located in the western Pacific Ocean, the South China Sea (SCS) is one of the largest marginal seas in the world. It has an area of about 3.5×10⁷ km2 and a maximum depth of around 5 377 m (Chu et al., 1998; Zhang et al., 2015). It has a complicated bottom topography and dynamic properties (Editorial Committee of China Natural Geography, 1979). It is controlled by the East Asian monsoon system (Wyrtki, 1961; Lau et al., 2000). Therefore, seasonal upwelling and cold eddies are common (Chai et al., 2001a, b, c; Xie et al., 2003). The SCS is also the birthplace of tropical cyclones or typhoons, with an average of 10.3 tropical cyclones or typhoons annually (Fumin et al., 2002; Wang et al., 2007).
It is worthwhile to study how a typhoon affects the cold eddies of the SCS and the response of the SCS to the typhoon. Zheng et al. (2010) found that the preexisting mesoscale cyclonic eddies in most of the strong typhoons in the western North Pacific caused a continuous decrease in SST. The increased reduction in SST due to the pre-existing cyclonic ocean eddies can weaken the intensity of a typhoon through a negative feedback mechanism (Chang and Anthes, 1978; Schade and Emanuel, 1999). Miltenberger (2012) examined the effect of a cold-core eddy on the cold wave formed during the passage of Typhoon Fanapi (2010). Frouin et al. (2014) reported that the influence of Typhoon Prapiroon (2012) on the changes in temperature and salinity below the thermocline was mainly due to the upwelling caused by both the cyclonic eddies and the typhoon. Lu et al. (2016) used altimeter data and numerical experiments to show that typhoons could affect a cyclonic ocean eddy by increasing sea surface height anomaly, temperature, field strength, and area. Liu et al. (2017) examined the responses of the upper layers of the ocean within the cyclonic eddies and anticyclonic eddies to a typhoon forcing in the western North Pacific Ocean based on the sea-level anomaly data and Argo data. On the subsurface (10–200-m depth), cyclonic eddies have strong and shallow cooling, while anticyclonic eddies have weak and deep cooling. Few studies have reported on the response of cold eddies in the SCS to typhoons.
In this study, we investigated the effects of super typhoon Rammasun on upwelling and cold eddies in the SCS to understand the relationship between the oceanic environment and typhoons. The study confirmed that Rammasun enhanced the cold eddies and upwelling in the SCS. The distribution and diurnal variation in temperature and salinity at different depths, as well as the distribution of suspended sediment concentration and rainfall in the SCS were analyzed. This revealed an interesting phenomenon of cooling that lasted nearly 10 days (Yang et al., 2012; Fu et al., 2020), which could be attributable to strong oceanic mixing and strengthened upwelling triggered (Zhang et al., 2016; Yue et al., 2018) by typhoons in the east of Hainan (Bin-A in Fig. 1b) and Phan Ri Bay (Bin-B in Fig. 1b).

|
| Fig.1 Study area and track of super typhoon Rammasun in the SCS in 2014 Main study areas: Bin-A (18°N–20°N, 112°E–116°E); Bin-B (10°N–14°N, 108°E–113°E). a. location of the South China Sea (SCS); b. map of the South China Sea (SCS). TS: tropical storm; STS: strong tropical storm; TY: typhoon; STY: strong typhoon; Sup TY: super typhoon. |
The goal of this study is to used remote sensing data and model products to analyze the strengthening effect of super typhoon Rammasun on upwelling and cold eddies. Section 1 describes the work of the previous scholars and the current research status, as well as the content to be studied in this article. Section 2 introduces the study area, data, and methods in this study. Section 3 analyzes the spatiotemporal variations of the SST, upwelling, mixed layer depth (MLD), rainfall, sea surface salinity (SSS), suspended sediment concentration (SSC), surface-level anomaly (SLA), and cold eddies after the typhoon passage. Discussion are presented in Section 4. Finally, conclusions are summarized in Section 5.
2 MATERIAL AND METHOD 2.1 Study areaThe study area (8°N–23°N, 105°E–123°E) called the SCS lies between the equator and the Tropic of Cancer and is located in the region of the western Pacific Ocean (Fig. 1a). According to Chai et al.(2001a, b, c), the "Eastern Hainan Island upwelling" and two eddies ("Hainan eastern anticyclonic eddy" and "Southeast of Hong Kong anticyclonic eddy") exist in Bin-A (as indicated by the boxes in Fig. 1b) of the study area throughout the year, and they are especially significant in summer. Furthermore, the southeast monsoon causes the "eastern Vietnam upwelling, " which has an obvious effect on Bin-B (as indicated by the boxes in Fig. 1b) in summer (Wyrtki, 1961; Xu et al., 1982; Pohlmann, 1987; Shaw and Chao, 1994; Chu et al., 1998; Ho et al., 2000; Kuo et al., 2000; Chai et al., 2001a; Xie et al., 2003; Zhao and Tang, 2007). This study focused on these two regions to analyze the effects of super typhoon Rammasun on cold eddies and areas of upwelling in the SCS.
Rammasun developed from a tropical storm in the Northwest Pacific (13.4°N, 142.8°E) at 1400 UTC (Coordinated Universal Time) on July 12, 2014. It strengthened and became a strong typhoon on crossing Luzon (14°N, 121.9°E) at 1800 UTC on July 15. Subsequently, it crossed the SCS, passing over the Leizhou Peninsula and moving into the Guangxi Province of China. Its peak wind speed (72 m/s) and minimum sea-level pressure (888 hPa) occurred at 0600 UTC on July 18. Rammasun maintained the strength of a super typhoon for 17 h and then dissipated at 0500 UTC on July 20 (Fig. 1; Table 1).

|
The typhoon data were obtained from the Unisys Weather website, and the best-track typhoon data were obtained from the Joint Typhoon Warning Center (https://www.metoc.navy.mil/jtwc/jtwc.html). The maximum sustained surface wind speed and sixhourly latitude/longitude position of the typhoon's center were recorded in the dataset (Table 1).
The SST and surface wind data were downloaded from the National Oceanic and Atmospheric Administration (http://gis.ncdc.noaa.gov/ and http://www.ncdc.noaa.gov): spatial resolution, 0.25°×0.25°; temporal resolution, 1 day. The SSS, sea temperature, salinity, and MLD data were derived from the Hybrid Coordinate Ocean Model of the Navy Coupled Ocean Data Assimilation (http://hycom.org): spatial resolution, 0.08°×0.08°; temporal resolution, 1 day. The SSC data were obtained by the medium-resolution imaging spectrometer satellite provided by the Guangdong Ocean Remote Sensing and Information Engineering Technology Research Center of Guangdong Ocean University: spatial resolution, 0.01°×0.01°; temporal resolution, 1 day. Rainfall data were retrieved by the Tropical Rainfall Measuring Mission (http://disc.sci.gsfc.nasa.gov): spatial resolution, 0.25°×0.25°; temporal resolution, 1 day. Daily SLA data with a one-third degree spatial resolution were obtained from Archiving, Validation, andInterpretation of Satellite Data in Oceanography (AVISO).
2.3 Method 2.3.1 NormalizationTo unify the data in terms of magnitude, they were normalized using the following equation:
 (1)
(1)where x and y represent the values before and after the conversion, respectively, and the Minvalue and Maxvalue are the minimum and maximum values of the samples, respectively.
2.3.2 Ekman pumping velocityThe Ekman pumping velocity (EPV) was calculated using the following equation:
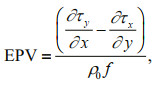 (2)
(2)and the pseudo-wind stress was derived from the following equation:
 (3)
(3)where water density (ρ0)=1 030 kg/m3, air density (ρa)=1.26 kg/m3, Coriolis parameter (f)=2ωsinφ, wind drag coefficient CD=1.29×10⁻³, τ is wind stress, u is the meridional wind velocity, and v is the zonal wind velocity (Stewart, 2008).
3 RESULT 3.1 Variation of the SST, upwelling, and MLD after the typhoon passage 3.1.1 Variation of SST and temperature below the sea surfaceBefore the typhoon, the SST was significantly higher in northern SCS than in the south, providing beneficial underlying surface and energy supplements for the typhoon to strengthen in northern SCS (Fu et al., 2020). Meanwhile, cold water masses were present below the sea surface in the east of Hainan (north of the Zhongsha Islands) and the Phan Ri Bay (layers Ⅰ, Ⅳ, and Ⅶ in Fig. 2). Eastern Vietnam has also been a well-known upwelling area, consistent with the previous findings (Chao et al., 1996; Metzger and Hurlburt, 1996; Yang and Liu, 1998). The cold water masses existed from the sea surface to 75 m or deeper. The SST of the SCS decreased significantly after the typhoon passage, especially to the east of Hainan (Bin-A, Fig. 2) and Phan Ri Bay (Bin-B, Fig. 2), and the reduction in temperature below the sea surface was slightly delayed. An obvious "right bias" cooling was observed following the track of the typhoon on the surface in Bin-A, showing similarity of cooling feature with other studies (Fu et al., 2020; Wada, 2005; Wu et al., 2019), and Bin-B formed a strong jet-shaped cold water tongue after the typhoon (layers Ⅱ and Ⅲ in Fig. 2). From July 16 to July 23, the temperature of the seawater decreased obviously, and the water temperature of the upper layer (in the upper 75 m of the sea) dropped. Meanwhile, a strong cold water mass was formed below the sea surface of Bin-A and Bin-B, and a counter-clockwise cold eddy was formed below the sea surface in the southeast of Vietnam (layers Ⅳ, Ⅴ, and Ⅵ in Fig. 2). Alternatively, the SST and temperature below the sea surface both continued to decline after the dissipation of the typhoon.

|
| Fig.2 Distribution of sea surface temperature (0 m) (a); distribution of temperature at 30 m below the sea surface (b); distribution of temperature at 75 m below the sea surface (c) Ⅰ, Ⅳ, and Ⅶ: before the typhoon passage (July 12-15); Ⅱ, Ⅴ, and Ⅷ: during the typhoon passage (July 16-19); Ⅲ, Ⅵ, and Ⅸ: after the typhoon passage (July 20-23). Red line shows the track of the typhoon. |
The average SST of the entire SCS (5°N–23°N, 105°E–123°E; Figs. 2&3) during July 1–15 was 29.55 ℃, but it dropped below 28.91 ℃ (average reduction of 0.64 ℃) during and after the typhoon passage (July 11–30). The average temperature of the entire SCS 30 m below the sea surface decreased by 0.3 ℃ (from 28.70 ℃ to 28.40 ℃); however, the temperature declined by only 0.1 ℃ at a depth of 75 m.

|
| Fig.3 Diurnal variation of the average sea surface temperature within Bin-A, Bin-B, and the SCS from July 1 to 31, 2014 |
The temperature was high in the SCS on July 12– 15 before the typhoon passage. The SST decreased significantly when the typhoon passed through the SCS (Fig. 2a), especially to the east of Hainan. Within Bin-A, the minimum average daily SST was 27.44 ℃ on July 19 (during the typhoon passage), and the maximum was 30.60 ℃ on July 5. On July 16, before the typhoon swept the SCS, the average SST of Bin-A was 29.86 ℃; however, it dropped to 27.66 ℃ on July 18. From July 18, under the influence of the typhoon, the SST of Bin-A was noticeably lower than that of Bin-B. The SST in Bin-A increased on July 20 and continued to increase slowly until July 31. This resulted in a cooling delay and slow regaining of the temperature due to the typhoon. The SST decreased by 0.5 ℃ after the typhoon passage and the cooling was less in Bin-B, located in the east of Phan Ri Bay than in Bin-A (Fig. 3).
The normalized average water temperature below the sea surface showed that the decrease was similar to the tendency of SST during and after the typhoon passage (Fig. 4). However, the normalized average wind speed had the opposite trend with the temperature. Within Bin-A and Bin-B, the minimum average daily water temperature was on July 20 and July 17, respectively. It suggested a certain delay in water temperature change in Bin-A and Bin-B caused by the typhoon; however, a much remarkable decrease in water temperature was observed in Bin-A than in Bin-B.

|
| Fig.4 Normalized diurnal average temperature below the sea surface in Bin-A and Bin-B and wind speed Temperature averaged over depths of 10, 20, 30, 50, 75, 100, 125, 150, 200, 250, and 300 m. |
Previous studies indicated that upwelling caused by typhoons was a vital factor for SST reduction (Fu et al., 2008, 2009a, b, 2016; Zhao et al., 2008; Chang et al., 2014; Liu et al., 2014; Chen et al., 2015). The results of this study suggested that the upwelling was much stronger than usual during the typhoon (Fig. 5). Before the typhoon, the EPV was very small, that is, < 0.5×10⁻⁵ m/s (Bin-A and Bin-B), on July 14. However, when super typhoon Rammasun entered the SCS with maximum wind speeds of >72 m/s, the EPV was >1.5×10⁻⁵ m/s (Bin-A and Bin-B) (Fig. 5). The strong EPV was responsible for bringing colder subsurface water into the upper layers, which cooled the surface waters and strengthened the influence of the cold eddies.

|
| Fig.5 Wind vectors and upwelling a. before the typhoon passage (July 14, 2014); b. during the typhoon passage (July 18, 2014). |
Meanwhile, as shown in Fig. 5, the lower cold water lifted overall regardless of Bin-A or Bin-B during the typhoon. At the same depth, the temperature of the water had different degrees of reduction, and the area covered by cold eddies increased significantly. The lower cold water mass not only expanded but also lifted overall under the effect of strong mixing and upwelling caused by the typhoon, promoting the continuous decrease in the SST and water temperature of the upper layer (Yue et al., 2018; Fu et al., 2020) (Table 2), the increase in the salinity, and the resuspension of the suspended sediment (Sun et al., 2012; Chen et al., 2016; Fu et al., 2016; Zhang et al., 2016; Zhao, 2016)
|
Compared with the MLD before typhoon (Fig. 6a), the MLD deepened during the typhoon passage during July 16–19 (Fig. 6b). As illustrated in Fig. 7, the average MLD in the SCS deepened to 30.7 m during the typhoon passage, compared with an average depth of 22.1 m before the typhoon passage. The typhoon had a significant influence on the northern part than the southern part of the SCS (Fu et al., 2020), using 12°N as the dividing line to separate the SCS into two parts. The increase of the average MLD in the northern part was about three times that of the southern part of the SCS after the typhoon. Specifically speaking, an increase of 75.3% in the northern part was in contrast to an increase of 21.0% in the southern SCS after the typhoon. In Bin-B, the MLD increased from 19.3 m on July 15 to 30.8 m on July 19. The greatest effect of the typhoon on the average MLD occurred in Bin-A. The MLD deepened from an average of 8.1 m during July 1–15 to 30.4 m on July 19 (Fig. 7), with a threefold increase.

|
| Fig.6 Distribution of the mixed layer depth (MLD) a. before the typhoon passage (July 12-15, 2014); b. during the typhoon passage (July 16-19, 2014). Red line shows the track of the typhoon. |

|
| Fig.7 Diurnal variation in the MLD within Bin-A, Bin-B, and the SCS from July 1 to July 31, 2014 |
The passage of a typhoon usually enhances vertical mixing in the upper layers of the ocean. This changes the thermocline and deepens the MLD, which strengthens the mixing between the cooler water of the deeper layers and the warmer upper layer, decreasing the overall water temperature (Zhao and Tang, 2007; Zheng and Tang, 2007; Fu et al., 2008, 2009a, b, 2016; Sun et al., 2010; Subrahmanyam, 2015; Fu et al., 2016). This study also found that the MLD deepened during the typhoon passage (Fig. 6b), with the most prominent change during July 16–19 (Fig. 7). This occurred in conjunction with the remarkable increase in the suspended sediment concentration during the typhoon passage (see Section 3.2.3). The SSS was also slightly higher during the typhoon passage (see Section 3.2.2). This might be affected by strong mixing and upwelling.
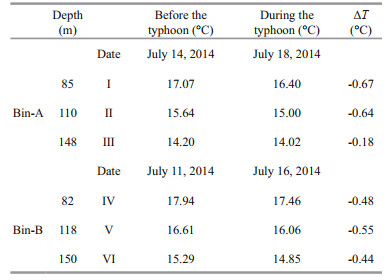
In some areas below the surface (e.g., eddies in Bin-A and upwelling in Bin-B), the water was cooler than the surrounding water due to the uplift of the deep isotherms shoaled (Figs. 8&9 and Section 3.1.1). The cooling in Bin-B lasted for approximately 10 days (see Section 3.2.2) after the passage of Rammasun. There were some similar cases in the SCS (e.g. Yang et al., 2012). The isotherms in the water temperature profiles lifted during the typhoon passage (Figs. 8&9). On July 14, the region of intensive isotherms in Bin-A was at 30–75 m with a temperature gradient of 0.23 ℃/m, which reduced to 0.19 ℃/m on July 18 (Fig. 8). A similar trend was also observed in Bin-B. Furthermore, the ranges of lower temperatures in Bin-A and Bin-B were much larger during the typhoon passage than before the typhoon passage (Figs. 8, 9, & Table 2). The isotherm value of layer Ⅰ in Bin-A reduced by 0.67 ℃ (from 17.07 ℃ to 16.40 ℃) and those of layers Ⅱ and Ⅲ dropped by 0.64 ℃ and 0.18 ℃, respectively. Similarly, the isotherm values in layers Ⅳ, Ⅴ, and Ⅵ in Bin-B had the same tendency, indicating much stronger vertical mixing during and after the passage of Rammasun.

|
| Fig.8 Water temperature profiles before and during the typhoon passage within Bin-A at 19°N and Bin-B at 13°N (0–200 m) a. 2014.7.14; Bin-A; b. 2014.7.18; Bin-A; c. 2014.7.11; Bin-B; d. 2014.7.16; Bin-B. |

|
| Fig.9 Water temperature profiles before and during the typhoon passage within Bin-A at 19°N and Bin-B at 13°N (0–50 m) a. 2014.7.14; Bin-A; b. 2014.7.18; Bin-A; c. 2014.7.11; Bin-B; d. 2014.7.16; Bin-B. |
The SST and MLD had high correlations in the SCS in our previous study for this typhoon (Fu et al., 2020), with determination coefficients of 0.42 and 0.55, respectively (Fig. 10). In this case, typhooninduced stronger vertical mixing in the upper layers of the ocean played an important role in SST decline (Zhang et al., 2016; Yue et al., 2018). It brought colder water, abundant nutrients, and suspended sediment concentration from the subsurface or deeper layers into the upper layers (Shi and Wang, 2012; Yang et al., 2012; Fu et al., 2014, 2016), which strengthened the existing cold eddies and subsequently promoted the cooling delay. This caused an increase in salinity and resuspension of the suspended sediment during the typhoon, especially in Bin-A and Bin-B (Chen et al., 2016; Fu et al., 2016; Zhang et al., 2016).

|
| Fig.10 Regression analysis of the sea surface temperature and the mixed layer depth (MLD) |
The rainfall before and during the typhoon passage is shown in Fig. 11. From July 11 to July 15, the rainfall in the study area was very low. However, the rainfall during the typhoon passage (July 16–20) was especially heavy along the track of the typhoon. It had a distinct "left bias" along the track of the typhoon (Chan et al., 2004; Zhang et al., 2019; Fu et al., 2020), rather than the "right bias" shown in response to SST change in Bin-A (Fu et al., 2020). The maximum rainfall was approximately 500 mm from the western Luzon Strait to the Qiongzhou Strait, passing through the northern part of the SCS. Furthermore, the typhoon also enhanced the rainfall over the southwest of mainland China and the Indochina Peninsula (Fig. 11). The rainfall in July 2014 was much higher than the annual average rainfall in July (2001–2013) (Fig. 12). The typhoon contributed much to rainfall, which augmented the surface runoff that carried large amounts of sediments to rivers (see Section 3.2.3). Thus, the surface runoff increased the flow of the Mekong River.

|
| Fig.11 Distribution of total rainfall in the study area a. before the typhoon passage (July 11-15, 2014); b. during the typhoon passage (July 16-20, 2014). Red line shows the track of the typhoon. |

|
| Fig.12 Distribution of monthly rainfall over the Indochina Peninsula a. average monthly rainfall in July (2001-2013); b. monthly rainfall in July 2014. |
From July 16, the typhoon has a significant impact on the SCS. During July 12–15, salinity was low in the SCS before the typhoon passage, but the SSS was slightly higher during the typhoon passage, especially in Bin-A (Fig. 13). Within Bin-A, the maximum average daily SSS was 33.84 on July 18 (during the typhoon passage), and the minimum was 33.60 on July 22. On July 16, before the typhoon swept the SCS, the average SSS of Bin-A was 33.71; however, it increased rapidly to 33.84 on July 18. The SSS of Bin-A started to increase dramatically and the SCS of Bin-B also increased, but less quickly. The SSS started reducing from July 19 and then maintained its level prior to the typhoon in Bin-A, but it continued to decrease steadily in Bin-B (Fig. 13). This might be caused by the Mekong River flush water, which was consistent with the previous finding (Rojana-Anawat et al., 2001). In this study, the average SSS increased during the typhoon passage in the SCS. However, the heavy rainfall triggered by the typhoon decreased the SSS during the typhoon passage. Subsequently, stronger vertical mixing and upwelling carried the saltier, colder water on the subsurface to the surface layer, increasing the surface salinity (Liu et al., 2014, 2017; Lin et al., 2015) (Fig. 13). In addition, this situation was obvious in Bin-A compared with Bin-B.

|
| Fig.13 Diurnal variation in average sea surface salinity within Bin-A, Bin-B, and the SCS areas from July 1 to July 31, 2014 Red circle in Bin-A: the increase of the SSS during the typhoon; red circle in Bin-B: the decrease of the SSS after the typhoon. |
Because of the lack of remote sensing data, only a partial distribution of the suspended sediment concentration in the SCS is depicted in Fig. 14. The differences in the distributions of the suspended sediment concentration before and after the typhoon are evident. The suspended sediment concentration, which was 0.48 mg/L before the typhoon passage, obviously increased in many regions of the SCS during and after the typhoon passage, reaching a value of 1.40 mg/L (an average increase of 192%). The suspended sediment concentration also increased in Bin-A from 1.41 to 2.30 mg/L (an increase of 63%). Concurrently, the suspended sediment concentration increased prominently in the northwest of the SCS (17°N–22°N, 105°E–114°E) and southeast of the Indochina Peninsula (Mekong River estuary and Phan Ri Bay) (8°N–13°N, 105°E–110°E), with an increase of 51.3% and 149.1%, respectively. Furthermore, the rainfall increased the suspended sediment concentration in the upper layers of the ocean, with the sedimentation of the particulate matter within the rain (Fu et al., 2016), resulting in an increase in the suspended sediment concentration in Bin-A after the typhoon passage (Fig. 14). In Bin-B (Fig. 13), the salinity started decreasing on July 21, which was caused by the increase due to the runoff from the Mekong River. This also explained the high content of the suspended sediment concentration in Bin-B after the typhoon passage (Fig. 14).

|
| Fig.14 Distribution of suspended sediment concentration (SSC) a, c, and e: before the typhoon passage (July 1-15, 2014); b, d, and f: during and after the typhoon passage (July 16-30, 2014). |
According to our previous report (Fu et al., 2020), there are regions of negative SLA (cold eddies) and positive SLA (warm eddies) in the SCS before the typhoon (Fig. 15a). Long‐lived eddies may be more correlated with the SCS circulation and the Kuroshio in the northern SCS, particularly in the summer (Nan et al., 2011; Zheng et al., 2011). On the southeast coast of Vietnam, a "jet-shaped region" of negative SLA was observed and related to the summer upwelling (Xie et al., 2003). The size and shape of those eddies are obvious changes after the typhoon in comparison with before the typhoon (Fig. 15b). Besides, the average SLA in the SCS increased by 0.2 cm after the typhoon (Fu et al., 2020).

|
| Fig.15 The mean fields for the surface level anomaly (SLA) a. July 1-15; b. July 20-23. Multicolor circular shows the track of the typhoon. Reprinted with permission (Fu et al., 2020). Copyright 2020, Taylor & Francis Ltd. |
The evolution of SLA is depicted in Bin-A and Bin-B (Figs. 16&17). In Bin-A, an obvious variability was found before, during, and after Rammasun on the right side. The amplification and intensification of the warm eddy near the right side are shown in Fig. 16e–h; cold eddies moved westsouthward, and two cold eddies fused into one during and after the typhoon passage. In Bin-B, a "jet-shaped region" of negative SLA similar to the SST was observed on the southeast coast of Vietnam. The extension of negative SLA is shown in Fig. 17e–i, and two warm eddies fused. Such eddies merger was also observed in previous studies with SLA maps (Li et al., 2016; Cui et al., 2019; Wang et al., 2019). Moreover, the cold eddies had a significant role in SST cooling.

|
| Fig.16 Evolution of SLA before, during, and after the passage of Rammasun in Bin-A The track is the same as in Fig. 1. |

|
| Fig.17 Evolution of SLA before, during, and after the passage of Rammasun in Bin-B |
Many previous studies found an area of strong upwelling in Phan Ri Bay, to the southeast of the Indochina Peninsula (Wyrtki, 1961; Xu et al., 1982; Shaw and Chao, 1994; Ho et al., 2000; Xie et al., 2003; Zhao and Tang, 2007). The shape of SST distribution in Bin-B was called the "cold filament" by Xie et al. (2003) and the "jet-shape region" by Zhao and Tang (2007), it was more apparent in Bin-B than in Bin-A before the typhoon passage (Figs. 2, 8,&9). In Bin-B, the strengthening of the upwelling was observed after the typhoon passage, with lowtemperature water flowing upward (Figs. 5, 8,&9). In Bin-A, the temperature at 30 m was obviously lower than the surrounding temperature, indicating that an eddy existed before the typhoon passage with "right bias" along the track of the typhoon (Fig. 2). Similarly, the features of upwelling were observed before the typhoon in Bin-A in Fig. 5a. The strong response was observed in Bin-A during and after the typhoon, and the SST showed a clear "right bias" along the track of the typhoon due to the presence of the cold eddies. Irrespective of the cooling area, the magnitude of the eddy, and the intensity of upwelling in the SCS after the typhoon passage, the SST was much higher than that before the typhoon passage (Figs. 2, 8,&9). Before and after the typhoon passage, the subsurface water with cold water was uplifted due to the heavy rainfall by typhoon augmented (Figs. 8&9). Also, the uplifting and denser isotherm illustrated that the typhoon strengthened the upwelling during and after the typhoon passage (Table 2) (Price, 1981; Dare and McBride, 2011; Potter, 2018).
The monsoon plays an important role in the SCS (Wyrtki, 1961; Lau et al., 2000). For example, numerous areas of seasonal upwelling and cold eddies in the SCS may be attributable to this particular wind system (Chai et al., 2001a, b, c; Xie et al., 2003), contributing to the hydrological characteristics and upper-layer circulation of the SCS (Wyrtki, 1961; Lau et al., 2000). According to Chai et al.(2001a, b, c), an area of upwelling and cold eddy exists to the southeast of Hainan during the summer monsoon. These characteristics were confirmed by this study (Figs. 2&10). Yang and Liu (1998) also reported a cold eddy with a center of 19.5°N, 115°E in the east of Hainan in summer, which was due to spring Luzon cold eddies moving westward and gradually decaying. The statistical analysis in a previous study suggested that cold-core eddies, particularly strong cold eddies, which exist in the pre-typhoon oceanic environment might have a greater impact on typhoon-induced SST cooling (Yang and Tang, 2010). In this study, the cooling was greater in Bin-A and Bin-B than in the surrounding environment. Also, the SST in Bin-A decreased again on July 20 and then increased slowly (Fig. 4). After super typhoon Rammasun, the upwelling, vertical mixing and cold eddies of the SCS have strengthened. Moreover, this typhoon-induced rainfall produces large amounts of the SSC in the Mekong River through surface runoff and then leading to a decrease in the SSS of this river.
5 CONCLUSIONThis study showed that both the surface and subsurface water temperature in the southeast of Hainan and the Indochina Peninsula dropped sharply during and after the passage of the super typhoon Rammasun in July 2014. Further, a cooling delay and slow regaining of temperature were observed after the typhoon passage. This study revealed that the cooling of the surface waters was mainly caused by strong vertical mixing and upwelling triggered by the typhoon. Moreover, the persistent cooling in the study areas occurred because the typhoon strengthened the pre-existed upwelling and eddies caused by the preexisted eddies. The principal findings were as follows:
This typhoon Rammasun caused a significant decrease in temperature on the surface and in the subsurface layers in the SCS, especially in the southeast of Hainan and the southeast of Vietnam. The strong EPV was responsible for bringing colder subsurface water into the upper layers, which cooled the surface waters and weakened the SST. The MLD deepening, which strengthens the mixing between the cooler water of the deeper layers and the warmer upper layer, decreased the overall water temperature. Therefore, the enhanced upwelling and vertical mixing caused by the typhoon were the main reasons for the continuous decrease in SST and the slow regaining of seawater temperature.
The typhoon Rammasun enhanced the rainfall over the southwest of mainland China and the Indochina Peninsula. The surface runoff carried large amounts of sediments to rivers, which increased the flow of the Mekong River. After the typhoon, the suspended sediment concentration increased prominently in the northwest of the SCS and southeast of the Indochina Peninsula, with an increase of 51.3% and 149.1%, respectively.
This study also focused on two strong cold eddies in summer: one in the southeast of Hainan (north of the Zhongsha Islands) and the other in the southeast of Vietnam. The cold eddies were not only strengthened but also lifted subsurface cold water overall during and after the passage of super typhoon Rammasun.
6 DATA AVAILABILITY STATEMENTAll data generated and/or analyzed during this study are available from the first author by request. Email: xszm1010@foxmail.com.
7 ACKNOWLEDGMENTWe thank two anonymous reviewers whose valuable comments and suggestions have helped to improve the manuscript. Daily SLA data with a onethird degree spatial resolution were downloaded from the AVISO. The SST and surface wind data were kindly provided by the National Oceanic and Atmospheric Administration. The SSS, sea temperature, salinity, and MLD data were obtained from the Hybrid Coordinate Ocean Model of the Navy Coupled Ocean Data Assimilation. Rainfall data were retrieved from the Tropical Rainfall Measuring Mission. The SSC data were obtained by the medium-resolution imaging spectrometer satellite provided by the Guangdong Ocean Remote Sensing and Information Engineering Technology Research Center of Guangdong Ocean University.
"Changes in the hydrodynamic characteristics of the upper layer of the South China Sea during the period of super typhoon Ram" by Dongyang FU, Xiaolong ZHANG, Xue LI, Dazhao LIU, Guo YU, and Huabing XU. © Dongyang FU, Xiaolong ZHANG, Xue LI, Dazhao LIU, Guo YU, and Huabing XU 2020, taken from Tellus A: Dynamic Meteorology and Oceanography, © International Meteorological Institute in Stockholm, reprinted by permission of Taylor & Francis Ltd, http://www.tandfonline.com on behalf of the society.
Chai F, Xue H J, Shi M C. 2001a. Hydrographic characteristics and seasonal variation of three anticyclonic eddies on the northern continental shelf of the South China Sea. Oceanographic Collection of China, 13: 105-116.
(in Chinese with English abstract) |
Chai F, Xue H J, Shi M C. 2001b. Formation and distribution of upwelling and downwelling in the South China Sea. Oceanographic Collection of China, 13: 117-128.
(in Chinese with English abstract) |
Chai F, Xue H J, Shi M C. 2001c. Upwelling east of Hainan island. Oceanographic Collection of China, 13: 129-137.
(in Chinese with English abstract) |
Chan J C L, Liu K S, Ching S E, Lai E S T. 2004. Asymmetric distribution of convection associated with tropical cyclones making landfall along the South China coast. Monthly Weather Review, 132(10): 2410-2420.
DOI:10.1175/1520-0493(2004)132<2410:ADOCAW>2.0.CO;2 |
Chang S W, Anthes R A. 1978. Numerical simulations of the ocean's nonlinear, baroclinic response to translating hurricanes. Journal of Physical Oceanography, 8(3): 468-480.
DOI:10.1175/1520-0485(1978)008<0468:NSOTON>2.0.CO;2 |
Chang Y, Chan J W, Huang Y C A, Lin W Q, Lee M A, Lee K T, Liao C H, Wang K Y, Kuo Y C. 2014. Typhoonenhanced upwelling and its influence on fishing activities in the southern East China Sea. International Journal of Remote Sensing, 35(17): 6561-6572.
DOI:10.1080/01431161.2014.958248 |
Chao S Y, Shaw P T, Wu S Y. 1996. Deep water ventilation in the South China Sea. Deep Sea Research Part Ⅰ: Oceanographic Research Papers, 43(4): 445-466.
DOI:10.1016/0967-0637(96)00025-8 |
Chen B, Wang K, Liu J, Gao F. 2016. The impact of super typhoon Saomai (0608) on the offshore environment near the Yangtze estuary. Earth Science, 41(8): 1402-1412.
(in Chinese with English abstract) |
Chen C C, Hsu S C, Jan S, Gong G C. 2015. Episodic events imposed on the seasonal nutrient dynamics of an upwelling system off northeastern Taiwan. Journal of Marine Systems, 141: 128-135.
DOI:10.1016/j.jmarsys.2014.07.021 |
Chen S S, Knaff J A, Marks Jr F D. 2006. Effects of vertical wind shear and storm motion on tropical cyclone rainfall asymmetries deduced from TRMM. Monthly Weather Review, 134(11): 3190-3208.
DOI:10.1175/MWR3245.1 |
Chu P C, Fan C W, Lozano C J, Kerling J L. 1998. An airborne expendable bathythermograph survey of the South China Sea, May 1995. Journal of Geophysical Research, 103(C10): 21637-21652.
DOI:10.1029/98JC02096 |
Cui W, Wang W, Zhang J, Yang J G. 2019. Multicore structures and the splitting and merging of eddies in global oceans from satellite altimeter data. Ocean Science, 15(2): 413-430.
DOI:10.5194/os-15-413-2019 |
D'Asaro E A, Sanford T B, Niiler P P, Terrill E J. 2007. Cold wake of hurricane Frances. Geophysical Research Letters, 34(15).
|
Dare R A, McBride J L. 2011. Sea surface temperature response to tropical cyclones. Monthly Weather Review, 139(12): 3798-3808.
DOI:10.1175/MWR-D-10-05019.1 |
Editorial Committee of China Natural Geography. 1979. Physical Geography of China-Ocean Geography. Science Press, Beijing, China. p.6-14.
(in Chinese)
|
Frouin R J, Pan D L, Murakami H. 2014. Ocean remote sensing and monitoring from space. In: Proceedings of SPIE 9261. SPIE, Beijing, China. p. 92610U.
|
Fu D Y, Ding Y Z, Liu D Z, Pan D L. 2009a. Delayed effect of typhoon on marine chlorophyll-a concentration. Journal of Tropical Oceanography, 128(2): 15-21.
(in Chinese with English abstract) |
Fu D Y, Luan H, Pan D L, Zhang Y, Wang L A, Liu D Z, Ding Y Z, Li X. 2016. Impact of two typhoons on the marine environment in the Yellow Sea and East China Sea. Chinese Journal of Oceanology and Limnology, 34(4): 871-884.
DOI:10.1007/s00343-016-5049-6 |
Fu D Y, Pan D L, Ding Y Z, Huang H Q. 2008. Statistic study of effect of the sea surface temperature caused by typhoon based on remote sensing. In: Proceedings of SPIE 7153, Lidar Remote Sensing for Environmental Monitoring Ⅸ. SPIE, Noumea, New Caledonia. p. 715312.
|
Fu D Y, Pan D L, Mao Z H, Ding Y Z, Chen J Y. 2009b. The effects of chlorophyll-a and SST in the South China Sea area by typhoon near last decade. In: Proceedings of SPIE 7478, Remote Sensing for Environmental Monitoring, GIS Applications, and Geology Ⅸ. SPIE, Berlin, Germany. p. 74782E.
|
Fu D Y, Pan D L, Wang D F, Zhang Y, Ding Y Z, Liu D Z. 2014. The analysis of phytoplankton blooms off the Yangtze River Estuary in the spring of 2007. Aquatic Ecosystem Health & Management, 17(3): 221-232.
|
Fu D Y, Zhang X L, Li X, Liu D Z, Yu G, Xu H B. 2020. Changes in the hydrodynamic characteristics of the upper layer of the South China Sea during the period of super typhoon Rammasun (2014). Tellus A: Dynamic Meteorology and Oceanography, 72(1): 1-14.
|
Fumin R, Gleason B, Easterling D. 2002. Typhoon impacts on China's precipitation during 1957-1996. Advances in Atmospheric Sciences, 19(5): 943-952.
DOI:10.1007/s00376-002-0057-1 |
Ho C R, Zheng Q N, Soong Y S, Kuo N J, Hu J H. 2000. Seasonal variability of sea surface height in the South China Sea observed with TOPEX/Poseidon altimeter data. Journal of Geophysical Research, 105(C6): 13981-13990.
DOI:10.1029/2000JC900001 |
Kuo N J, Zheng Q N, Ho C R. 2000. Satellite observation of upwelling along the western coast of the South China Sea. Remote Sensing of Environment, 74(3): 463-470.
DOI:10.1016/S0034-4257(00)00138-3 |
Lau K M, Ding Y H, Wang J T, Johnson R, Keenan T, Cifelli R, Gerlach J, Thiele O, Rickenbach T, Tsay S C, Lin P H. 2000. A report of the field operations and early results of the South China Sea Monsoon Experiment (SCSMEX). Bulletin of the American Meteorological Society, 81(6): 1261-1270.
DOI:10.1175/1520-0477(2000)081<1261:AROTFO>2.3.CO;2 |
Li Q Y, Sun L, Lin S F. 2016. GEM: a dynamic tracking model for mesoscale eddies in the ocean. Ocean Science, 12(6): 1249-1267.
DOI:10.5194/os-12-1249-2016 |
Lin J R, Tang D L, Lou Q S. 2015. The impact of Super Typhoon Nanmadol on the chlorophyll a, temperature, salinity and dissolved oxygen in the northern South China Sea. Ecological Science, 34(4): 9-14.
(in Chinese with English abstract) |
Liu S S, Sun L, Wu Q Y, Yang Y J. 2017. The responses of cyclonic and anticyclonic eddies to typhoon forcing: the vertical temperature-salinity structure changes associated with the horizontal convergence/divergence. Journal of Geophysical Research, 122(6): 4974-4989.
|
Liu Z H, Xu J P, Sun C H, Wu X F. 2014. An upper ocean response to Typhoon Bolaven analyzed with Argo profiling floats. Acta Oceanologica Sinica, 33(11): 90-101.
DOI:10.1007/s13131-014-0558-7 |
Lonfat M, Marks F D, Chen S S. 2004. Precipitation distribution in tropical cyclones using the tropical rainfall measuring mission (TRMM) microwave imager: a global perspective. Monthly Weather Review, 132(7): 1645-1660.
DOI:10.1175/1520-0493(2004)132<1645:PDITCU>2.0.CO;2 |
Lu Z M, Wang G H, Shang X D. 2016. Response of a preexisting cyclonic ocean eddy to a typhoon. Journal of Physical Oceanography, 46(8): 2403-2410.
DOI:10.1175/JPO-D-16-0040.1 |
Marra J, Bidigare R R, Dickey T D. 1990. Nutrients and mixing, chlorophyll and phytoplankton growth. Deep Sea Research Part A. Oceanographic Research Papers, 37(1): 127-143.
DOI:10.1016/0198-0149(90)90032-Q |
Metzger E J, Hurlburt H E. 1996. Coupled dynamics of the South China Sea, the Sulu Sea, and the Pacific Ocean. Journal of Geophysical Research, 101(C5): 12331-12352.
DOI:10.1029/95JC03861 |
Miltenberger A R. 2012. The effects of ocean eddies on tropical cyclones. Massachusetts Institute of Technology, Massachusetts, USA.
|
Nan F, He Z G, Zhou H, Wang D X. 2011. Three long-lived anticyclonic eddies in the northern South China Sea. Journal of Geophysical Research, 116(C5): C05002.
|
Pohlmann T. 1987. A three dimensional circulation model of the South China Sea. Elsevier Oceanography Series, 45: 245-268.
|
Potter H. 2018. The cold wake of typhoon Chaba (2010). Deep Sea Research Part Ⅰ: Oceanographic Research Papers, 140: 136-141.
DOI:10.1016/j.dsr.2018.09.001 |
Price J F. 1981. Upper ocean response to a hurricane. Journal of Physical Oceanography, 11(2): 153-175.
DOI:10.1175/1520-0485(1981)011<0153:UORTAH>2.0.CO;2 |
Rojana-Anawat P, Pradit S, Sukramongkol N, Siriraksophon S. 2001. Temperature, salinity, dissolved oxygen and water masses of Vietnamese waters. In: Proceedings of SEAFDEC Seminar on Fishery Resources in the South China Sea. p. 346-355.
|
Sanford T B, Black P G, Haustein J R, Feeney J W, Forristall G Z, Price J F. 1987. Ocean response to a hurricane. Part Ⅰ: observations. Journal of Physical Oceanography, 17(11): 2065-2083.
DOI:10.1175/1520-0485(1987)017<2065:ORTAHP>2.0.CO;2 |
Schade L R, Emanuel K A. 1999. The ocean's effect on the intensity of tropical cyclones: results from a simple coupled atmosphere-ocean model. Journal of the Atmospheric Sciences, 56(4): 642-651.
DOI:10.1175/1520-0469(1999)056<0642:TOSEOT>2.0.CO;2 |
Shaw P T, Chao S Y. 1994. Surface circulation in the South China Sea. Deep Sea Research Part Ⅰ: Oceanographic Research Papers, 41(11-12): 1663-1683.
DOI:10.1016/0967-0637(94)90067-1 |
Shi W, Wang M H. 2012. Satellite views of the Bohai Sea, Yellow Sea, and East China Sea. Progress in Oceanography, 104: 30-45.
DOI:10.1016/j.pocean.2012.05.001 |
Stewart R H. 2008. Introduction to Physical Oceanography. Texas A & M University, California.
|
Stramma L, Cornillon P, Price J F. 1986. Satellite observations of sea surface cooling by hurricanes. Journal of Geophysical Research, 91(C4): 5031-5035.
DOI:10.1029/JC091iC04p05031 |
Subrahmanyam M V. 2015. Impact of typhoon on the northwest Pacific sea surface temperature: a case study of Typhoon Kaemi (2006). Natural Hazards, 78(1): 569-582.
DOI:10.1007/s11069-015-1733-7 |
Sun L, Yang Y J, Xian T, Lu Z M, Fu Y F. 2010. Strong enhancement of chlorophyll a concentration by a weak typhoon. Marine Ecology Progress Series, 404: 39-50.
DOI:10.3354/meps08477 |
Sun L, Yang Y J, Xian T, Wang Y, Fu Y F. 2012. Ocean responses to Typhoon Namtheun explored with Argo floats and multiplatform satellites. Atmosphere-Ocean, 50(1): 15-26.
|
Wada A. 2005. Numerical simulations of sea surface cooling by a mixed layer model during the passage of typhoon Rex. Journal of Oceanography, 61(1): 41-57.
DOI:10.1007/s10872-005-0018-2 |
Wang G H, Su J L, Ding Y H, Chen D K. 2007. Tropical cyclone genesis over the South China Sea. Journal of Marine Systems, 68(3-4): 318-326.
DOI:10.1016/j.jmarsys.2006.12.002 |
Wang Z F, Sun L, Li Q Y, Cheng H. 2019. Two typical merging events of oceanic mesoscale anticyclonic eddies. Ocean Science, 15(6): 1545-1559.
DOI:10.5194/os-15-1545-2019 |
Wu Z Y, Jiang C B, Chen J, Long Y N, Deng B, Liu X J. 2019. Three-Dimensional temperature field change in the South China Sea during typhoon Kai-tak (1213) based on a fully coupled atmosphere-wave-ocean model. Water, 11(1): 140.
DOI:10.3390/w11010140 |
Wyrtki K. 1961. Physical Oceanography of the Southeast Asian Waters. The University of California, California, USA.
|
Xie S P, Xie Q, Wang D X, LIU W T. 2003. Summer upwelling in the South China Sea and its role in regional climate variations. Journal of Geophysical Research, 108(C8): 3261.
DOI:10.1029/2003JC001867 |
Xu X Z, Qiu Z, Chen H C. 1982. The general descriptions of the horizontal circulation in the South China Sea. In: Editorial Department of Oceans and Lakes ed. Proceedings of the 1980 Symposium on Hydrology and Meteorology of the Chinese Society for Oceanology and Limnology. Science Press, Beijing, China. p. 119-127. (in Chinese with English abstract)
|
Yang H J, Liu Q Y. 1998. The seasonal features of temperature distributions in the upper layer of the South China sea. Oceanologia et Limnologia Sinica, 29(5): 501-507.
(in Chinese with English abstract) |
Yang X X, Tang D L. 2010. Location of sea surface temperature cooling induced by typhoon in the South China Sea. Journal of Tropical Oceanography, 29(4): 26-31.
(in Chinese with English abstract) |
Yang Y J, Sun L, Duan A M, Li Y B, Fu Y F, Yan Y F, Wang Z Q, Xian T. 2012. Impacts of the binary typhoons on upper ocean environments in November 2007. Journal of Applied Remote Sensing, 6(1): 063583.
|
Yue X X, Zhang B, Liu G Q, Li X F, Zhang H, He Y J. 2018. Upper ocean response to typhoon Kalmaegi and Sarika in the South China Sea from multiple-satellite observations and numerical simulations. Remote Sensing, 10(2): 348.
|
Zhang H, Chen D K, Zhou L, Liu X H, Ding T, Zhou B F. 2016. Upper ocean response to Typhoon Kalmaegi (2014). Journal of Geophysical Research, 121(8): 6520-6535.
|
Zhang H, Liu X H, Wu R H, Liu F, Yu L H, Shang X D, Qi Y F, Wang Y, Song X S, Xie X H, Yang C H, Tian D, Zhang W Y. 2019. Ocean response to successive typhoons Sarika and Haima (2016) based on data acquired via multiple satellites and moored array. Remote Sensing, 11(20): 2360.
DOI:10.3390/rs11202360 |
Zhang X H, Wang Z L, Hou F H, Yang J Y, Guo X W. 2015. Terrain evolution of china seas and land since the indo-china movement and characteristics of the stepped landform. Chinese Journal of Geophysics, 58(1): 54-68.
DOI:10.1002/cjg2.20155 |
Zhao H, Tang D L, Wang Y Q. 2008. Comparison of phytoplankton blooms triggered by two typhoons with different intensities and translation speeds in the South China Sea. Marine Ecology Progress Series, 365: 57-65.
DOI:10.3354/meps07488 |
Zhao H, Tang D L. 2007. Effect of 1998 El Niño on the distribution of phytoplankton in the South China Sea. Journal of Geophysical Research, 112(C2): C02017.
|
Zhao Z Y. 2016. Application of discontinuous Galerkin method for two-dimensional suspended sediment transport based on meshes of model. In: Proceedings of 2016 International Conference on Smart Grid and Electrical Automation. IEEE, Zhangjiajie, China. p. 71-74.
|
Zheng G M, Tang D L. 2007. Offshore and nearshore chlorophyll increases induced by typhoon winds and subsequent terrestrial rainwater runoff. Marine Ecology Progress Series, 333: 61-74.
DOI:10.3354/meps333061 |
Zheng Q N, Tai C K, Hu J Y, Lin H Y, Zhang R H, Su F C, Yang X F. 2011. Satellite altimeter observations of nonlinear Rossby eddy-Kuroshio interaction at the Luzon Strait. Journal of Oceanography, 67(4): 365-376.
DOI:10.1007/s10872-011-0035-2 |
Zheng Z W, Ho C R, Zheng Q N, Lo Y T, Kuo N J, Gopalakrishnan G. 2010. Effects of preexisting cyclonic eddies on upper ocean responses to Category 5 typhoons in the western North Pacific. Journal of Geophysical Research, 115(C9): C09013.
|