 2021, Vol. 39
Institute of Oceanology, Chinese Academy of Sciences
Article Information
- ZHAI Wanlin, ZHU Jianhua, FAN Xiaohui, YAN Longhao, CHEN Chuntao, TIAN Zhen
- Preliminary calibration results for Jason-3 and Sentinel-3 altimeters in the Wanshan Islands
- Journal of Oceanology and Limnology, 39(2): 458-471
- http://dx.doi.org/10.1007/s00343-020-9251-1
Article History
- Received Sep. 27, 2019
- accepted in principle Mar. 9, 2020
- accepted for publication Mar. 27, 2021


2 Tianjin Guohai Marine Engineering Survey Co. Ltd., Tianjin 300000, China
Since Topex/POSEIDON (T/P) was launched in 1992, altimeter satellites have been providing highly accurate observations of the global oceans (Fu et al., 1994). Our understanding of oceanic processes has greatly advanced since 1992 from examining sea level data collected by satellite altimetry for almost 30 years. Satellite altimeters need to be calibrated or validated to deal with the drift or bias associated with the measurements. Long-term time series of sea surface height (SSH) measurements from altimeters can be calibrated and validated against independent measurements at dedicated sites that have been set up specifically for this purpose (Haines et al., 2003; Mertikas et al., 2011, 2018; Cancet et al., 2013). The calibration and validation (Cal/Val) of altimeters needs to be done over the long-term and should be repeated at different places worldwide (Fu and Haines, 2013).
At present, there are four permanent Cal/Val facilities in the world at Gavdos in Greece (Mertikas et al., 2011, 2018), Corsica in France (Bonnefond et al., 2018), the Harvest Oil Platform in America (Haines et al., 2010), and in the Bass Strait in Australia (Watson et al., 2011). Some of these sites have been in operation for more than 20 years. Many scientists have carried out Cal/Val campaigns to evaluate the bias in altimetry (Liu et al., 2014; Xu et al., 2016, 2018; Crétaux et al., 2018; Chen et al., 2019) and before constructing in-situ Cal/Val sites (Zhai et al., 2020).
In-situ equipment, such as GPS buoys (Watson et al., 2011; Xu et al., 2016), tide gauges (Mitchum, 1998; Dong et al., 2002), and moored buoys (Watson et al., 2011), are generally used at most of the Cal/Val sites and during campaigns set up to measure the bias/ drift of the altimeters. Using a GPS buoy, the altimeter bias can be estimated using a direct absolute altimeter calibration from direct altimeter overflights. While this method does not require a geoid or tidal model (Bonnefond et al., 2013; Cancet et al., 2013), the GPS buoy should be moored right at the altimeter footprint for at least two hours and should not be operated in harsh sea conditions. When using the tide gauge, the equipment cannot be placed right at the footprint of the altimeters. A connection between the tide gauge location and the altimeter footprints should be developed from the slope of the geoid and the tidal differences (Dong et al., 2002; Zhai et al., 2020). Also, the absolute datum of the tide gauge and the altimeter should be the same, and this can be determined by the GPS reference stations or GPS buoys (Dong et al., 2002; Watson et al., 2008; Yang et al., 2017). This method is not affected by the sea condition. Because tide gauges are widely distributed worldwide, tide gauge calibrations are essential when developing long-term sea-level records from altimetry (Fu and Haines, 2013). Other factors, however, such as ocean dynamics, pole tides, and solid earth tides should also be considered (Crétaux et al., 2018).
The Wanshan Islands in Guangdong Province was chosen as the first field in China for calibrating and validating the HY-2 satellite launched by NSOAS (Jiang et al., 2016), just like the other in-situ CalVal sites mentioned above. In the initial plans, the major equipment was placed near orbits of HY-2, but the related facilities were located close to the orbit of Sentinel-3A and ground tracks of Jason-3. The Wanshan Islands comprise many small islands. These small islands may avoid the perturbations to land from radar echoes that cause a rapid decrease in the tracking precision. To test its suitability as a Cal/Val site for altimeters and to gain an improved understanding of the environmental conditions, two preliminary campaigns were conducted in this area. In this paper, the setup of the tide gauges, GPS reference stations, and a GPS buoy for the campaigns are explained. We also explain how the collected data are used to calibrate and validate the Jason-3 and Sentinel-3A. In the second section of the paper, the equipment and method are introduced. The data processing and determination of the in-situ absolute SSH are described in the third section. The results and the factors that can influence Cal/Val campaigns are reported in the fourth section; we also consider how the altimeter waveforms are affected or contaminated by the islands.
2 MATERIAL AND METHODThe Wanshan Islands in Guangdong Province, which comprise more than 100 islands, were selected as the in-situ site for calibrating and validating the HY-2 altimeter (Fig. 1). This area was considered far enough from the mainland to avoid contaminating the altimeter signals and the islands were deemed sufficiently small to have little effect on the altimeter response (Bonnefond et al., 2013). To understand the environment, determine how the altimeters would perform in this region, and do a preliminary Cal/Val, two preliminary campaigns were carried out in this area in 2018, from March 8 to April 16 and from November 3 to December 11. Three GPS reference stations and tide gauges were established on Zhiwan, Dangan, and Wailingding Islands during the campaigns (Fig. 1, Table 1). A GPS buoy was moored near the tide gauges to set a datum for the sea level measurements. In this paper, we report how the collected data were used to calibrate and validate the Jason-3 and Sentinel-3A altimeters.

|
| Fig.1 Map of the Wanshan area The blue triangles represent the GPS reference stations set up in the two campaigns. Three tide gauges were set up close to the GPS reference stations during the first campaign. During the second campaign, only one tide gauge was placed on Zhiwan Island. The Jason-3 (red line) and Sentinel-3A orbits travel through this area. The filled rose quartz and the filled lepidolite lilac show the measurement scales from the Jason-3 and Sentinel-3A altimeters, respectively. |
Three static GPS reference stations with a sampling rate of 1 Hz were installed on Zhiwan (ZHIW), Wailingding (WLDD), and Dangan (DGAN) Islands during each campaign. The TRM59900 and STHCR3- G3 antennas and Trimble Net R9 and South Net S9 receiver were used to acquire the GPS data (Fig. 2). The reference station on Dangan Island that was used for the campaign is displayed in Fig. 3. These reference stations have three main functions, 1) to provide fixed reference sites to kinematically process the GPS buoy, 2) to set a datum of the tide gauges, and 3) to facilitate comparison with the MWR and ECMWF model using the derived WZD.

|
| Fig.2 Data obtained from the GPS reference stations, GPS buoy, and tide gauges a. represents the first campaign; b: represents the second campaign. The x-axis represents the data from 2018. The purple lines were the overflight of Jason-3, and the cyan lines were the Sentinel-3A. Details of the GPS buoy data processing were described by Chen et al. (2014) and Zhai et al.(2016, 2020). |

|
| Fig.3 The GPS station on Dangan Island during the first campaign This station was equipped with TRM59900 antenna and a Trimble Net R9 receiver and was powered by two solar cells. |
The GPS data were processed using GAMIT/ GLOBK (Version 10.70) (Herring et al., 2018). Data provided by Scripps Orbit and Permanent Array Center (SOPAC) from a total of 31 GPS stations were included in the GPS data processing. Details of the GAMIT/GLOBK solutions have been reported by Zhai et al. (2020). Section 3.3 describes how the wet zenith delay (WZD) was extracted from the solutions and then compared with the MWR and ECMWF model that were used to correct the SSH of the altimeters. There was less than ±20 mm of variation between the height elements (Fig. 4), which shows that the GPS reference stations were basically fixed during the campaigns. The accuracy was high enough for the kinematic solution of the GPS buoys (Zhai et al., 2019). The positions of the GPS reference stations were used to set a datum for the GPS buoy solutions. The frequency was set at 1 Hz to match the sampling rate of the GPS buoy.

|
| Fig.4 The height elements calculated from the GAMIT/GLOBK software The x-axis represents the date of the solution. The y-axis represents the daily height difference minus the average value. |
The tide gauges were fixed firmly to the islands' wharfs during the campaigns (Figs. 2&5). The sea level data used in this study were collected using the RBR pressure tide gauges, with a sampling interval of 1 s. This kind of tide gauge only measures the sea level with a static atmosphere pressure, which was corrected by the actual measured and time-variable atmospheric pressure (Zhai et al., 2020). The actual sea level was then filtered by a moving average lowpass filter, to eliminate the influence of factors such as waves and other oceanic variabilities.

|
| Fig.5 Sketch of how the tide gauge datum was determined using the GPS buoy, GPS reference stations, and leveling |
The tide gauge measures the relative change of the sea level. It had no reference system and so was transformed to a world coordinate system connected to the reference frame. To compare the sea level of the tide gauge with the satellite altimeters and to set a datum for the tide gauge, the GPS buoy was moored near each tide gauge for several hours (Figs. 1–2). The sampling rate of the GPS buoy was set at 1 s, to correspond with the tide gauge measurements. The TRACK module was used to process the GPS buoy data, and was supported by accurate coordinates of the GPS reference stations and the 1-Hz frequency GPS data mentioned in the above section. The ocean conditions for the GPS buoy and the tide gauge should be similar as they were located relatively close together on the same wharf, and the SSH of the two systems should observe the same ocean tide signal (Yang et al., 2017). The absolute height of the tide gauge was then derived by comparing the GPS buoy solutions, as described in Section 3.1.
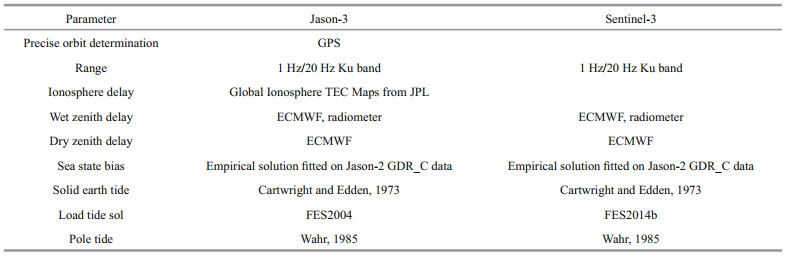
2.3 Altimetry dataJason-3: The Jason-3 mission was launched on January 17, 2016 as a cooperative effort involving CNES, NASA, EUMETSAT, and NOAA. It has a non-sun-synchronous orbit of 1 336 km, is inclined at an angle of 66° on a Proteus platform, and has a cycle of about 9.5 days (CNES, 2017). Its payload includes a Poseidon-3B altimeter and a DORIS radio positioning system from CNES, an advanced microwave radiometer (AMR), a laser reflector array, a precision GPS receiver from NASA, and two experimental passengers. The Jason-3 mission follows in the footsteps of the TOPEX/POSEIDON Jason-1 and Jason-2 missions and provides high quality measurements for ocean science and operational products for assimilation and forecasting applications. The SGDR-d products supported by AVISO were calibrated in this paper, and the parameters are shown in Table 1.
Sentinel-3: Launched by ESA on February 16, 2016, the Sentinel-3A has a near-polar, sunsynchronous orbit with a reference altitude of 814.5 km. Its orbital cycle is 27 days (14+7/27 orbits per day with 385 orbits per cycle) (EUMETSAT, 2017). The term refers to products that contain range, orbital altitude, time, water vapor from the MWR, environmental and geophysical corrections, along with information about the significant wave height and wind-speed. The SENTINEL-3 SRAL, improved along the track resolution (approximately 250 m) in SAR mode, facilitates the measurement of sea surface height close to the coast. The SRAL instrument is in SAR mode over coastal zones. The Level-2 SRAL/ MWR products have a parameter for the distance to the coast.
The data used in this study were from the Geophysical Data Records (GDRs) for Jason-3 (GDR-D) and Sentinel-3A (GDR-T patch 2) and were sourced from the Data Centre Long-Term Archive (https://archive.eumetsat.int). Data for the two altimeters are available every 1 Hz and 20 Hz, which corresponds to a measurement every 350 m along the track. The sea surface heights of the altimeters (SSHalt) are defined using Eq.1. The corrections are described in Table 1.
 (1)
(1)where ALT is the altitude, the height of the altimeter above the ellipsoid; TPD is the wet/dry zenith delay caused by dry and water vapor of atmosphere; IC is the ionosphere correction which causes refraction of the radio signal emitted by the altimeter; SSB is the sea state bias, obtained using empirical models derived from analyses of the altimeter data; SET is the solid earth tide or body tide; LT is the load tide height for the geocentric ocean tide (we used the FES2004 model source in this study), and PT is the pole tide, a tide-like motion of the ocean surface.
The bias of the SSH (Bias) was determined using the following equation:
 (2)
(2)where SSHtg is the sea surface height of the tide gauge at the time of the altimeter overflight; Geoidalt is the geoid of the footprint of the altimeters, Geoidtg is the geoid of the tide gauge locations, and TD is the tidal difference between the tide gauge location and the altimeter footprints.
3 DETERMINATION OF THE IN-SITU SSHThe bias of the altimeters was determined using the tide gauge measurements and the tide gauge measured a relative sea level and did not have any coordinate references. Therefore, a GPS buoy or GPS reference station was placed near the tide gauges to set a datum for the tide gauges. There were geoid and tidal differences between the tide gauges and the altimeter footprints. We choose the EGM 2008 geoid and NAO.99Jb tidal prediction system to complete the Cal/Val, as they have high precision for this area.
3.1 Datum of the tide gaugeThe datum of the tide gauge was defined using the GPS buoy and GPS reference stations mentioned in Section 2.3. The GPS buoy used in this study (Fig. 1) was initially designed for the Cal/Val of the HY-2A altimeters (Zhai et al., 2016). During the design, the measurement of the GPS antenna reference point (ARP) to water level offset and the phase center variation (Chen et al., 2014) were considered. The precision of the sea surface measurements was less than 1 cm when the distance from the reference stations was less than 1 km (Zhai et al., 2016).
The data from the tide gauge and the GPS buoy data are shown in Fig. 6. The data from the GPS buoy and the tide gauge were filtered using a low-pass filtering algorithm for 5 min, to eliminate the influence of surface waves, high frequency noise, and other sea conditions (Liu et al, 2014). The comparison of Wailingding Island showed there was a standard bias of 2.23 cm (Fig. 6a). This difference was mainly attributable to the variability in the ocean environment. The buoy was about 2 km from the tide gauge, and the 2 pieces of equipment were at 2 different sides of the island, so there may have been some difference in the ocean conditions. With a standard deviation of less than 1 cm, the SSH derived from the 2 pieces of equipment agreed well with each another for Zhiwan and Wailingding Islands (Fig. 6b & c), which indicates that the SSH measured by the GNSS buoy was highly accurate. As the ocean environment was similar for the GPS buoy and the tide gauge, the SSH from the 2 pieces of equipment generally observed the same ocean tide signal. However, there was a relatively large difference from about 8:00 to 8:20 on 18 Mar. (Fig. 6a) and 14:50 to 15:00 on 24 Mar. (Fig. 6b), which may have been caused by 1) a deficiency of the GPS signals (Liu et al., 2014), 2) the uncertainty of the GPS buoy antenna height, or 3) positioning bias in the solution derived from the TRACK software. These data will be deleted in the comparison (Watson et al., 2008).

|
| Fig.6 Comparison of the sea level between the GPS buoy and the tide gauge |
Two additional leveling measurements were conducted between the GPS reference stations and the tide gauge in the first campaign on Zhiwan and Wailingding Islands, to make an independent datum for the tide gauges. The datums for Zhiwan and Wailingding Islands were different from the datum determined by the GPS buoy by 0.76 cm and 0.2 cm, respectively. There was no GPS buoy mooring close to Dangan Island. The datum of the tide gauge was determined from a leveling measurement between the WLDD GPS reference station and the tide gauge. We estimated the accuracy of the datum of about 1.0 cm, as reported by Zhai et al. (2019).
The reference ellipsoid of the resolution was GRS80, with a semi-major axis of 6 378 137 and an inverse of flattening of 298.257 222 101. This was different from the corresponding reference from the Jason-3 and Sentinel-3A (semi-major axis of 6 378 137 and inverse of flattening of 298.257 222 101) and may have contributed to a height difference of about 0.7 m, which should be corrected in the Cal/Val.
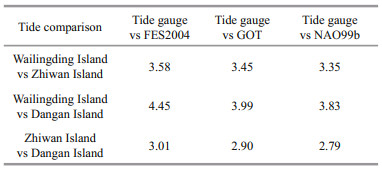
3.2 Tidal differencesThe distance between the altimeter footprint and the tide gauge locations was more than 10 km. For the Wanshan area, this means that the tidal differences need be taken into consideration for the altimeter Cal/ Val. The tidal signal from the tide gauge time series can be obtained naturally through a harmonic analysis (Cancet et al., 2013). In this study however, the time measured by tide gauge was not enough, and so the accuracy of the harmonic analysis was low and was not sufficient to satisfy the accuracy of the altimeter calibrations. Also, in the Cal/Val campaign, we concentrated the tidal differences between the altimeter footprint and the tide gauge locations rather than the absolute tides at each point. Therefore, we calculated the differences using the FES2004 and GOT4.8 tidal model, which were used in the altimeter data of Jason-3 and Sentinel-3A and are highly accurate worldwide. The NAO.99b tidal prediction system, which is highly accurate and is available at a high resolution for this area, was compared with FES2004 and GOT4.8 in this study. The NAO.99b tidal prediction system was assimilated from the Topex/POSEIDON data and data from 219 coastal tide gauges estimated using a regional model around Japan (110°E–165°E, 20°N–65°N) (Matsumoto et al., 2000).
The tidal differences between the in-situ data and the tide models are compared in Table 2. The standard bias of the tidal difference between the tide gauges and the tide model ranged from 2.79 to 4.45 cm in the Wanshan area. Of the three models, i.e., the NAO.99b prediction system and the FES2004 and GOT4.8, the NAO.99b was the most accurate for the Wanshan area. Even though the model was not perfect, it was suitable for connecting the tidal differences between the tide gauge and the altimeter footprints.
Since the tide gauges were placed on the islands and were not directly aligned with the overflight of the altimeters, there were geoid differences between the tide gauge locations and the altimeter measurement points. Even when the GPS buoy was used, we still could not moor the equipment right at the footprint of the altimeter. This means that the geoid needed to be corrected in the altimeter Cal/Val (Zhai et al., 2016). The geoid slope was several cm/km in this area.
The Cal/Val sites in both Crete and Corsica rely on detailed local geoids produced during terrestrial, airborne, marine, and sea surface surveys (Bonnefond et al., 2013; Mertikas et al., 2018). In this study, we measured the sea surface over an area of more than 100 km2 at a precision of about 4.14 cm close to Zhiwan Island (Zhai et al., 2020). The slope of the sea surface was about 1.62 cm/km along the HY-2 orbit. The geoid slope can be determined by subtracting the sea surface results from the mean dynamic topography (MDT). However, this geoid slope did not cover the area of the Jason-3 or Sentinel-3A footprints. We therefore chose the EGM 2008 global geoid model in this study. The EGM2008 geoid was interpolated from the 1×1-Minute Geoid Undulation Grid file for the measuring points (Pavlis et al., 2012). When this geoid was compared with the measured geoid slope, the standard bias was 1.14 cm, which shows they were consistent with each other. We believe that this comparison adequately represented the precision of the geoid slope.
4 CAL/VAL RESULT 4.1 Wet zenith delayThe wet zenith delay (WZD), which is caused by the wet vapor of the atmosphere, is a significant source of error when determining the SSH of altimetric products. The microwave radiometer (MWR) was loaded on the satellite to measure the WZD at either 2 or 3 frequencies, depending on the instrument (18.7 GHz, 23.8 GHz, and 36.5 GHz for Jason-3, and 23.8 GHz and 36.5 GHz for Sentinel-3A). The water vapor signal is sensed by the 23.8-GHz channel, which is one of the nadir paths of the Jason-3 and Sentinel-3 MWR (CNES, 2017). The MWR's observations are contaminated for distances up to 20 or 25 km from any land mass (Bonnefond et al., 2013). The accuracy of the MWR WZD measurements in coastal areas can be significantly improved by using the coastal retrieval algorithm developed by Brown (Brown, 2010). The GPS also provides accurate values of the WZD at a precision of about 4–6 mm (Ortiz et al., 2010). During the 2 campaigns, we extracted the WZD from the three GPS reference stations in the Wanshan islands every 2 hours using the VMF1 mapping function (Boehm and Schuh, 2004) and the Saastamoinen model in the GAMIT solutions (Herring et al., 2018).
The data from the three GPS reference stations showed that there was considerable variation in the WZD in this area (Table 3), which means that there were very large temporal and spatial variations in the wet atmospheric delay area. The GPS WZD for the period from Nov. 28 and Dec. 3 during the second campaign are shown in Fig. 7. The GPS WZD was extracted using an interpolated value at a query point and then was compared with the MWR for the following parameters. Because the islands in this area were only small, there was little variation in the atmospheric environment.


|
| Fig.7 An example of the WZD derived from the GPS reference stations from Nov 28 to Dec 3, 2018 The black lines represent the overflight time of the altimeters as described in the figure. |
The differences in the MWR-ECMWF WZD during the calibration are shown in Fig. 8. The differences were repeatable at the 20-mm level. In the open ocean, which is between 50 and 150 km from the coast, the standard bias of the MWR and ECMWF was between 1.0 and 7.3 mm, which shows that the MWR performed well. Fernandes and Lázaro (2018) pointed out that land contamination was observed up to between 20 and 25 km, in line with the instrument specifications, and the RMS of the differences at those distances was about 1.8 cm. For a distance of less than 15 km from the coast, the difference between the MWR and ECMWF was between 2.1 and 14 mm. The variances of the differences were larger for the Sentinel-3 than Jason-3 in this area (Fig. 8c), perhaps because of the algorithm of the bright temperature of the MWR; some of the MWR observations may still have considerable noise, indicating contamination from the small islands.

|
| Fig.8 The WZD difference between the MWR and ECMWF model a. represents the Jason-3 Pass 153. They are about -8-13 mm; b & c. represent the Sentinel-3A in Wanshan Islands. |
To obtain an accurate WZD, we also compared the GPS, MWR, and ECMWF (Fig. 9). We confirm that it is very important to use GPS measurements that are as close as possible to the satellite radiometer data when computing wet tropospheric correction terms. Therefore, to minimize the amount of land contamination to the MWR, the comparison points were less than 15 km from the GPS reference stations (manganese purple lines in Fig. 8). There were no significant variations between the GPS, MWR, and ECWMF during the calibration. The results from the MWR were more consistent with the GPS WZD than those from the ECMWF. The comparison point in the Cal/Val was less than 15 km from land, in this case the islands, and the WZD from the ECMWF was used to correct the SSH.

|
| Fig.9 Comparison of the GPS WZD, MWR, and ECMWF during the campaigns |
The Jason-3 and Sentinel-3A passed over the Wanshan area during the 2 campaigns (Fig. 1), so we were able to compare the SSH derived from the altimeters and the in-situ SSH using the tide gauges placed on Zhiwan, Wailingding, and Dangan Islands independently. The Cal/Val of the altimeters was done using the methodology presented in Section 2.5, together with the tidal and geoid differences.
4.2.1 Jason-3The Jason-3 ascending 153 Pass flew over the Miaowan Islands, a group of about a dozen small islands, and several other islands to the southwest of Wailingding Island. Where the Jason-3 had only three footprints of 1-Hz data, the distance between the two islands was only about 25 km (Fig. 1).
The Jason-3 SSH from the 1-Hz and 20-Hz data and the waveforms of cycles 077, 078, and 101 are shown in Fig. 10a–c. The pseudocolor plot or vertical line in Fig. 10 corresponds to the 20-Hz waveform. The lighthouse location can be deduced from the waveform when the satellite travelled through the islands to the southwest of Wailingding Island (white arrow in Fig. 10). There were no measurements in the 20-Hz range when it travelled through the Miaowan Islands. The waveform data for this area did not have a lighthouse, perhaps because of the coastal algorithm of the level 2 products of the altimeter. However, there was considerable variation in the SSH when the footprints were close to both sides of the islands, which sometimes meant that the 20-Hz data were missing (Fig. 10b&c). The waveforms therefore need to be retracked to calculate the range, which will form part of our future research. The precision of the tidal prediction system and geoid were low when the distance from the tide gauge to the altimeter footprint was more than 30 km, and so did not meet the requirements of the Cal/Val. The SSH of the 1-Hz data performed well in the middle point and followed the same trend, and the points to the south of the Miaowan Islands were not contaminated by the island and so were used in the Cal/Val (the blue points in Fig. 10).

|
| Fig.10 The SSH and the waveforms of Jason-3 for passes 077, 078, and 101 The waveforms are plotted as latitude (x-axis), gate number (y-axis), and amplitude. The purple triangles are the SSH of the 1-Hz data, while the green asterisk line with stars is the SSH of the 20-Hz data. The blue points are used in the Cal/Val. |
The bias of Jason-3 was determined using the tide gauges on Wailingding and Zhiwan Islands (the red and blue lines in Fig. 11). The total bias of the Jason-3 1-Hz data was +20.7±49.7 mm, which indicates that the Jason-3 altimeter performed well and the results were consistent with its initial design indicators and other previous studies (Crétaux et al., 2018).

|
| Fig.11 The bias of Jason-3 The WZD derived from the ECMWF was used when determining the SSH. The error bars show the standard bias of the 20-Hz data. |
The Sentinle-3A has two orbits in this area. When descending, it flies over Zhiwan and Erzhou Islands, while, when ascending, it flies over Dangan Island (Fig. 12a). The coastal algorithm developed by the Collecte Localisation Satellites (CLS) has been used to reduce the land contamination in coastal conditions (Picard et al., 2017). The 20-Hz data still has the range measurements while the altimeter flies over the islands, which means that the retracking algorithm does not recognize the islands when the altimeters travel through. However, the islands influenced the range of the altimeter measurements and the SSH.

|
| Fig.12 The SSH and the waveform of Sentinel-3A The waveforms are plotted as latitude (x-axis), gate number (y-axis), and amplitude. a) represents the descending pass and b) represents the ascending pass. The purple triangle was the SSH of the 1-Hz data, while the green asterisk line with stars was the SSH of the 20-Hz data. The blue points are used in the Cal/Val. |
The waveforms of the altimeters (colorbar) and the 1-Hz and 20-Hz SSH results (the purple dotted line and the green star line) are shown in Fig. 12. The 1-Hz SSH of the descending pass still has the SSH results when the location of the footprint was just on Zhiwan and Erzhou Islands (the red five stars point in Fig. 12a). The situation was the same when it flew over Dangan Island during the ascending pass (the 20-Hz data in Fig. 12b). In the descending pass, there were 3 footprints of 1-Hz data between Zhiwan Island and the coastal line, as in Pass 153 of Jason-3. Therefore, the middle point was used in the Cal/Val to reduce the influence of the islands. In the ascending pass, the footprints located about 9 km south of Dangan Island were chosen for the Cal/Val (blue points in Fig. 12). The tide gauges were not far (less than 30 km) from the comparison points of the altimeters and the SSH measurements were not contaminated by the island.
When compared with the in-situ SSH measured by the tide gauge from Dangan, Wailingding, and Zhiwan Islands, the bias of the Sentinel-3A altimeter SAR mode for the Wanshan area (Fig. 13) was (+30.1± 39.4) mm, which was consistent with the (+22±7) mm measured in Corsica (Bonnefond et al., 2018).

|
| Fig.13 The bias of the Sentinel-3A The WZD derived from ECMWF was used to determine the SSH. The error bar was the standard bias of the 20-Hz data. |
The Wanshan Islands were chosen as the first specific field for calibrating and validating the HY-2 satellite altimeters. We carried out 2 campaigns and did preliminary calibrations of the Jason-3 and Sentinel-3A passes. We obtained in-situ SSH measurements from the tide gauges, GPS reference stations, and GPS buoys placed on Zhiwan, Dangan, and Wailingding Islands. The NAO.99b and EGM2008 were used to make tidal and geoid connections between the tide gauge locations and the altimeter footprints. The bias was +20.7±49.7 mm for Jason-3 and +30.1±39.4 mm for Sentinel 3A. Although the distance from the island to the altimeter footprint was less than 10 km (about 8 km), the Cal/Val agreed well with other calibration sites. This shows that the altimeters performed very well in this area, and that this area was very suitable as an in-situ calibration field.
The footprint of the altimeters was contaminated by the islands in this area. The Wanshan Islands comprise more than 100 small islands and so there may be considerable spatial and temporal variability in the humidity, which may then affect the WZD validations and the SSH calibration. The Dangan-ZhiwanMiaowan Islands are aligned from the northeast to the southwest, while the open ocean is to the southeast of the islands. The altimeter and MWR perform better in the open ocean, where there is no contamination from the islands, rather than close to them. There is still room for improvement in the foundation of the Cal/ Val field. For example, there is no tide gauge in the Miaowan Islands, which means it is difficult to calibrate the Jason-3 altimeter, so more facilities should be established in this calibration field. Also, the in-situ SSH derived from the tide gauge should be supported by a precise local tidal model and geoid established between the tide gauge locations and the altimeter footprints. Further, new algorithms should be developed for each altimeter in this area.
6 DATA AVAILABILITY STATEMENTThe Jason-3 and Sentinel-3A altimeter data that support the findings of this study were produced and distributed by Aviso+ (https://www.aviso.altimetry.fr/) and CREODIAS (https://finder.creodias.eu/). GPS reference stations, tide gauge and GPS buoy data are available on request from the corresponding author. At the request of the organizations that funded this study, the GPS buoy data have not been made publicly available.
7 ACKNOWLEDGMENTWe would like to thank various people for contributing to this work, including LIN Mingsen, MA Chaofei and SONG Qingjun. We thank ZHAO Tingquan, QIN Debin, ZHAO Da, HONG Zongjian, and SU Liang from for the field work. We also grateful to the CNES-AVISO and CREODIAS for providing free access to the Jason-3 and Sentinel-3A data, respectively.
Boehm J, Schuh H. 2004. Vienna mapping functions in VLBI analyses. Geophysical Research Letters, 31(1): L01603.
|
Bonnefond P, Exertier P, Laurain O, Thibaut P, Mercier F. 2013. GPS-based sea level measurements to help the characterization of land contamination in coastal areas. Advances in Space Research, 51(8): 1383-1399.
DOI:10.1016/j.asr.2012.07.007 |
Bonnefond P, Laurain O, Exertier P, Boy F, Guinle T, Picot N, Labroue S, Raynal M, Donlon C, Féménias P, Parrinello T, Dinardo S. 2018. Calibrating the SAR SSH of Sentinel-3A and CryoSat-2 over the Corsica facilities. Remote Sensing, 10(2): 92.
DOI:10.3390/rs10010092 |
Brown S. 2010. A novel near-land radiometer wet path-delay retrieval algorithm: application to the Jason-2/OSTM advanced microwave radiometer. IEEE Transactions on Geoscience and Remote Sensing, 48(4): 1986-1992.
DOI:10.1109/TGRS.2009.2037220 |
Cancet M, Bijac S, Chimot J, Bonnefond P, Jeansou E, Laurain O, Lyard F, Bronner E, Féménias P. 2013. Regional in situ validation of satellite altimeters: calibration and crosscalibration results at the Corsican sites. Advances in Space Research, 51(8): 1400-1417.
DOI:10.1016/j.asr.2012.06.017 |
Cartwright D E, Edden A C. 1973. Corrected tables of tidal harmonics. Geophysical Journal International, 33(3): 253-264.
DOI:10.1111/j.1365-246X.1973.tb03420.x |
Chen C T, Zhai W L, Yan L H, Zhang Q, Zhang X X, Zhu J H, He S Y. 2014. Assessment of the GPS buoy accuracy for altimeter sea surface height calibration. In: Proceedings of the 2014 IEEE International Geoscience and Remote Sensing Symposium. IEEE, Quebec City, QC, Canada. p.3 101-3 104.
|
Chen C T, Zhu J H, Zhai W L, Yan L H, Zhao Y L, Huang X Q, Yang W W. 2019. Absolute calibration of HY-2A and Jason-2 altimeters for sea surface height using GPS buoy in Qinglan, China. Journal of Oceanology and Limnology, 37(5): 1533-1541.
DOI:10.1007/s00343-019-8216-8 |
Crétaux J F, Bergé-Nguyen M, Calmant S, Jamangulova N, Satylkanov R, Lyard F, Perosanz F, Verron J, Montazem A S, Le Guilcher G, Leroux D, Barrie J, Maisongrande P, Bonnefond P. 2018. Absolute calibration or validation of the altimeters on the Sentinel-3A and the Jason-3 over Lake Issykkul (Kyrgyzstan). Remote Sensing, 10(11): 1679.
DOI:10.3390/rs10111679 |
Dong X J, Woodworth P, Moore P, Bingley R. 2002. Absolute calibration of the TOPEX/POSEIDON altimeters using UK tide gauges, GPS, and precise, local geoid-differences. Marine Geodesy, 25(3): 189-204.
DOI:10.1080/01490410290051527 |
EUMETSAT. 2017. Sentinel-3 SLSTR Marine User Handbook. Doc. No.:EUM/OPS-SEN3/MAN/17/921927, Issue: v1B e-signed.
|
Fernandes M J, Lázaro C. 2018. Independent assessment of Sentinel-3A wet tropospheric correction over the open and coastal ocean. Remote Sensing, 10(3): 484.
DOI:10.3390/rs10030484 |
Fu L L, Christensen E J, Yamarone C A, Lefebvre M, Ménard Y, Dorrer M, Escudier P. 1994. Topex/Poseidon mission overview. Journal of Geophysical Research, 99(C12): 24369-24381.
DOI:10.1029/94JC01761 |
Fu L L, Haines B J. 2013. The challenges in long-term altimetry calibration for addressing the problem of global sea level change. Advances in Space Research, 51(8): 1284-1300.
DOI:10.1016/j.asr.2012.06.005 |
Haines B J, Desai S D, Born G H. 2010. The harvest experiment: calibration of the climate data record from Topex/Poseidon, Jason-1 and the ocean surface topography mission. Marine Geodesy, 33: 91-113.
DOI:10.1080/01490419.2010.491028 |
Haines B J, Dong D, Born G H, Gill S K. 2003. The harvest experiment: monitoring Jason-1 and Topex/Poseidon from a California offshore platform. Marine Geodesy, 26(3-4): 239-259.
DOI:10.1080/714044520 |
Herring T A, King R W, Folyd M A, McClusky S C. 2018. Introduction to GAMIT/GLOBK Release 10.7. Massachusetts Institute of Technology, Cambridge.
|
Jiang X W, Lin M S, Song Q J. 2016. On the construction of China's ocean satellite radar altimetry calibration site. Ocean Development and Management, 33(5): 8-15.
(in Chinese with English abstract) |
Liu Y L, Tang J W, Zhu J H, Lin M S, Zhai W L, Chen C T. 2014. An improved method of absolute calibration to satellite altimeter: a case study in the Yellow Sea, China. Acta Oceanologica Sinica, 33(5): 103-112.
DOI:10.1007/s13131-014-0476-8 |
Matsumoto K, Takanezawa T, Ooe M. 2000. Ocean tide models developed by assimilating Topex/Poseidon altimeter data into hydrodynamical model: a global model and a regional model around Japan. Journal of Oceanography, 56(5): 567-581.
DOI:10.1023/A:1011157212596 |
Mertikas S P, Daskalakis A, Tziavos I N, Vergos G S, Frantzis X, Tripolitsiotis A, Partsinevelos P, Andrikopoulos D, Zervakis V. 2011. Ascending and descending passes for the determination of the altimeter bias of Jason satellites using the Gavdos facility. Marine Geodesy, 34(3-4): 261-276.
DOI:10.1080/01490419.2011.584837 |
Mertikas S, Donlon C, Féménias P, Mavrocordatos C, Galanakis D, Tripolitsiotis A, Frantzis X, Kokolakis C, Tziavos I N, Vergos G, Guinle T. 2018. Absolute calibration of the European Sentinel-3a surface topography mission over the permanent facility for altimetry calibration in west Crete, Greece. Remote Sensing, 10(11): 1808.
DOI:10.3390/rs10111808 |
Mitchum G T. 1998. Monitoring the stability of satellite altimeters with tide gauges. Journal of Atmospheric and Oceanic Technology, 15(3): 721-730.
DOI:10.1175/1520-0426(1998)015<0721:MTSOSA>2.0.CO;2 |
Ortiz de Galisteo J P, Toledano C, Cachorro V, Torres B. 2010. Improvement in PWV estimation from GPS due to the absolute calibration of antenna phase center variations. GPS Solutions, 14(4): 389-395.
DOI:10.1007/s10291-010-0163-y |
OSTM. 2017. Jason-3 Products Handbook. Issue: 1, Rev: 4. https://www.ospo.noaa.gov/Products/documents/hdbk_j3.pdf.
|
Pavlis N K, Holmes S A, Kenyon S C, Factor J K. 2012. The development and evaluation of the Earth Gravitational Model 2008 (EGM2008). Journal of Geophysical Research, 117(B4): B04406.
DOI:10.1029/2011JB008916 |
Picard B, Fréry M, Pardé M, Bonnefond P, Laurain O, Crétaux J F. 2017. A wet tropospheric correction dedicated to hydrological and coastal applications. In: Proceedings of the Ocean Surface Topography Science Team Meeting. Miami, USA.
|
Wahr J M. 1985. Deformation induced by polar motion. Journal of Geophysical Research: Solid Earth, 90(B11): 9363-9368.
DOI:10.1029/JB090iB11p09363 |
Watson C, Coleman R, Handsworth R. 2008. Coastal tide gauge calibration: a case study at Macquarie Island using GPS buoy techniques. Journal of Coastal Research, 24(4): 1071-1079.
|
Watson C, Neil W, John C, Reed B, Paul T, Richard C. 2011. Absolute Calibration in Bass Strait, Australia: TOPEX, Jason-1 and OSTM/Jason-2. Marine Geodesy, 34(3-4): 242-260.
DOI:10.1080/01490419.2011.584834 |
Xu X Y, Birol F, Cazenave A. 2018. Evaluation of Coastal Sea Level Offshore Hong Kong from Jason-2 Altimetry. Remote Sensing, 10(2): 282.
DOI:10.3390/rs10020282 |
Xu X Y, Xu K, Shen H, Liu Y L, Liu H G. 2016. Sea surface height and significant wave height calibration methodology by a GNSS buoy campaign for HY-2A altimeter. IEEE Journal of Selected Topics in Applied Earth Observations and Remote Sensing, 9(11): 5252-5261.
DOI:10.1109/JSTARS.2016.2584626 |
Yang L, Zhou X H, Mertikas S P, Zhu L, Yang L, Lei N. 2017. First calibration results of Jason-2 and SARAL/AltiKa satellite altimeters from the Qianli Yan permanent Cal/Val facilities, China. Advances in Space Research, 59(12): 2831-2842.
DOI:10.1016/j.asr.2017.02.044 |
Zhai W L, Chen C T, Zhu J H, Yan L H. 2016. Research of calibration of satellite altimeter technology based on GPS Bouy. Remote Sensing Technology and Application, 31(5): 925-929.
(in Chinese with English abstract) |
Zhai W L, Zhu J H, Chen C T, Yan L H, Huang X Q. 2019. Calibration of Hy-2a satellite altimeter based on GPS Bouy. In: Proceedings of the 2019 IEEE International Geoscience and Remote Sensing Symposium. IEEE, Yokohama, Japan. p.8 300-8 303.
|
Zhai W L, Zhu J H, Ma C F, Fan X H, Yan L H, Wang H, Chen C T. 2020. Measurement of the sea surface using a GPS towing-body in Wanshan area. Acta Oceanolodica Sinica, 39(5): 123-132.
DOI:10.1007/s13131-020-1599-8 |