 2021, Vol. 39
Institute of Oceanology, Chinese Academy of Sciences
Article Information
- ZHAO Miaomiao, HE Qiang, CHEN Chongtai, TIAN Yaqi, WEI Jing, DUAN Pengfei, WU Haiming, LI Ming
- Effects of iron and humic acid on competition between Microcystis aeruginosa and Scenedesmus obliquus revealed by HPLC analysis of pigments
- Journal of Oceanology and Limnology, 39(2): 525-535
- http://dx.doi.org/10.1007/s00343-020-0012-y
Article History
- Received Jan. 8, 2020
- accepted in principle Feb. 17, 2020
- accepted for publication Apr. 11, 2020


2 Collaborative Innovation Center of Water Security for Water Source Region of Mid-line of South-to-North Diversion Project of Henan Province, Nanyang Normal University, Nanyang 473061, China;
3 Scientific Laboratory of Heyang Agricultural Environment and Farmland Cultivation, Ministry of Agriculture and Rural Affairs, Heyang 715300, China
Cyanobacterial blooms occur frequently in aquatic ecosystems, causing a decline in water quality and a decrease in biodiversity (Carey et al., 2012; Boopathi and Ki, 2014; Ibelings et al., 2014). Microcystis is a common bloom-forming cyanobacterial species. Some Microcystis species may produce microcystins, threatening environmental safety and public health (Backer et al., 2010; Meneely and Elliott, 2013). The robust competitiveness of Microcystis is the basis for the production of large amounts of Microcystis biomass and the formation of Microcystis blooms. Thus, reducing Microcystis competitiveness is a potential method to restore the balance of water ecosystem and to control Microcystis blooms. It is, therefore, essential to study the competition relationship between Microcystis and other algae, and the factors that influence it, to reduce the biomass of Microcystis and perhaps of cyanobacteria in general.
Biomass determination is fundamental to any study of the competition between Microcystis and other algae. The most common methods are microscopic counting using a hemocytometer; impedance counters; and flow cytometry. Microscopic counting using a hemocytometer is widely used in the study of algal competition (Fujimoto et al., 1997; Xie et al., 2003; Shen et al., 2011; Zhang et al., 2013; Bittencourt-Oliveira et al., 2015), but this method is time-consuming and of low precision. Impedance counters such as Coulter counters calculate the phytoplankton biomass using resistance pulses, but the estimates are susceptible to coexisting cells (Lürling and Roessink, 2006). Flow cytometry is currently the best method, and allows rapid and accurate determination (Brussaard et al., 1999). Flow cytometry can quantify and classify a miscellaneous algae population according to light scattering (size and shape) and autofluorescence (pigment), and simultaneously avoids the disadvantages of the microscopic counting and impedance counter methods. However, it has not been widely used in competitive tests owing to high cost of the instrument. Thus, it is necessary to establish a low-cost, fast and accurate method to count cells in studies of algae competition.
Different species of algae have different pigment compositions (Mackey et al., 1998). The unique pigments in an algae strain are often called marker pigments. Marker pigment composition and concentration can be used for species identification and the ratio determination of each species (Bidigare et al., 1992; Millie et al., 1993). Mackey et al. (1998) analyzed the dominant species of phytoplankton at different water depths based on pigment composition and concentration using high performance liquid chromatography (HPLC). Wilhelm et al. (1991) also monitored phytoplankton community composition and bloom dynamics in marine and freshwater systems based on pigment. Researchers have also established a mathematical method to study population abundance by pigment (Rodriguez et al., 2002; Llewellyn et al., 2005; Agirbas et al., 2015). Thus, the biomass of algae or cyanobacteria in mixed culture can be calculated by measuring their marker pigments concentrations. M. aeruginosa belongs to the cyanobacteria and has unique zeaxanthin (Guillard et al., 1985). S. obliquus belongs to the green algae and contains unique lutein and chlorophyll b pigments (Jeffrey, 1976; Mackey et al., 1998). Therefore, the fitting curves between Microcystis and zeaxanthin, Scenedesmus and lutein or chlorophyll b can be established, and then the biomass of Microcystis and Scenedesmus in mixed culture can be calculated according to their marker pigments (Andersen et al., 1996).
Iron is an essential microelement for algae growth and reproduction. Iron deficiency causes not only a decrease in algae biomass (Li et al., 2009; Alexova et al., 2011), but also a decline in protein content (Lyck et al., 1996), photosynthesis rate, saturation photoelectron level and maximum electron transfer rate of algae cells (Xing et al., 2007). Interestingly, blooms occur more frequently in areas with high iron concentrations than that with low iron concentrations (Xu et al., 2013). In addition, the growth of Microcystis can be inhibited by humic acid because humic acid can bind iron thereby reduce the bio-availability of iron by Microcystis (Imai et al., 1999; Sun et al., 2005). The concentration of humic acid in aquatic ecosystems will change with its extensive application in soil remediation and land use changes. Hence, changes in concentrations of iron and humic acid can affect the growth of Microcystis and the competition between Microcystis and other algae. Building on the above research into algae with different iron utilization and absorption mechanisms, a competition hypothesis can be proposed. This is that algae with stronger iron utilization and adsorption mechanisms will dominate environments that are iron deficient because of the action of humic acid; and that the competitive ability of dominant species can be weakened or even reversed when iron concentrations are increased.
2 MATERIAL AND METHOD 2.1 Algae species and culture conditionsMicrocystis aeruginosa (FACHB-469) and Scenedesmus obliquus (FACHB-416) were purchased from the Freshwater Algae Culture Collection, Institution of Hydrobiology of Wuhan Province, Chinese Academy of Sciences. The two strains were cultured axenically for 3 months before the experiment.
Both species were cultured in 250-mL conical flask with 150-mL BG-11 medium. Prior to inoculation, the conical flask was rinsed with distilled water two times by using an ultrasonic machine for 6 min, and then rinsed with distilled water three times. The culture was centrifuged and the pellets were washed with iron-free BG-11 medium for three times before inoculation. The initial cell density of M. aeruginosa and S. obliquus was 30×104 cells/mL and 5×10⁴ cells/ mL, respectively. The initial biomass of Scenedesmus and Microcystis was considered basically the same because the unicellular volume of S. obliquus is about six times than that of M. aeruginosa (Zhu et al., 2016). The flasks were then placed in a thermostatic incubator (GXZ-800C-3, Ningbo jiangnan Instrument Factory, Zhejiang, China) at 25 ℃ under 50 μmol/(m2·s) of light intensity for 10 days. The light: dark cycle was 12 h: 12 h. Each treatment had three biological duplicates and one measurement replicate, and the cultures were manually shaken three times a day to prevent cells from adhering to the flask walls.
2.2 Experiment design and cell countingMicrocystis aeruginosa and S. obliquus were grown as mono-cultures and in mixed cultures in varying concentrations of humic acid. Song et al. (2019) indicated that the average concentration of dissolved organic carbon in dozens of lakes in Eastern China was 5.92 mg/L and the humic acid-like compounds contributed to about 50% of the total dissolved organic matter fluorescence. It seems a reasonable deduction that the average concentration of humic acid was about 3.0 mg/L (as carbon) and thus the humic acid concentrations were set as 0, 1, 3, and 5 mg/L (as carbon). The iron concentrations were also adjusted to 0.01 and 1.00 mg/L using ammonium ferric citrate to simulate iron deficiency and iron sufficiency waters because the iron concentrations in some eutrophic lakes ranged from 0.01 to 1.95 mg/L (Yu et al., 2000; Cao et al., 2004; Zhang et al., 2008) and the iron concentration in BG-11 culture medium was 0.68 mg/L. The pigments of these two species in mono and mixed cultures were measured, and the cell density of Microcystis and Scenedesmus in mono-cultures was also determined using a UV-1780 spectrophotometer (Shimadzu, Kyoto, Japan). Therefore, the cell density of M. aeruginosa and S. obliquus in mixed cultures was calculated based on the relationships between M. aeruginosa and zeaxanthin, S. obliquus and lutein. The relationships between the two phytoplankton biomass and pigments was then obtained in BG11 medium.
2.3 Pigment determinationThe cultures were filtered through glass fiber filter membranes (Whatman GF/F), and the sample volumes were determined based on M. aeruginosa and S. obliquus cell density. The membranes were then placed in a plugged colorimetric tube containing 5-mL acetone, capped and extracted using an Ultrasonic Cleaner (SB 25-12 DTDN, Ningbo Xinzhi Biotechnology Co., Ltd., Zhejiang, China) for 10 min at 4 ℃ and using an refrigerator (Galanz BCD-180 N, Guangdong, China) for 24 h at -20 ℃. Extractions were filtered through a 0.22-μm filter with polytetrafluoroethylene (PTEF) syringe once again, and the filters were packed in 1.5-mL brown chromatographic bottles for analysis of composition and concentrations of pigments using HPLC (Agilent-1100 series, USA).
Mobile phase A was a mixture of methanol and 0.5 mol/L ammonium acetate at a ratio of 2:1, and mobile phase B was a solution at a ratio of 3:7 methanol: acetonitrile. Samples of 100 μL were taken of mobile phases A and B to measure pigment by HPLC. Each sample was determined for 65 min and the ratio of mobile phases A and B changed over time.
2.4 Data analysisThe specific growth rate (μ, /d) of M. aeruginosa and S. obliquus under mono and mixed cultures was calculated by the following regression equation (Eq.1) (Chu et al., 2007), where B is phytoplankton abundance, and t and b are culture time (day) and initial cell density (cells/mL), respectively:
 (1)
(1)Growth curve fitting was calculated according to the logistic function where N is biomass, K represents carrying capacity and r is intrinsic growth rate (Eq.2):
 (2)
(2)The time of inflexion (tp, days) represents the start point of inhibition, and is calculated as in Eq.3:
 (3)
(3)The population dynamics of the two competition strains in the medium were calculated according to the Lotka-Volterra competition model (Volterra, 1926), where Ns (Ns-1) and Nm (Nm-1) are the abundance of M. aeruginosa and S. obliquus at tn and tn-1 (days), respectively; rs and rm are the intrinsic growth rates of mono-cultured M. aeruginosa and S. obliquus, respectively; Ks (Km) represents the carrying capacity of mono-cultured M. aeruginosa and mono-cultured S. obliquus, respectively; and competition coefficient α (β) represents the effect of S. obliquus (M. aeruginosa) on M. aeruginosa (S. obliquus) in mixed culture conditions, respectively (Eq.4):
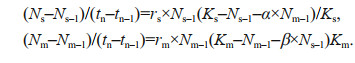 (4)
(4)All data in this study were expressed as mean±SD (standard deviation). Data differences were analyzed by one-way ANOVA using SPSS19.0 software.
3 RESULT 3.1 Method establishmentA linear relationship between cell density of M. aeruginosa and zeaxanthin concentration, and a linear relationship between cell density of S. obliquus and lutein concentration were found (Fig. 1). The slope and intercept of formula between M. aeruginosa and zeaxanthin were 1 985.40 and 234.35, respectively. The regression coefficient (R2) of this formula was 0.91, which represents a good linear correlation between M. aeruginosa and zeaxanthin. The slope and intercept of formula between S. obliquus and lutein were 197.63 and 108.05, respectively. The R2 value was also as high as 0.71. Thus, those two formulas can be used as a basis for calculating the biomass of M. aeruginosa and S. obliquus that were in mixed cultures.

|
| Fig.1 Fitted curve of M. aeruginosa and zeaxanthin (a) and S. obliquus and lutein (b) |
The cell densities of M. aeruginosa and S. obliquus in mono-cultures increased as the iron concentrations increased (Fig. 2a & c). When iron concentrations increased from 0.01 to 1.00 mg/L, the biomass of M. aeruginosa in mono-cultures increased from 2.49×10⁷ to 3.09×10⁷ cells/mL, and the biomass of S. obliquus in mono-cultures also increased from 1.13×10⁷ to 1.35×10⁷ cells/mL. The cell densities of M. aeruginosa and S. obliquus at high iron concentrations increased by 19.30% and 15.72%, respectively, compared with low iron concentrations.

|
| Fig.2 Growth curve of M. aeruginosa and S. obliquus in mono-cultures (a. low iron concentration; c. high iron concentration) and in mixed (b. low iron concentration; d. high iron concentration) cultures |
The effect of humic acid on the growth of M. aeruginosa and S. obliquus in mono-cultures was closely related to iron concentration (Fig. 2a & c). In iron deficiency conditions (0.01 mg/L), Microcystis biomass in mono-cultures decreased with increasing concentrations of humic acid. When humic acid concentrations were 5 mg/L, cell density of Microcystis was reduced to the minimum of 0.80×10⁷ cells/mL, and inhibition was as high as 67.84%. The inhibition of humic acid on Microcystis growth was greatly alleviated when the iron concentration was increased (1.00 mg/L), and the maximum inhibition ratio was only 5.83%. The inhibition of humic acid on S. obliquus growth in mono-cultures decreased first and then increased at low iron concentrations. The minimum biomass of S. obliquus occurred when humic acid concentrations were 3 mg/L, and biomass of S. obliquus was 0.43×10⁷ cells/mL, which decreased by 46.57% compared with the control treatment. The increased iron concentrations alleviated the inhibition rate of humic acid on S. obliquus biomass, and the maximum inhibition ratio was decreased to 23.06%.
The biomass of M. aeruginosa in mixed cultures was lower than that in mono-cultures (Fig. 2b & d). After 10 days of cultivation, the cell density of M.aeruginosain mixed cultures was 0.57×10⁷ cells/mL at low iron concentrations, and was 1.03×10⁷ cells/mL at high iron concentrations, a reduction of 76.94% and 66.44%, respectively, compared to the biomass of M. aeruginosa in mono-cultures. The biomass of S. obliquus was 0.68×10⁷ cells/mL at low iron concentrations, and was 1.22×10⁷ cells/mL at high iron concentrations, a reduction of 39.98% and 9.38%, respectively.
The biomass of mixed cultured Microcystis was unchanged at low iron concentrations and decreased at high iron concentrations, when humic acid was added. As humic acid concentrations increased, the biomass of S. obliquus in mixed cultures decreased at low iron concentrations at 6 and 8 days, and its biomass first increased and then decreased at high iron concentrations.
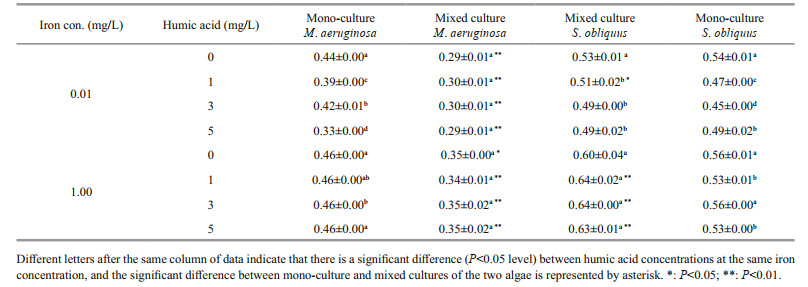
The specific growth rate of M. aeruginosa and S. obliquus in mono-cultures increased as iron concentrations rose (Table 1). The specific growth rate of M. aeruginosa and S. obliquus in mono-cultures was 0.44 and 0.54 at low iron concentrations, and 0.46 and 0.56 at high iron concentrations, respectively. Compared with low iron concentrations, the specific growth rate of M. aeruginosa and S. obliquus at high iron concentrations increased by 0.9% and 3.1%, respectively.
|
Humic acid had negative effects on the specific growth rates of M. aeruginosa and S. obliquus in mono-cultures, and this native effect at low iron concentrations was greater than that at high iron concentrations.
The specific growth rate of M. aeruginosa in mixed cultures rose when iron was increased, which was lower than that in mono-cultures. The specific growth rate of M. aeruginosa increased from 0.29/d in iron deficiency conditions to 0.35/d in iron sufficiency conditions. The specific growth rate of S. obliquus in mixed or mono-cultures was almost unaffected by different iron concentration.
The specific growth rate in mixed cultures was unchanged (0.29–0.30/d) for M. aeruginosa, and decreased from 0.53 to 0.49/d for S. obliquus as concentrations of humic acid increased at low iron concentrations. Increasing concentrations of humic acid caused a decline in the specific growth rate of M. aeruginosa and an increase in the specific growth rate of S. obliquus at high iron concentrations.
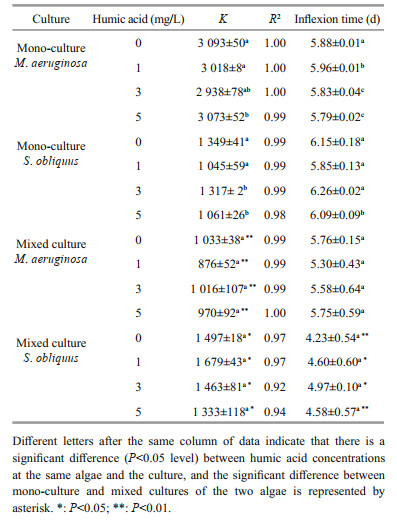
3.3 Competition parameter and modelThe carrying capacity (K), the regression coefficients (R2) and inflection time (tp) under low (0.01 mg/L) and high iron concentrations (1.00 mg/L) are listed in Tables 2 and 3, respectively. The R2 values were 0.87–1.00, indicating that the logistic function N=K/(1+ea–rt) fitted the growth curve well. The K values in mixed cultures were higher than in mono-cultures for S. obliquus, but were significantly lower than in mono-cultures for M. aeruginosa. The tp value of M. aeruginosa and S. obliquus in mixed cultures were lower than that in mono-cultures.

|
|
The K values of M. aeruginosa and S. obliquus in mono-cultures rose as iron concentrations increased. When humic acid concentrations were increasing, the K values in mono-cultures were significantly reduced for M. aeruginosa and S. obliquus at low iron concentrations, and the increased iron concentrations alleviated the inhibition of humic acid on K values for both M. aeruginosa and S. obliquus.
The carrying capacity (K) of M. aeruginosa and S. obliquus in mixed cultures increased when iron concentrations were increasing. A significant decline in K and were caused in mixed cultures by increased humic acid concentrations for S. obliquus at low iron concentrations. The K values in mixed cultures were reduced for M. aeruginosa at low or high iron concentrations, but were unchanged for S. obliquus at high iron concentrations as humic acid concentrations increased.
The mutual competitiveness between M. aeruginosa and S. obliquus reduced when iron concentrations were increasing (Fig. 3). The competitive advantage of M. aeruginosa was increased at low iron concentrations and decreased at high iron concentrations with the increase concentrations of humic acid. At low iron concentrations, the inhibition (α) of S. obliquus on M. aeruginosa was decreased as concentrations of humic acid rose, and S. obliquus growth was also inhibited by M. aeruginosa in mixed cultures. When iron concentrations were increased to 1.00 mg/L, the α value of S. obliquus on M. aeruginosa increased as humic acid concentrations rose, but the effect (β) of M. aeruginosa on S. obliquus was transferred from native inhibition (β > 0) to positive promotion (β < 0); this positive promotion reduced as concentrations of humic acid increased.

|
| Fig.3 Competition coefficiency of M. aeruginosa (a) and S. obliquus (b) in mixed cultures at 0.01 and 1.00 mg/L of iron concentrations |
There was a good linear correlation between Microcystis and zeaxanthin, and between Scenedesmus and lutein. Wang et al. (2014) found that the Microcystis biomass well fitted chlorophyll a concentrations at different iron concentrations (0.167–2.01 mg/L), with the regression coefficient (R2) as high as 0.826 8. Kosakowska et al. (2004) also demonstrated fine relationships between Phaeodactylum tricornutum and chlorophyll a, between P. tricornutum and fucoxanthin, and between P. tricornutum and diadinoxanthin, under different iron concentrations (0.056–560 μg/L): the regression coefficients were 0.82, 0.88, and 0.78, respectively. Thus, there was a relative stable linear relationship between the biomass of cyanobacteria or algae and marker pigments under different iron concentrations Laboratory or natural conditions, the method for determining biomass established in this study is realistic and can be used to study the effect of iron and humic acid on competition between Microcystis and Scenedesmus.
Agirbas et al. (2015) calculated diatom biomass with fucoxanthin and diadinoxanthin; dinoflagellate biomass with peridinin; and coccolithophore biomass with 19'-hexanoyloxyfucoxanthin. Those authors revealed that the biomass of different algae had good relationships with their marker pigments in coastal and offshore areas, with 0.802 5 and 0.67 of the average regression coefficients (R2), respectively. Therefore, this new method for measuring biomass can be used not only for competition between cyanobacteria and green algae, but also for quantitative and qualitative analysis of flagellates (Gieskes and Kraay, 1983), diatoms (Jeffrey and Hallegraeff, 1980, 1987; Hallegraeff, 1981; Hallegraeff and Jeffrey, 1984) and cryptomonas (Wright et al., 1996). Species identification and the dominant determination in field experiments were also faster and more accurate when microscope counting was combined with this new method (Gieskes and Kraay, 1983).
The growth of Microcystis was reduced under low iron concentrations and unchanged under high iron concentrations when humic acid concentrations were rising (Fig. 2a & c). It was well known that humic acid could bind iron and thereby caused a decline in bioavailably of iron (Kerndorff and Schnizer, 1980). However, previous studies found that Microcystis can increase iron absorption by producing large amounts of hydroxamate-type siderophores (Wang et al., 2014) and by activating an effective and high-affinity iron transport system (Efteland, 2004) under low iron concentrations. Kuhn et al. (2014) indicated that about 75% humic-associated iron was removed by siderophore to be used by Microcystis. Thus, bio-available iron reduced when humic acid increased. However, the concentration of bio-available iron under low iron concentration was still low and thus the growth of Microcystis was reduced when humic acid concentrations were rising. Under high iron concentrations, the concentration of bio-available iron was high enough to support the growth of Microcystis.
Scenedesmus biomass also reduced as concentrations of humic acid increased at low iron concentrations (0.01 mg/L), and the reduction was alleviated when iron was at high concentrations. The decline of Microcystis, however, was higher than that of Scenedesmus under iron deficiency conditions caused by humic acid. The reason was that the half-saturation constant of iron for Microcystis was (0.957 6 μg/L) 40 times higher than that (0.022 5 μg/L) for Scenedesmus (Rueler and Ades, 1987; Nagai et al., 2007) because that the siderophores and activated iron transfer system for Scenedesmus were more efficient than those for Microcystis induced by iron limitation (Murphy et al., 1976; Benderliev and Ivanova, 1994). Scenedesmus thus had an advantage over Microcystis under iron-limited conditions caused by humic acid.
Scenedesmus was the dominant species at different iron and humic acid concentrations in mixed cultures. The competitive advantage of Scenedesmus increased as iron concentrations rose, contrary to the hypothesis proposed in this study. Although iron concentrations increased to 1.00 mg/L, Microcystis cells required more iron content than other algal cells (Brand, 1991). Microcystis, therefore, still competed for iron resources with Scenedesmus in mixed cultures, resulting in less Microcystis competitiveness and higher Scenedesmus competitiveness.
Many studies have found that organism growth rate was inversely related to its size. However, this relationship was a statistical result when each organism grew in its own optimal environment. The unicellular volume of Scenedesmus was about 6 times larger than that of Microcystis, but the specific growth rate of Scenedesmus was higher than that of Microcystis under different iron and humic acid concentration in the current study. Previous studies also showed that algal growth rate decreased under adverse conditions (Schlesinger et al., 1981; Koh and Shin, 1990; Nielsen, 2006). Thus, it is likely that the culture condition in the current study was favorable for the growth of Scenedesmus.
The study also found that the inhibition of Scenedesmus on Microcystis (α) decreased as concentrations of humic acid increased under low iron conditions. The biomass or specific growth rate was unchanged for Microcystis and reduced for Scenedesmus with increasing concentrations of humic acid (Table 2 and Fig. 2). The reason may be that Scenedesmus was unable to obtain the required iron content for cell growth at low iron concentrations (0.01 mg/L) (Zhou et al., 2016), although Scenedesmus has a more effective iron competition mechanism. Under these unfavorable conditions, the native effect on the growth and physiology of Scenedesmus rose gradually with increasing concentrations of humic acid (Verstreate et al., 1980). When iron concentrations increased, Microcystis biomass was not affected and its specific growth rate reduced, but Scenedesmus growth and specific growth rate increased (Table 1 and Fig. 2). Under these conditions, Scenedesmus can obtain enough iron from the medium to maintain cell growth, and thus the inhibition of Scenedesmus on Microcystis was increasing owing to the decreasing concentrations of bio-available iron when humic acid was increasing.
Iron concentrations in Lake Taihu, Lake Chaohu, Lake Dianchi and other freshwater bodies are approximately 0.007–1.954 mg/L, showing a gradually increasing trend for the past few years (Yu et al., 2000; Cao et al., 2004; Zhang et al., 2008; Xu et al., 2013). However, the humic acid in lakes and other waters has reduced. Urbanization and land use change has led to a reduction in the areas of woodland and grassland, resulting in a decline in production and input of humic acid. Aquatic plants (including submerged plants, emergent plants, and phytoplankton) also decay in lakes and produce humic acid, but their numbers have decreased significantly. Microcystis competitiveness therefore was increased with the increase of iron concentration and decline of humic acid in natural waters according to our finds, causing the dominance and even blooms of Microcystis or cyanobacteria. Therefore, the occurrence of Microcystis blooms under low iron concentration of waters can be reduced by reducing the urbanization of watershed area, increasing the area of forestland and grassland, and increasing aquatic plants. In watersheds with high iron concentrations, it is necessary to reduce iron concentration by Biological or physical methods to control cyanobacterial blooms.
5 CONCLUSIONThe results showed that zeaxanthin and lutein can be used to calculate the biomass of M. aeruginosa and S. obliquus in mixed cultures, to study the competition relationship between cyanobacteria and green algae. The growth of M. aeruginosa and S. obliquus in mono-cultures was inhibited by humic acid at low iron concentrations (0.01 mg/L); the maximum inhibition ratios were 67.84% and 38.31%, respectively. The inhibition of humic acid on the two species was significantly alleviated when iron concentrations were 1.00 mg/L, with the maximum inhibition rate reduced to 5.82% for M. aeruginosa and to 23.06% for S. obliquus. S. obliquus was the dominant species in mixed cultures, and the mutual inhibition of M. aeruginosa and S. obliquus at low iron concentration was greater than that at high iron concentration. The inhibition of S. obliquus on M. aeruginosa was reduced at low iron concentrations and increased at high iron concentrations as concentrations of humic acid rose.
6 DATA AVAILABILITY STATEMENTData are available on request to the authors.
Agirbas E, Feyzioglu A M, Kopuz U, Llewellyn C A. 2015. Phytoplankton community composition in the south-eastern Black Sea determined with pigments measured by HPLC-CHEMTAX analyses and microscopy cell counts. Journal of the Marine Biological Association of the United Kingdom, 95(1): 35-52.
DOI:10.1017/S0025315414001040 |
Alexova R, Fujii M, Birch D, Cheng J, Waite T D, Ferrari B C, Neilan B A. 2011. Iron uptake and toxin synthesis in the bloom-forming Microcystis aeruginosa under iron limitation. Environmental Microbiology, 13(4): 1 064-1 077.
DOI:10.1111/j.1462-2920.2010.02412.x |
Andersen R A, Bidigare R R, Keller M D, Latasa M. 1996. A comparison of HPLC pigment signatures and electron microscopic observations for oligotrophic waters of the North Atlantic and Pacific Oceans. Deep Sea Research Part Ⅱ: Topical Studies in Oceanography, 43(2-3): 517-537.
DOI:10.1016/0967-0645(95)00095-X |
Backer L C, McNeel S V, Barber T, Kirkpatrick B, Williams C, Irvin M, Zhou Y, Johnson T B, Nierenberg K, Aubel M, LePrell R, Chapman A, Foss A, Corum S, Hill V R, Kieszak S M, Cheng Y S. 2010. Recreational exposure to microcystins during algal blooms in two California lakes. Toxicon, 55(5): 909-921.
DOI:10.1016/j.toxicon.2009.07.006 |
Benderliev K M, Ivanova N I. 1994. High-affinity siderophore-mediated iron-transport system in the green alga Scenedesmus incrassatulus. Planta, 193(2): 163-166.
DOI:10.1007/BF00192525 |
Bidigare R R, Prezelin B B, Smith R C. 1992. Bio-optical models and the problems of scaling. In: Falkowski P G, Woodhead A D, Vivirito K, eds. Primary Productivity and Biogeochemical Cycles in the Sea. Boston: Springer. p. 175-212, https://doi.org/10.1007/978-1-4899-0762-2_11.
|
Bittencourt-Oliveira M C, Chia M A, de Oliveira H S B, Araújo M K C, Molica R J R, Dias C T S. 2015. Allelopathic interactions between microcystin-producing and non-microcystin-producing cyanobacteria and green microalgae: implications for microcystins production. Journal of Applied Phycology, 27(1): 275-284.
DOI:10.1007/s10811-014-0326-2 |
Boopathi T, Ki J S. 2014. Impact of environmental factors on the regulation of cyanotoxin production. Toxins, 6(7): 1 951-1 978.
DOI:10.3390/toxins6071951 |
Brand L E. 1991. Minimum iron requirements of marine phytoplankton and the implications for the biogeochemical control of new production. Limnology and Oceanography, 36(8): 1 756-1 771.
DOI:10.4319/lo.1991.36.8.1756 |
Brussaard C P D, Thyrhaug R, Marie D, Bratbak G. 1999. Flow cytometric analyses of viral infection in two marine phytoplankton species, Micromonas pusilla (Prasinophyceae) and Phaeocystis pouchetii (Prymnesiophyceae). Journal of Phycology, 35(5): 941-948.
DOI:10.1046/j.1529-8817.1999.3550941.x |
Cao D J, Yue Y D, Huang X M, Wei M. 2004. Environmental quality assessment of Pb, Cu, Fe pollution in Chaohu Lake waters. China Environmental Science, 24(4): 509-512.
(in Chinese with English abstract) |
Carey C C, Ibelings B W, Hoffmann E P, Hamilton D P, Brookes J D. 2012. Eco-physiological adaptations that favour freshwater cyanobacteria in a changing climate. Water Research, 46(5): 1 394-1 407.
DOI:10.1016/j.watres.2011.12.016 |
Chu Z S, Jin X C, Iwami N, Inamori Y. 2007. The effect of temperature on growth characteristics and competitions of Microcystis aeruginosa and Oscillatoria mougeotii in a shallow, eutrophic lake simulator system. In: Qin B, Liu Z, Havens K eds. Eutrophication of Shallow Lakes with Special Reference to Lake Taihu, China. Dordrecht: Springer. p. 217-223, https://doi.org/10.1007/978-1-4020-6158-5_24.
|
Duan H T, Ma R H, Xu X F, Kong F X, Zhang S X, Kong W J, Hao J Y, Shang L L. 2009. Two-decade reconstruction of algal blooms in China's Lake Taihu. Environmental Science and Technology, 43(10): 3 522-3 528.
DOI:10.1021/es8031852 |
Efteland S P. 2004. The Effects of Iron on Growth and Physiology of the Cyanobacterium Microcystis aeruginosa. University of Tennessee, Knoxville.
|
Fujimoto N, Sudo R, Sugiura N, Inamori Y. 1997. Nutrient-limited growth of Microcystis aeruginosa and Phormidium tenue and competition under various N: P supply ratios and temperatures. Limnology and Oceanography, 42(2): 250-256.
DOI:10.4319/lo.1997.42.2.0250 |
Gieskes W W C, Kraay G W. 1983. Dominance of cryptophyceae during the phytoplankton spring bloom in the central North Sea detected by HPLC analysis of pigments. Marine Biology, 75(2-3): 179-185.
DOI:10.1007/BF00406000 |
Guillard R R L, Murphy L S, Foss P, Liaaen-Jensen S. 1985. Synechococcus spp. as likely zeaxanthin-dominant ultraphytoplankton in the North Atlantic1. Limnology and Oceanography, 30(2): 412-414.
DOI:10.4319/lo.1985.30.2.0412 |
Hallegraeff G M, Jeffrey S W. 1984. Tropical phytoplankton species and pigments of continental shelf waters of North and North-West Australia. Marine Ecology Progress Series, 20(1): 59-74.
DOI:10.3354/meps020059 |
Hallegraeff G M. 1981. Seasonal study of phytoplankton pigments and species at a coastal station off Sydney: importance of diatoms and the nanoplankton. Marine Biology, 61(2-3): 107-118.
DOI:10.1007/BF00386650 |
Ibelings B W, Backer L C, Kardinaal W E A, Chorus I. 2014. Current approaches to cyanotoxin risk assessment and risk management around the globe. Harmful Algae, 40: 63-74.
DOI:10.1016/j.hal.2014.10.002 |
Imai A, Fukushima T, Matsushige K. 1999. Effects of iron limitation and aquatic humic substances on the growth of Microcystis aeruginosa. Canadian Journal of Fisheries and Aquatic Sciences, 56(10): 1 929-1 937.
DOI:10.1139/f99-131 |
Jeffrey S W, Hallegraeff G M. 1980. Studies of phytoplankton species and photosynthetic pigments in a warm core eddy of the East Australian Current. I. Summer population. Marine Ecology Progress Series, 3: 285-294.
DOI:10.3354/meps003285 |
Jeffrey S W, Hallegraeff G M. 1987. Phytoplankton pigments, species and light climate in a complex warm-core eddy of the East Australian Current. Deep-Sea Research Part A. Oceanographic Research Papers, 34(5-6): 649-673.
DOI:10.1016/0198-0149(87)90029-X |
Jeffrey S W. 1976. A report of green algal pigments in the central North Pacific Ocean. Marine Biology, 37(1): 33-37.
DOI:10.1007/BF00386776 |
Kerndorff H, Schnitzer M. 1980. Sorption of metals on humic acid. Geochimica et Cosmochimica Acta, 44(11): 1 701-1 708.
DOI:10.1016/0016-7037(80)90221-5 |
Koh C H, Shin H C. 1990. Growth and size distribution of some large brown algae in Ohori, east coast of Korea. Hydrobiologia, 204(1): 225-231.
DOI:10.1007/BF00040238 |
Kosakowska A, Lewandowska J, Stoń J, Burkiewicz K. 2004. Qualitative and quantitative composition of pigments in Phaeodactylum tricornutum (Bacillariophyceae) stressed by iron. BioMetals, 17(1): 45-52.
DOI:10.1023/A:1024452802005 |
Kuhn K M, Maurice P A, Neubauer E, Hofmann T, von der Kammer F. 2014. Accessibility of humic-associated Fe to a microbial siderophore: implications for bioavailability. Environmental Science & Technology, 48(2): 1 015-1 022.
DOI:10.1021/es404186v |
Li H J, Murphy T, Guo J, Parr T, Nalewajko C. 2009. Iron-stimulated growth and microcystin production of Microcystis novacekii UAM 250. Limnologica, 39(3): 255-259.
DOI:10.1016/j.limno.2008.08.002 |
Llewellyn C A, Fishwick J R, Blackford J C. 2005. Phytoplankton community assemblage in the English Channel: a comparison using chlorophyll a derived from HPLC-CHEMTAX and carbon derived from microscopy cell counts. Journal of Plankton Research, 27(1): 103-119.
DOI:10.1093/plankt/fbh158 |
Lürling M, Roessink I. 2006. On the way to cyanobacterial blooms: impact of the herbicide metribuzin on the competition between a green alga (Scenedesmus) and a cyanobacterium (Microcystis). Chemosphere, 65(4): 618-626.
DOI:10.1016/j.chemosphere.2006.01.073 |
Lyck S, Gjølme N, Utkilen H. 1996. Iron starvation increases toxicity of Microcystis aeruginosa CYA 228/1 (Chroococcales, Cyanophyceae). Phycologia, 35(S6): 120-124.
DOI:10.2216/i0031-8884-35-6S-120.1 |
Mackey D J, Higgins H W, Mackey M D, Holdsworth D. 1998. Algal class abundances in the western equatorial Pacific: estimation from HPLC measurements of chloroplast pigments using CHEMTAX. Deep-Sea Research Part Ⅰ: Oceanographic Research Papers, 45(9): 1 441-1 468.
DOI:10.1016/S0967-0637(98)00025-9 |
Medrano E A, Uittenbogaard R E, Pires L M D, Van De Wiel B J H, Clercx H J H. 2013. Coupling hydrodynamics and buoyancy regulation in Microcystis aeruginosa for its vertical distribution in lakes. Ecological Modelling, 248: 41-56.
DOI:10.1016/j.ecolmodel.2012.08.029 |
Meneely J P, Elliott C T. 2013. Microcystins: measuring human exposure and the impact on human health. Biomarkers, 18(8): 639-649.
DOI:10.3109/1354750X.2013.841756 |
Millie D F, Paerl H W, Hurley J P. 1993. Microalgal pigment assessments using high-performance liquid chromatography: a synopsis of organismal and ecological applications. Canadian Journal of Fisheries and Aquatic Sciences, 50(11): 2 513-2 527.
DOI:10.1139/f93-275 |
Murphy T P, Lean D R, Nalewajko C. 1976. Blue-green algae: their excretion of iron-selective chelators enables them to dominate other algae. Science, 192(4242): 900-902.
DOI:10.1126/science.818707 |
Nagai T, Imai A, Matsushige K, Fukushima T. 2007. Growth characteristics and growth modeling of Microcystis aeruginosa and Planktothrix agardhii under iron limitation. Limnology, 8(3): 261-270.
DOI:10.1007/s10201-007-0217-1 |
Nielsen S L. 2006. Size-dependent growth rates in eukaryotic and prokaryotic algae exemplified by green algae and cyanobacteria: comparisons between unicells and colonial growth forms. Journal of Plankton Research, 28(5): 489-498.
DOI:10.1093/plankt/fbi134 |
Rodriguez F, Varela M, Zapata M. 2002. Phytoplankton assemblages in the Gerlache and Bransfield Straits (Antarctic Peninsula) determined by light microscopy and CHEMTAX analysis of HPLC pigment data. Deep Sea Research Part Ⅱ: Topical Studies in Oceanography, 49(4-5): 723-747.
DOI:10.1016/S0967-0645(01)00121-7 |
Rueler J G, Ades D R. 1987. The role of iron nutrition in photosynthesis and nitrogen assimilation in Scenedesmus quadricauda (Chlorophyceae). Journal of Phycology, 23(3): 452-457.
DOI:10.1111/j.1529-8817.1987.tb02531.x |
Schlesinger D A, Molot L A, Shuter B J. 1981. Specific growth rates of freshwater algae in relation to cell size and light intensity. Canadian Journal of Fisheries and Aquatic Sciences, 38(9): 1 052-1 058.
DOI:10.1139/f81-145 |
Shen H, Niu Y, Xie P, Tao M, Yang X. 2011. Morphological and physiological changes in Microcystis aeruginosa as a result of interactions with heterotrophic bacteria. Freshwater Biology, 56(6): 1 065-1 080.
DOI:10.1111/j.1365-2427.2010.02551.x |
Song K S, Shang Y X, Wen Z D, Jacinthe P A, Liu G, Lyu L, Fang C. 2019. Characterization of CDOM in saline and freshwater lakes across China using spectroscopic analysis. Water Research, 150: 403-417.
DOI:10.1016/j.watres.2018.12.004 |
Sun B K, Tanji Y, Unno H. 2005. Influences of iron and humic acid on the growth of the cyanobacterium Anabaena circinalis. Biochemical Engineering Journal, 24(3): 195-201.
DOI:10.1016/j.bej.2005.02.014 |
Trainor F R. 1998. Biological aspects of Scenedesmus (Chlorophyceae)-phenotypic plasticity. In: Nova Hedwigia: Beihefte 117. Berlin: J. Cramer.
|
Verstreate D R, Storch T A, Dunham V L. 1980. A comparison of the influence of iron on the growth and nitrate metabolism of Anabaena and Scenedesmus. Physiologia Plantarum, 50(1): 47-51.
DOI:10.1111/j.1399-3054.1980.tb02682.x |
Volterra V. 1926. Fluctuations in the abundance of a species considered mathematically. Nature, 118(2972): 558-560.
DOI:10.1038/118558a0 |
Wang Y W, Wu M, Yu J, Zhang J J, Zhang R F, Zhang L, Chen G X. 2014. Differences in growth, pigment composition and photosynthetic rates of two phenotypes Microcystis aeruginosa strains under high and low iron conditions. Biochemical Systematics and Ecology, 55: 112-117.
DOI:10.1016/j.bse.2014.02.019 |
Wilhelm C, Rudolph I, Renner W. 1991. A quantitative method based on HPLC-aided pigment analysis to monitor structure and dynamics of the phytoplankton assemblage-a study from Lake Meerfelder Maar (Eifel, Germany). Archiv Fur Hydrobiologie, 123(1): 21-35.
|
Wright S W, Thomas D P, Marchant H J, Higgins H W, Mackey M D, Mackey D J. 1996. Analysis of phytoplankton of the Australian sector of the Southern Ocean: comparisons of microscopy and size frequency data with interpretations of pigment HPLC data using the 'CHEMTAX' matrix factorisation program. Marine Ecology Progress Series, 144: 285-298.
DOI:10.3354/meps144285 |
Xie L Q, Xie P, Li S X, Tang H J, Liu H. 2003. The low TN: TP ratio, a cause or a result of Microcystis blooms?. Water Research, 37(9): 2 073-2 080.
DOI:10.1016/S0043-1354(02)00532-8 |
Xing W, Huang W M, Li D H, Liu Y D. 2007. Effects of iron on growth, pigment content, photosystem II efficiency, and siderophores production of Microcystis aeruginosa and Microcystis wesenbergii. Current Microbiology, 55(2): 94-98.
DOI:10.1007/s00284-006-0470-2 |
Xu H, Zhu G W, Qin B Q, Paerl H W. 2013. Growth response of Microcystis spp. to iron enrichment in different regions of Lake Taihu, China. Hydrobiologia, 700(1): 187-202.
DOI:10.1007/s10750-012-1229-3 |
Yu G Y, Zhang X H, Liang X M, Xu X Q. 2000. Biogeochemical characteristics of metal elements in water-plant system of lake Dianchi. Acta Hydrobiologica Sinica, 24(2): 172-177, http://dx.chinadoi.cn/10.3321/j.issn:1000-3207.2000.02.012. (in Chinese with English abstract)
|
Zhang P, Zhai C M, Wang X X, Liu C H, Jiang J H, Xue Y R. 2013. Growth competition between Microcystis aeruginosa and Quadrigula chodatii under controlled conditions. Journal of Applied Phycology, 25(2): 555-565.
DOI:10.1007/s10811-012-9890-5 |
Zhang Z P, Zhu G W, Sun X J, Chi Q Q. 2008. Seasonal variation of colloidal trace-metal concentration in Lake Taihu water body. China Environmental Science, 28(6): 556-560.
(in Chinese with English abstract) |
Zhou T, Wang Z H, Hu Q, Liu L F, Luo K S. 2016. Effects of Fe2+ and Fe3+ on algal proliferation in a natural mixed algal colony in algae-rich raw water in Southern China. Journal of Residuals Science & Technology, 13(1): 15-22.
DOI:10.12783/issn.1544-8053/13/1/3 |
Zhu W, Chen H M, Guo L L, Li M. 2016. Effects of linear alkylbenzene sulfonate (LAS) on the interspecific competition between Microcystis and Scenedesmus. Environmental Science and Pollution Research, 23(16): 16 194-16 200.
DOI:10.1007/s11356-016-6809-8 |