 2021, Vol. 39
Institute of Oceanology, Chinese Academy of Sciences
Article Information
- YUE Jiaqi, NOMAN Md Abu, SUN Jun
- Kuroshio intrusion drives the Trichodesmium assemblage and shapes the phytoplankton community during spring in the East China Sea
- Journal of Oceanology and Limnology, 39(2): 536-549
- http://dx.doi.org/10.1007/s00343-020-9344-x
Article History
- Received Dec. 29, 2019
- accepted in principle Mar. 9, 2020
- accepted for publication Apr. 27, 2020


2 Research Centre for Indian Ocean Ecosystem, Tianjin University of Science and Technology, Tianjin 300457, China
The East China Sea (ECS) is the largest marginal sea in the western Pacific, and is bordered by the coast of China to the west and the Korean Peninsula and Japan to the east (Guo et al., 2014; Jiang et al., 2018). The ECS coastal area is subject to complex hydrodynamic processes including Changjiang (Yangtze) River discharge and Kuroshio water intrusion (Zhou et al., 2019). Abundant discharge of Changjiang River carries a huge amount of freshwater and land-based material (Li et al., 2014a), hence forms an intensive coastal water plume. The Changjiang diluted waters (CDW) are rich in nutrients especially inorganic nitrogen and silicate, and primarily determine the P/N ratios in the coastal water plume (Wang et al., 2003; Gao and Wang, 2008; Zhang et al., 2008). Because of this massive nutrient export, severe eutrophication occurs in the coastal river plume areas (Chai et al., 2006; Wang, 2006; Zhu et al., 2014), which lead to frequent algal blooms by stimulating phytoplankton growth (Li et al., 2014a). Additional to the CDW, The Kuroshio, a western boundary current, originates from the North Equatorial Current and flows into the East China Sea (ECS) (Jiang et al., 2019). The nearshore and offshore Kuroshio branch currents strongly intrude onto the inner and outer ECS shelf, respectively (Yang et al., 2012). The Taiwan Warm Current (TWC), a combination of Taiwan Strait water and Kuroshio intrusion, flows northward in the ECS to the Changjiang River estuary (Zhou et al., 2015; Jiang et al., 2019). It is evident that the Kuroshio intrusion determines and forms the TWC (Yang et al., 2011, 2012), and the bottom water of the TWC originates from the Kuroshio subsurface water (Yang et al., 2012, 2018; Zhang et al., 2014). The subsurface waters of Kuroshio are phosphate rich and possess high P/N ratios (Zhang et al., 2007). Hence, upwelling of this subsurface Kuroshio water supplies external phosphate, which is critical for phytoplankton growth, to the coastal area (Tseng et al., 2014).
Trichodesmium, a diazotrophic cyanobacterium, widely distributed in tropical and subtropical oligotrophic ocean, reaches especially high cell abundance in western boundary currents, such as the Gulf Stream and the Kuroshio, and in some marginal seas (Capone et al., 1997; Jiang et al., 2018). Trichodesmium are the major primary producers and contributors of N2 fixation in these waters at high temperature (20 ℃) (LaRoche and Breitbarth, 2005). Trichodesmium plays a fundamental role in carbon and nitrogen biogeochemical cycles (Capone et al., 1997; Hutchins et al., 2015; Jiang et al., 2017), produces biological carbon through relieving nitrogen limitation, and enhances the efficiency of the biological carbon pump in the ocean (Falkowski, 1997; Hutchins et al., 2015). Numerous studies reported the high abundance and frequent blooms of Trichodesmium in the ECS and Kuroshio territories during the warm period (Chang et al., 2000; Ding, 2009; Shiozaki et al., 2010; Chen et al., 2014; Zhang et al., 2014). Among them, some studies explained the reasons behind the high abundance of Trichodesmium in the Kuroshio of oligotrophic western and central Pacific Ocean (Shiozaki et al., 2015), and how Kuroshio waters shape the species composition of diazotrophic Trichodesmium (Jiang et al., 2019). Some other studies reported the distribution patterns and seasonal changes of Trichodesmium in the ECS (Jiang et al., 2017, 2018), however there is no clear observation available on hydrodynamic or physicochemical factors governing Trichodesmium assemblages and dominance of phytoplankton community by Trichodesmium rather than diatoms or dinoflagellates in the ECS coastal area.
Therefore, we studied the phytoplankton community and the physicochemical features in the ECS, to observe the influence of Kuroshio intrusion on the phytoplankton community and the physicochemical factors shaping the phytoplankton assemblages in this area.
2 MATERIAL AND METHOD 2.1 Study siteThe present study was conducted during the spring of 2017 (May 15–May 28) in the East China Sea (ECS, 25°N–32°N, 120°E–127°E). A total of 130 samples were collected from 27 stations shown in Fig. 1. All the stations were assigned to five different transects (A to E) from the Changjiang River mouth to the Taiwan Strait to observe the influence of different water masses.

|
| Fig.1 The sampling stations along five different transects (left) and water currents pattern of the study area (right) CDW: Changjiang Diluted Waters; ZFCC: Zhejiang-Fujian Coastal Currents; TWC: Taiwan Water Currents; NKBC: Nearshore Kuroshio Branch Current; KBCNT: Kuroshio Branch Current northeast of Taiwan, China. |
From surface to 100-m depth, samples from 3 to 6 different layers were collected based on the bottom depth by a Seabird Conductivity, Temperature, Depth detector (CTD) (SBE 9/11 plus) equipped with 12-L Go-Flo bottles. Physical properties like, water depth, temperature, salinity, and density were also recorded by CTD sensor. Seawater samples (250 mL) were collected and filtered through 0.45-µm cellulose acetate membrane filters for nutrient analysis. After filtering 100 mL of seawater through GF/F filters (Whatman, 25 mm), the samples were stored in -20 ℃ for the chlorophyll-a (chl-a) analysis. For phytoplankton enumeration, 1 L of seawater samples were collected and fixed with formaldehyde 1% solution (final concentration) and transferred to the laboratory.
Nutrient concentrations (Nitrate, Nitrite, Ammonium, Phosphate, and Silicate) were analyzed through a Technicon AA3 Auto-Analyzer (Bran+Luebbe) in our laboratory. Dissolved inorganic nitrogen (DIN) includes the nitrate, nitrite and ammonium concentrations; N/P and P/N were calculated using DIN and dissolved inorganic phosphate (DIP) concentrations; P/Si/N was calculated as DIP/Silicate/DIN. For analyzing chl a, the GF/F filters were kept in dark for 24 h in 90% acetone (4–5 mL) at 4 ℃ for the chl-a extraction, and then analyzed using a fluorometer (Welschmeyer, 1994). For phytoplankton enumeration in the laboratory, water samples were concentrated using 100-mL settling columns for 24 h. Later on, the phytoplankton cells (cell size > 5 µm) were identified and counted under an inverted microscope (Motic AE 2000, Xiamen, China) at 200× or 400× magnification following the modified procedure of the Utermöhl method (Sun et al., 2002).
2.3 Data analysisThe dominance of phytoplankton was calculated by the dominance index (Y) (Sun et al., 2003):

where ni is the abundance of cells of type i; N is the total abundance of phytoplankton cells in the samples collected in this survey; the frequency of the ith species in each sample is denoted as fi.
The graphical representation of physicochemical parameters and phytoplankton abundance distributions were represented by Ocean Data View (Version 4.6.7). The box-whisker plot and Pearson correlation analysis were analyzed by R studio (Version 1.1.453). Bray-Curtis similarity-based hierarchical cluster analysis was carried out by Primer (version 6). Redundancy analysis (RDA) was conducted using multivariate analyzing software CANOCO (version 4.5) to show the relationship between phytoplankton species and physicochemical parameters
3 RESULT 3.1 Hydrography of the study areaThe temperature during the study varied between 14.7 ℃ and 31.9 ℃, with an average of 21.9 ℃. The salinity ranged from 21.3 to 34.62, and gradually increased from nearshore to the open ocean due to the influence of diluted waters along the coast. Four different types of water masses have been identified according to T-S scatter plot (Fig. 2). Coastal Waters (CW) were mainly influenced by Changjiang River diluted waters (CDW) bearing low salinity and high chl-a concentration (Fig. 3). The chl-a concentration showed the opposite trend of the salinity gradient and decreased towards the offshore. The Kuroshio Waters (KW), which were the most saline and had a wide range of temperature, consist of Kuroshio nearshore water and the Kuroshio subsurface water. The Taiwan Warm Current (TWC) consisted of high temperature and salinity waters, which were mainly fed by Kuroshio subsurface water from the bottom, and flowed in the surface from the north-east of Taiwan, China, to the southern part. Combination of all these waters created Shelf Mixed Waters (SMW), which possesses similar salinity with TWC but lower temperature.

|
| Fig.2 Temperature-salinity (T-S) scatter plot showing the water masses distribution in the study area SMW: Shelf Mixed Water; KW: Kuroshio Water; TWC: Taiwan Warm Current; CW: Coastal Water. |

|
| Fig.3 Surface distribution of temperature (℃) (a), salinity (b), and chl-a (µg/L) concentrations (c) in the study area; distribution of different water masses in different layer 0–10 m (d); 20–30 m (e); 50–100 m (f) Dashed-line separates the water masses among the stations. |
In the surface, inorganic nitrate and nitrite concentrations were higher in inshore areas whereas the ammonium concentrations were higher offshore. Similarly, the silicate concentrations were also higher in the nearshore stations. However, the phosphate concentrations were higher in the mid-shelf region and increased from north to southward along the direction of TWC (Fig. 4). The nutrient concentrations in the surface water depicted that the influence of CW was lower during the study period as very few stations of the nearshore area showed higher nutrient concentrations, particularly the average concentrations of ammonium, nitrate, and silicate were 2.42, 4.37, and 4.51 µmol/L, respectively in the CW.

|
| Fig.4 Surface distribution of physicochemical and biological parameters of the study area |
Vertically the accumulated DIN concentrations did not show much variability. Among the DIN, the nitrate concentrations increased vertically after 20 m, nitrite remained the same, and the ammonium concentrations decreased from the surface layer to deeper ocean. However, the concentrations of phosphate and silicate increased significantly after 20-m depth. The nutrient ratios, especially P/N and Si/N also increased after 20 m, and reached the maximum at 70-m depth. Temperature decreased from the surface to the deep ocean, whereas salinity showed the reverse trend, especially after 20 m, salinity showed an increasing trend downwards (Fig. 5).

|
| Fig.5 Vertical distribution of physicochemical parameters of the study area |
Because of the high abundance of dominant cyanobacteria along the transect B, we considered this transect as the representative of all transects for the further sectional analysis. The section distribution of transect B depicted that the CW influence was lower in this transect as only the surface area of the nearshore stations possessed the characteristics of CW. Besides, the high salinity phosphate-rich water in the bottom layer shows the emergence of KW during the study period (Fig. 6).

|
| Fig.6 Section distribution of physicochemical and biological parameters of transect B Salinity is shown as the contour line with the temperature. Station names are given on top of the x-axis. |
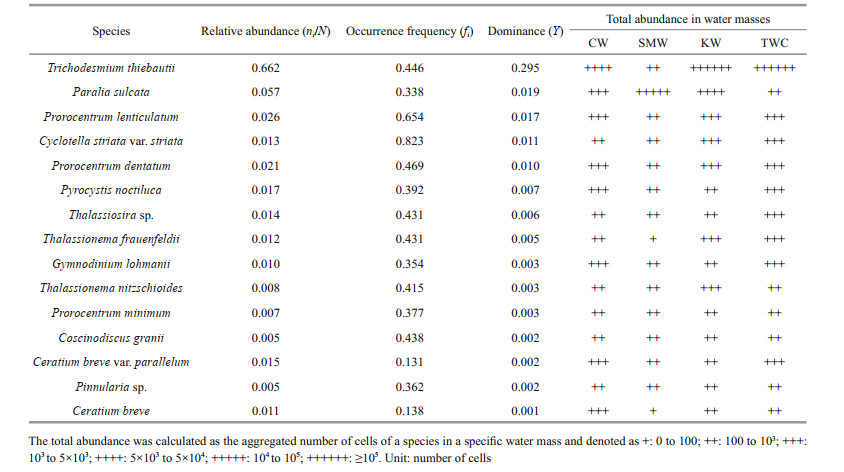
A total of 158 species from 58 genera of 4 phyla were identified in the survey area. Among them, 62 species of 34 genera of diatoms were identified, which accounted for 39.2% of the total species. Besides, 93 species of dinoflagellates from 22 genera (accounting for 58.9% of the total species), 1 species of Cyanophyta and 2 species of Chrysophyta were also identified. The total cell abundance of phytoplankton ranged from 60 cells/L to 11.77×10³ cells/L with an average cell abundance of 2.973×10³ cells/L. In surface, the maximum cell abundance of phytoplankton was found at station S02-5 (8.69×10³ cells/L), and the minimum cell abundance was enumerated at S01-2 (0.35×10³ cells/L). Horizontally, the maximum cell abundance of phytoplankton was observed in the mid-shelf region rather than the coastal area. In surface, phytoplankton cell abundance showed a distribution pattern similar to that of phosphate, which depicts that phosphate might have aided phytoplankton assemblages in the surface. Cyanobacteria were the most dominant group throughout the study area comprising 66.17% of the total cell abundance (Table 1) with an average abundance of 1.967×10³ cells/L. Diatoms had the maximum cell abundance in the offshore area whereas dinoflagellates had maximum cell abundance in the coastal area and the offshore of transect D. Though cyanobacteria dominated the whole study area, the highest abundance was observed in the mid-shelf area along the transect B particularly at station S02-05. At the surface layer of this station, the Trichodesmium cell abundance was 7.7×10³ cells/L and the maximum cell abundance found at 70-m depth (8.8×10³ cells/L).
|
Vertically the abundance of diatoms did not show significant changes. Dinoflagellate abundance was maximum at the surface layer and decreased with the water depth. The abundance of Cyanobacteria was maximum at 70-m depth, whereas at the surface it was lowest, and increased in the subsurface layer from 20- to 50-m depth. The total cell abundance of phytoplankton showed the maximum abundance at 70 m because of cyanobacterial high abundance, secondly in the surface because of the high cell abundance of dinoflagellates (Fig. 7).

|
| Fig.7 Vertical distribution of phytoplankton abundance in the study area |
Among the dominant species, Trichodesmium thiebautii had the maximum total abundance in the KW (1.3×10⁵ cells) and TWC (1.12×10⁵ cells), relatively low abundance in CW (6.3×10³ cells) and lowest total abundance in SMW (780 cells). Most of the dominant dinoflagellates species such as Prorocentrum lenticulatum, Prorocentrum dentatum, Gymnodinium lohmanii, Pyrocystis noctiluca, and Ceratium breve were abundant in CW and the TWC, but lower in SMW and KW. However, the abundance of diatoms such as Thalassiosira sp., Thalassionema frauenfeldii, Thalassionema nitzschioides, Coscinodiscus granii, and Pinnularia sp. was lower in the CW (< 103 cells), whereas some species e.g. Cyclotella striata, Thalassiosira sp., and Thalassionema frauenfeldii had relatively higher cell abundance in TWC.
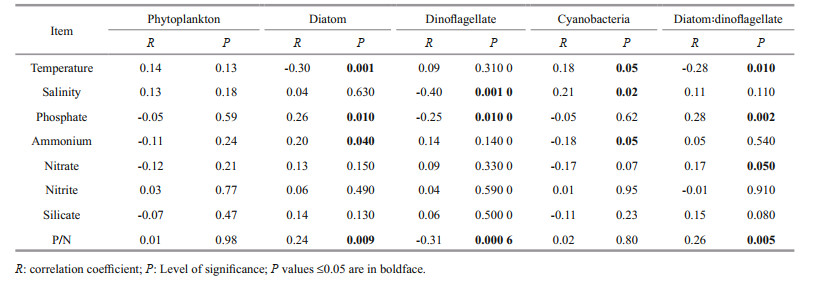
3.4 Factors driving phytoplankton communityNo definite factor was responsible for the whole phytoplankton assemblages and different groups were influenced by different factors. Diatoms showed a significantly negative correlation with temperature, and positive correlation with phosphate and P/N (Table 2), which depicts that CW water mainly shapes the diatom abundance in this area. Similar to diatoms, dinoflagellate abundance was also higher in CW (Fig. 8), though dinoflagellates showed an inverse relationship with salinity, phosphate, and P/N. The significant positive correlation of temperature and salinity with cyanobacteria showed the influence of TWC and KW in cyanobacterial assemblages. Besides, the cyanobacterial abundance was also higher in KW and TWC where the DIP concentrations and P/N ratios were higher. Similarly, the sectional distribution also showed that the cyanobacterial abundance was maximum at the deep ocean and coincided well with the DIP concentrations (Fig. 6).

|
| Fig.8 Distribution of physicochemical and biological parameters in different water masses Circles indicate the outliers. |
The cluster and RDA plot showed distinct groups of species composition in different water masses. According to hierarchical cluster dendrogram, two major clusters comprised most of the samples of KW and TWC (C1 & C2 in Fig. 9), which revealed that the TWC and KW waters mostly shaped the species composition during the study period. Cluster 1 (C1 in Fig. 9) showed that most of the samples of KW and TWC grouped as they comprised high similarity of species composition. In Cluster 2 (C2 in Fig. 9), some samples of SMW grouped with KW, which revealed the mixing of KW and formation of SMW, therefore maintained similar species composition.

|
| Fig.9 Bray Curtis similarity-based cluster analysis showing the grouping of phytoplankton in different water masses |
Like cluster analysis, the sample scatter plot of RDA analysis also showed a distinct grouping of water masses concerning environmental parameters and species composition (Fig. 10). The CW and SMW showed a positive relation with nitrate and ammonium respectively, and a negative relationship with both temperature and salinity, whereas, the KW and TWC had an inverse relationship with temperature, salinity, and nutrients. According to RDA, temperature and salinity (P < 0.01) were the major factors shaping the species composition in this area. Therefore, the Trichodesmium thiebautii had strong positive relationship with temperature and salinity, whereas negative relationship with nitrate and ammonium. Besides, most of the diatom species such as Paralia sulcata and Pinnularia sp. showed positive relationship with phosphate and P/N ratios. However, all the dinoflagellates showed strong negative relationship with phosphate and P/N (Fig. 10).

|
| Fig.10 RDA analysis between physio-chemical parameters and dominant species RDA triplot (left); samples scatter plot (right). Tt: Trichodesmium thiebaultii; Tn: Thalassionema nitzschioides; Tf: Thalassionema frauenfeldii; Ts: Thalassiosira sp.; Pi: Pinnularia sp.; Cvs: Ceratium breve var. parallelum; Ps: Paralia sulcata; Pl: Prorocentrum lenticulatum; Pd: Prorocentrum dentatum; Pn: Pyrocystis noctiluca; Gl: Gymnodinium lohmanii; Pm: Prorocentrum minimum; Cg: Coscinodiscus granii; Cv: Ceratium breve; Cs: Cyclotella striata. |
The ECS is influenced by both CDW and KW. Freshwater discharge of Changjiang River influenced the coastal area adjacent to the estuary. Therefore, the low salinity coastal waters contain high concentrations of chl a (Wang et al., 2019). Besides, the KW feed the TWC and disperse throughout the coastal areas to the Changjiang River Estuary in late spring to early summer (Yang et al., 2013; Li et al., 2014b; Zhao et al., 2019). Both of these major hydrodynamic processes influence the hydrological and chemical parameters of this area, which affect the dynamics of algal blooms and make this area high-risk region for algal bloom (Zhou et al., 2019).
Previous studies revealed that diatom blooms occur in the ECS area in early summer because of the nutrient-rich freshwater intrusion of Changjiang River, which makes a strong pycnocline near around 20 m (Zhou et al., 2019). However, at the late stage of the diatom bloom, high nutrient absorption by diatoms and restriction of vertical mixing by pycnocline decreased nutrient concentration and P/N ratios in the surface. Therefore, the diatom growth declined and dinoflagellates got a space to proliferate. Later on, the intrusion of phosphate-rich KW through upwelling weakens the pycnocline and intensifies the growth of dinoflagellates (Zhou et al., 2017a, 2019). Through the alkaline phosphatase activities, bloom-forming dinoflagellates utilize organic forms of phosphorus and form the bloom (Smayda and Reynolds, 2003; Ou et al., 2008). However, in our study, the dominance of CW was lower and there was no evidence of upwelling. Because, though the KW emerges into the coastal area near to Changjiang River estuary in April (Yang et al., 2011), it cannot upwell until early summer as the prevailing wind and currents are not favorable for upwelling formation (Wang and Wang, 2007; Shi et al., 2014). In this study, higher concentrations of phosphate in the bottom layer of transect B and the KW showed the evidence of Kuroshio intrusion in the bottom layer, but not upwelled to the surface layer (Fig. 6). But there might be some vertical mixing of water because of weak upwelling in the spring, which can raise water up to the 10 m from the lower layer (Wang and Wang, 2007), and led to the maximum concentrations of DIP in SMW (Fig. 8). Therefore, we hypothesize that our study period was the middle of these two conditions when the diatom growth declined due to phosphorus limitation and low P/N ratios (Zhou et al., 2017b), but the dinoflagellate bloom not yet formed as the strong upwelling not started to bring phosphate-rich water into the surface to intensify the growth of dinoflagellates. As a result, it left an open niche for the proliferation of Trichodesmium. Therefore, Trichodesmium dominance occurred throughout the study area comprising about 66% of the total abundance and the maximum abundance was in phosphate-rich KW and TWC. The highest abundance of Trichodesmium occurred at stations S02-03 and S02-05 of transect B. The cluster and RDA plot showed that The KW and TWC made the distinct cluster of species composition and comprised most of the samples.
High abundances of Trichodesmium are encountered in the western boundary currents (the Gulf Stream, Kuroshio), the tropical portions of the central gyres and the stable water column of some marginal seas (Capone et al., 1997). Generally, these areas are characterized by low nutrients, and Trichodesmium possess some unique characteristics to adapt in these environments. Because of the diazotrophic characteristic, Trichodesmium growth is limited by the availability of non-N nutrients, especially Fe and P (Paerl et al., 1994; Mills et al., 2004; Moore et al., 2009). Therefore, though the DIN was lower in KW and TWC, the Trichodesmium abundance was maximum because of the high amount of P. Besides, to overcome P limitation, Trichodesmium migrates vertically to scavenge P (Bergman et al., 2013), which resulted the maximum abundance at 70-m depth. In the upper layer, the Trichodesmium colonies capture nitrogen and carbon (Romans et al., 1994), and sink into the deeper ocean where they acquire P species (Romans et al., 1994; Villareal and Carpenter, 2003; Hewson et al., 2009). These findings are also supported by resource competition theory (Tilman, 1977), and the recent studies on phytoplankton interannual changes in this area (do Rosario Gomes et al., 2018; Xu et al., 2019), which observed that predominance of diatoms in the surface waters when the DIP concentration was high, and predominance of cyanobacteria and chlorophytes at low DIP concentrations.
However, the RDA analysis showed a strong relationship with temperature but no relationship with phosphate, though the abundance was higher in phosphate-rich KW and TWC (Fig. 10). Because temperature plays a significant role in the growth and N2 fixation of Trichodesmium, Trichodesmium is roughly limited in water warmer than 20 ℃ and for the growth and nitrogen fixation the temperature ranges from 20 ℃ to 34 ℃ (Breitbarth et al., 2007; Chappell and Webb, 2010). In this study, the average temperature of SMW was lower than 18 ℃ (Fig. 8), and it was reported that SMW is colder than TWC by about 5 ℃ on an average (Qu et al., 2018). Therefore, though the phosphate-rich KW and TWC aided the Trichodesmium, phosphate-rich SMW couldn't help as the temperature was low. It reveals that only phosphate or other nutrients are not enough to let Trichodesmium proliferate if the temperature is not optimal.
Moreover, dinoflagellates comprised the maximum number of species in the species composition and dominant species list while diatoms contributed much less (Table 1). Diatoms and dinoflagellates showed an inverse relationship with physicochemical parameters. These results indicated the community shift in this area during the study period. This area especially the CDW is believed to be DIP limited due to the rapid consumption of DIP by the phytoplankton bloom (Wang and Wang, 2007; Chen, 2008), which led to phosphorus stress on diatoms and decreased their abundance (Zhou et al., 2017b). Hence, the lower abundance of diatoms, negative correlation with temperature, and positive correlation with DIP and P/N depict that diatom abundance decreased because of phosphorus stress (Zhou et al., 2017a, 2019). Consequently, the dinoflagellates started proliferating in the CW in the surface (Zhou et al., 2019) utilizing the remaining phosphate and nitrate. As the ECS water column is stratified during this period (Guo et al., 2014), dinoflagellates can regulate their position in the water column because of having flagella, which favours their growth by ignoring sinking and availing to the acquisition of nutrient from the deep ocean (Estrada and Berdalet, 1997). Therefore, in the Changjiang estuary, high concentrations of dinoflagellates are observed in the stratified CDW during spring to summer (Guo et al., 2014; Xu et al., 2019). However, as we hypothesized, the intrusion of Kuroshio water was less significant in the surface area because of a strong pycnocline around 20 m (Zhou et al., 2019), which restricts vertical mixing and addition of phosphate in the surface layer of the coastal area from the bottom. Therefore, the dinoflagellate species showed negative relationship with phosphate and P/N. All these evidences and the dominant species list suggested that the dinoflagellates will dominate the area when the summer monsoon leads to strong upwelling (Wang and Wang, 2007; Wu, 2015) and phosphate-rich KW intensifies through vertical mixing (Yang et al., 2018).
5 CONCLUSIONIn spring, the ECS coast was dominated by KW and TWC rather than CDW. Consistent with the previous studies, diatom abundance was limited during the study period due to phosphate limitation. Dinoflagellates comprised the maximum number of species during the study period, but their abundance was low because the upwelling of KW to the surface had not started. Because of some special characteristics different from diatoms and dinoflagellates, Trichodesmium could proliferate and reached high abundance. The phosphate-rich KW and TWC promoted Trichodesmium growth. Beside phosphate, Trichodesmium abundance depended largely on seawater temperature and P/N ratios. Nonetheless, annual observations are needed focusing on Trichodesmium, hydrology and physicochemical parameters of this area to comprehensively clarify the factors influencing the phytoplankton assemblages throughout the year.
6 DATA AVAILABILITY STATEMENTThe datasets generated and/or analyzed during the current study are available from the corresponding author on reasonable request.
7 ACKNOWLEDGMENTData and samples were collected onboard of R/V Xiangyanghong 18 implementing the open research cruise NORC2017-02 supported by NSFC Shiptime Sharing Project (project number: 41649902), We thank Mr. Gang QIAN for collecting phytoplankton water samples, and the two anonymous reviewers for their comments on improving this manuscript.
Bergman B, Sandh G, Lin S J, Larsson J, Carpenter E J. 2013. Trichodesmium a widespread marine cyanobacterium with unusual nitrogen fixation properties. FEMS Microbiology Reviews, 37(3): 286-302.
DOI:10.1111/j.1574-6976.2012.00352.x |
Breitbarth E, Oschlies A, LaRoche J. 2007. Physiological constraints on the global distribution of Trichodesmium-effect of temperature on diazotrophy. Biogeosciences, 4(1): 53-61.
DOI:10.5194/bg-4-53-2007 |
Capone D G, Zehr J P, Paerl H W, Bergman B, Carpenter E J. 1997. Trichodesmium, a globally significant marine cyanobacterium. Science, 276(5316): 1 221-1 229.
DOI:10.1126/science.276.5316.1221 |
Chai C, Yu Z M, Song X X, Cao X H. 2006. The status and characteristics of eutrophication in the Yangtze River (Changjiang) estuary and the adjacent East China Sea, China. Hydrobiologia, 563(1): 313-328.
DOI:10.1007/s10750-006-0021-7 |
Chang J, Chiang K P, Gong G C. 2000. Seasonal variation and cross-shelf distribution of the nitrogen-fixing cyanobacterium, Trichodesmium, in southern East China Sea. Continental Shelf Research, 20(4-5): 479-492.
DOI:10.1016/S0278-4343(99)00082-5 |
Chappell P D, Webb E A. 2010. A molecular assessment of the iron stress response in the two phylogenetic clades of Trichodesmium. Environmental Microbiology, 12(1): 13-27.
DOI:10.1111/j.1462-2920.2009.02026.x |
Chen C T A. 2008. Distributions of nutrients in the East China Sea and the South China Sea connection. Journal of Oceanography, 64(5): 737-751.
DOI:10.1007/s10872-008-0062-9 |
Chen C T A, Chen H Y, Lin Y H, Yong T C, Taniuchi Y, Tuo S H. 2014. The relative contributions of unicellular and filamentous diazotrophs to N2 fixation in the South China Sea and the upstream Kuroshion. Deep Sea Research Part I: Oceanographic Research Papers, 85: 56-71.
DOI:10.1016/j.dsr.2013.11.006 |
Ding C L. 2009. The Abundance, the Spatial and Temporal Distributions of Cyanobacteria in the Yellow Sea, the East China Sea and the South China Sea. Ocean University of China, Qingdao. (in Chinese with English abstract)
|
do Rosario Gomes H, Xu Q, Ishizaka J, Carpenter E J, Yager P L, Goes J I. 2018. The influence of riverine nutrients in niche partitioning of phytoplankton communities–a contrast between the Amazon River plume and the Changjiang (Yangtze) River diluted water of the East China Sea. Frontiers in Marine Science, 5: 343.
DOI:10.3389/fmars.2018.00343 |
Estrada M, Berdalet E. 1997. Phytoplankton in a turbulent world. Scientia Marina, 61(S1): 125-140.
|
Falkowski P G. 1997. Evolution of the nitrogen cycle and its influence on the biological sequestration of CO2 in the ocean. Nature, 387(6630): 272-275.
DOI:10.1038/387272a0 |
Gao S, Wang Y P. 2008. Changes in material fluxes from the Changjiang River and their implications on the adjoining continental shelf ecosystem. Continental Shelf Research, 28(12): 1 490-1 500.
DOI:10.1016/j.csr.2007.02.010 |
Guo S J, Feng Y Y, Wang L, Dai M H, Liu Z L, Bai Y, Sun J. 2014. Seasonal variation in the phytoplankton community of a continental-shelf sea: the East China Sea. Marine Ecology Progress Series, 516: 103-126.
DOI:10.3354/meps10952 |
Hewson I, Poretsky R S, Dyhrman S T, Zielinski B, White A E, Tripp H J, Montoya J P, Zehr J P. 2009. Microbial community gene expression within colonies of the diazotroph, Trichodesmium, from the Southwest Pacific Ocean. The ISME Journal, 3(11): 1 286.
DOI:10.1038/ismej.2009.75 |
Hutchins D A, Walworth N G, Webb E A, Saito M A, Moran D, McIlvin M R, Gale J, Fu F X. 2015. Irreversibly increased nitrogen fixation in Trichodesmium experimentally adapted to elevated carbon dioxide. Nature Communications, 6(1): 8155.
DOI:10.1038/ncomms9155 |
Jiang Z B, Chen J F, Zhai H C, Zhou F, Yan X J, Zhu Y L, Xuan J L, Shou L, Chen Q Z. 2019. Kuroshio shape composition and distribution of filamentous diazotrophs in the East China Sea and southern Yellow Sea. Journal of Geophysical Research: Oceans, 124(11): 7 421-7 436.
DOI:10.1029/2019JC015413 |
Jiang Z B, Chen J F, Zhou F, Zhai H C, Zhang D S, Yan X J. 2017. Summer distribution patterns of Trichodesmium spp. in the Changjiang (Yangtze River) estuary and adjacent East China Sea shelf. Oceanologia, 59(3): 248-261.
|
Jiang Z B, Li H L, Zhai H C, Zhou F, Chen Q Z, Chen J F, Zhang D S, Yan X J. 2018. Seasonal and spatial changes in Trichodesmium associated with physicochemical properties in East China Sea and southern Yellow Sea. Journal of Geophysical Research: Biogeosciences, 123(2): 509-530.
DOI:10.1002/2017JG004275 |
LaRoche J, Breitbarth E. 2005. Importance of the diazotrophs as a source of new nitrogen in the ocean. Journal of Sea Research, 53(1-2): 67-91.
DOI:10.1016/j.seares.2004.05.005 |
Li H M, Shi X Y, Wang H, Han X R. 2014a. An estimation of nutrient fluxes to the East China Sea continental shelf from the Taiwan Strait and Kuroshio subsurface waters in summer. Acta Oceanologica Sinica, 33(11): 1-10.
DOI:10.1007/s13131-014-0550-2 |
Li H M, Tang H J, Shi X Y, Zhang C S, Wang X L. 2014b. Increased nutrient loads from the Changjiang (Yangtze) River have led to increased harmful algal blooms. Harmful Algae, 39: 92-101.
DOI:10.1016/j.hal.2014.07.002 |
Mills M M, Ridame C, Davey M, La Roche J, Geider R J. 2004. Iron and phosphorus co-limit nitrogen fixation in the eastern tropical North Atlantic. Nature, 429(6989): 292-294.
DOI:10.1038/nature02550 |
Moore C M, Mills M M, Achterberg E P, Geider R J, LaRoche J, Lucas M I, McDonagh E L, Pan X, Poulton A J, Rijkenberg M J A, Suggett D J, Ussher S J, Woodward E M S. 2009. Large-scale distribution of Atlantic nitrogen fixation controlled by iron availability. Nature Geoscience, 2(12): 867-871.
DOI:10.1038/ngeo667 |
Ou L J, Wang D, Huang B Q, Hong H S, Qi Y Z, Lu S H. 2008. Comparative study of phosphorus strategies of three typical harmful algae in Chinese coastal waters. Journal of Plankton Research, 30(9): 1 007-1 017.
DOI:10.1093/plankt/fbn058 |
Paerl H W, Prufert-Bebout L E, Guo C Z. 1994. Iron-stimulated N2 fixation and growth in natural and cultured populations of the planktonic marine cyanobacteria Trichodesmium spp. Applied and Environmental Microbiology, 60(3): 1 044-1 047.
DOI:10.1128/AEM.60.3.1044-1047.1994 |
Qu B X, Song J M, Yuan H M, Li X G, Li N. 2018. Carbon chemistry in the mainstream of Kuroshio current in eastern Taiwan and its transport of carbon into the east China sea shelf. Sustainability, 10(3): 791.
DOI:10.3390/su10030791 |
Romans K M, Carpenter E J, Bergman B. 1994. Buoyancy regulation in the colonial diazotrophic cyanobacterium Trichodesmium tenue: ultrastructure and storage of carbohydrate, polyphosphate, and nitrogen. Journal of Phycology, 30(6): 935-942.
DOI:10.1111/j.0022-3646.1994.00935.x |
Shi X Y, Li H M, Wang H. 2014. Nutrient STRUCTURE of the Taiwan Warm Current and estimation of vertical nutrient fluxes in upwelling areas in the East China Sea in summer. Journal of Ocean University of China, 13(4): 613-620.
DOI:10.1007/s11802-014-2481-0 |
Shiozaki T, Furuya K, Kodama T, Kitajima S, Takeda S, Takemura T, Kanda J. 2010. New estimation of N2 fixation in the western and central Pacific Ocean and its marginal seas. Global Biogeochemical Cycles, 24(1): GB1015.
|
Shiozaki T, Takeda S, Itoh S, Kodama T, Liu X, Hashihama F, Furuya K. 2015. Why is Trichodesmium abundant in the Kuroshio?. Biogeosciences, 12(23): 6 931-6 943.
DOI:10.5194/bg-12-6931-2015 |
Smayda T J, Reynolds C S. 2003. Strategies of marine dinoflagellate survival and some rules of assembly. Journal of Sea Research, 49(2): 95-106.
DOI:10.1016/S1385-1101(02)00219-8 |
Sun J, Liu D Y, Qian S B. 2002. A quantative research and analysis method for marine phytoplankton: an introduction to Utermöhl method and its modification. Journal of Oceanography of Huanghai & Bohai Seas, 20(2): 105-112.
(in Chinese with English abstract) |
Sun J, Liu D Y, Ning X R, Liu C G. 2003. Phytoplankton in the Prydz Bay and the adjacent Indian sector of the southern ocean during the austral summer 2001/2002. Oceanologia et Limnologia Sinica, 34(5): 519-532.
(in Chinese with English abstract) |
Tilman D. 1977. Resource competition between plankton algae: an experimental and theoretical approach. Ecology, 58(2): 338-348.
DOI:10.2307/1935608 |
Tseng Y F, Lin J, Dai M, Kao S J. 2014. Joint effect of freshwater plume and coastal upwelling on phytoplankton growth off the Changjiang River. Biogeosciences, 11(2): 409-423.
DOI:10.5194/bg-11-409-2014 |
Villareal T A, Carpenter E J. 2003. Buoyancy regulation and the potential for vertical migration in the oceanic cyanobacterium Trichodesmium. Microbial Ecology, 45(1): 1-10.
|
Wang B D. 2006. Cultural eutrophication in the Changjiang (Yangtze River) plume: history and perspective. Estuarine, Coastal and Shelf Science, 69(3-4): 471-477.
DOI:10.1016/j.ecss.2006.05.010 |
Wang B D, Wang X L. 2007. Chemical hydrography of coastal upwelling in the East China Sea. Chinese Journal of Oceanology and Limnology, 25(1): 16-26.
DOI:10.1007/s00343-007-0016-x |
Wang B D, Wang X L, Zhan R. 2003. Nutrient conditions in the Yellow Sea and the East China Sea. Estuarine, Coastal and Shelf Science, 58(1): 127-136.
DOI:10.1016/S0272-7714(03)00067-2 |
Wang Y H, Wu H, Gao L, Shen F, Liang X S. 2019. Spatial distribution and physical controls of the spring algal blooming off the Changjiang River estuary. Estuaries and Coasts, 42(4): 1 066-1 083.
DOI:10.1007/s12237-019-00545-x |
Welschmeyer N A. 1994. Fluorometric analysis of chlorophyll a in the presence of chlorophyll b and pheopigments. Limnology and Oceanography, 39(8): 1 985-1 992.
DOI:10.4319/lo.1994.39.8.1985 |
Wu H. 2015. Cross-shelf penetrating fronts: a response of buoyant coastal water to ambient pycnocline undulation. Journal of Geophysical Research: Oceans, 120(7): 5 101-5 119.
DOI:10.1002/2014JC010686 |
Xu Q, Sukigara C, Goes J I, do Rosario Gomes H, Zhu Y L, Wang S Q, Shen A, de Raús Maúre E, Matsuno T, Yuji W, Yoo S, Ishizaka J. 2019. Interannual changes in summer phytoplankton community composition in relation to water mass variability in the East China Sea. Journal of Oceanography, 75(1): 61-79.
DOI:10.1007/s10872-018-0484-y |
Yang D Z, Yin B S, Chai F, Feng X R, Xue H J, Gao G D, Yu F. 2018. The onshore intrusion of Kuroshio subsurface water from February to July and a mechanism for the intrusion variation. Progress in Oceanography, 167: 97-115.
DOI:10.1016/j.pocean.2018.08.004 |
Yang D Z, Yin B S, Liu Z L, Bai T, Qi J F, Chen H Y. 2012. Numerical study on the pattern and origins of Kuroshio branches in the bottom water of southern East China Sea in summer. Journal of Geophysical Research: Oceans, 117(C2): C02014.
DOI:10.1007%2Fs10872-012-0110-3 |
Yang D Z, Yin B S, Liu Z L, Feng X R. 2011. Numerical study of the ocean circulation on the East China Sea shelf and a Kuroshio bottom branch northeast of Taiwan in summer. Journal of Geophysical Research: Oceans, 116(C5): C05015.
|
Yang D Z, Yin B S, Sun J C, Zhang Y. 2013. Numerical study on the origins and the forcing mechanism of the phosphate in upwelling areas off the coast of Zhejiang province, China in summer. Journal of Marine Systems, 123-124: 1-18.
DOI:10.1016/j.jmarsys.2013.04.002 |
Zhang C S, Wang J T, Zhu D D, Wang X L, Li J. 2008. The preliminary analysis of nutrients in harmful algal blooms in the East China Sea in the spring and summer of 2005. Acta Oceanologica Sinica, 30(2): 153-159.
(in Chinese with English abstract) |
Zhang J, Liu S M, Ren J L, Wu Y, Zhang G L. 2007. Nutrient gradients from the eutrophic Changjiang (Yangtze River) Estuary to the oligotrophic Kuroshio waters and re-evaluation of budgets for the East China Sea Shelf. Progress in Oceanography, 74(4): 449-478.
DOI:10.1016/j.pocean.2007.04.019 |
Zhang Q L, Liu H W, Qin S S, Yang D Z, Liu Z L. 2014. The study on seasonal characteristics of water masses in the western East China Sea shelf area. Acta Oceanologica Sinica, 33(11): 64-74.
DOI:10.1007/s13131-014-0556-9 |
Zhao Y, Yu R C, Kong F Z, Wei C J, Liu Z, Geng H X, Dai L, Zhou Z X, Zhang Q C, Zhou M J. 2019. Distribution patterns of picosized and nanosized phytoplankton assemblages in the East China Sea and the Yellow Sea: implications on the impacts of Kuroshio intrusion. Journal of Geophysical Research: Oceans, 124(2): 1 262-1 276.
DOI:10.1029/2018JC014681 |
Zhou F, Xue H J, Huang D J, Xuan J L, Ni X B, Xiu P, Hao Q. 2015. Cross-shelf exchange in the shelf of the East China Sea. Journal of Geophysical Research: Oceans, 120(3): 1 545-1 572.
DOI:10.1002/2014JC010567 |
Zhou Z X, Yu R C, Sun C J, Feng M, Zhou M J. 2019. Impacts of Changjiang River discharge and Kuroshio intrusion on the diatom and dinoflagellate blooms in the East China Sea. Journal of Geophysical Research: Oceans, 124(7): 5 244-5 257.
DOI:10.1029/2019JC015158 |
Zhou Z X, Yu R C, Zhou M J. 2017a. Resolving the complex relationship between harmful algal blooms and environmental factors in the coastal waters adjacent to the Changjiang River estuary. Harmful Algae, 62: 60-72.
DOI:10.1016/j.hal.2016.12.006 |
Zhou Z X, Yu R C, Zhou M J. 2017b. Seasonal succession of microalgal blooms from diatoms to dinoflagellates in the East China Sea: a numerical simulation study. Ecological Modelling, 360: 150-162.
DOI:10.1016/j.ecolmodel.2017.06.027 |
Zhu Z Y, Wu Y, Zhang J, Du J Z, Zhang G S. 2014. Reconstruction of anthropogenic eutrophication in the region off the Changjiang Estuary and central Yellow Sea: from decades to centuries. Continental Shelf Research, 72: 152-162.
DOI:10.1016/j.csr.2013.10.018 |