 2021, Vol. 39
Institute of Oceanology, Chinese Academy of Sciences
Article Information
- LAI Hang, ZHAO Li, YANG Wen, NICHOLAUS Regan, LUKWAMBE Betina, ZHU Jinyong, ZHENG Zhongming
- Eukaryotic microbial distribution pattern and its potential effects on fisheries in the fish reserves of Qiantang River in breeding season
- Journal of Oceanology and Limnology, 39(2): 566-581
- http://dx.doi.org/10.1007/s00343-020-9331-2
Article History
- Received Jan. 3, 2020
- accepted in principle Feb. 13, 2020
- accepted for publication Mar. 14, 2020


2 Department of Natural Sciences, Mbeya University of Science and Technology, Mbeya 53000, Tanzania;
3 Department of Food Science and Technology, University of Dar es Salaam, Dar es Salaam 11000, Tanzania
River ecosystems are important parts of terrestrial water that play important roles in the biogeochemical cycling of nutrients (Sun et al., 2014) and fishery production. The increasing human activities in recent years have seriously affected river ecosystems, especially those connected to seas (Huang and Huang, 2019). The effects of human activities could be direct (e.g., sand excavation, dam construction and land reclamation) for urbanization and industrialization (Meyers et al., 2014; Anthony et al., 2015; Andrews et al., 2017) or indirect (e.g., global warming and sea level rising) (Anthony et al., 2015; Chen et al., 2017). Thus, research on the ecology of rivers not only is biologically and geologically important but also has potential applications in river ecological management and environmental protection.
The Qiantang River is the largest river in Zhejiang Province, China, with a drainage area of 44 014.5 km2 (Fig. 1). It is one of the rarest natural ecosystems and developed as a potential source of freshwater fishery production in Zhejiang (Wang, 1995; Tong, 2001). It has good natural water, a stable water level, abundant bait resources, and sound fish fauna (Tong, 2001). However, overfishing activities have deprived fish resources and destroyed the surrounding environment of the Qiantang River (Su et al., 2014). Therefore, there is an urgent need for quick monitoring and management initiatives to improve the environment of the Qiantang River ecosystem. Some restocking measures have been practiced to conserve the fish resources of the Qiantang River (Zhang et al., 2018b). For example, in 2007 and 2009, Tonglu and Fuyang were selected as provincial-level areas for reservation and restocking, mainly of Chinese carp. The Tonglu and Fuyang sections were selected as conservation areas because they have suitable water quality for fish growth with abundant fishery resources. Furthermore, in 2019 (early March to the end of June), the Qiantang River ushered its first fishing moratorium season and reopened in July, aiming at improving the environment of the Qiantang River ecosystem. The restocking of fish juveniles is one of the most effective management activities to improve fish resources in waters, and evaluation of the effect of this action on fisheries is essential (Hong et al., 2009). For example, people usually grasp the characteristics of biodiversity by studying the succession of biological resources and environmental factors and the spatiotemporal variation of plankton, benthic organisms and fishes (Zhang et al., 2009). Previous studies on the evaluation of restocking measures in the Qiantang River have mainly focused on the investigation of fish (Zhang et al., 2018b) and benthic organisms (Zhang et al., 2016), while microplankton, including eukaryotic microplankton such as phytoplankton (producers), zooplankton (consumers) and fungi (decomposers), have rarely been investigated.

|
| Fig.1 Distribution map of sampling sites The 7 sampling sites were distributed in 5 sampling cities: Jiande (JD, 1 site), Tonglu (TL, 2 sites namely T1, T2), Fuyang (FY, 2 sites namely F1, F2), Jiubao (JB, 1 site), and Yanguan (YG, 1 site). JD-upstream, YG-downstream. |
Phytoplankton, or microalgae, as principal primary producers, constitute more than half of the planet's primary productivity (Arrigo, 2004). Phytoplankton assembly is exposed to the individual and combined effects of various physicochemical and biological factors, such as light, temperature, salinity, pH, nutrients, and grazing. Dramatic variations in phytoplankton communities such as algal blooms may have serious and far-reaching effects on the stability of aquatic ecosystems (Huisman et al., 2005). On the other hand, phytoplankton are the main feed for zooplankton and some economic fish, which can affect the structure of the zooplankton community and the growth of fish. Phytoplankton are the most important and basic components of the aquatic ecosystem, especially in the food web; thus, studying phytoplankton dynamics is very helpful to further explore the water ecosystem. Zooplankton, including various creatures such as protozoa, crustaceans, mollusks, and their larvae, can be divided into 5 sizes (megalo, >20 mm; macro, 2–20 mm; meso, 200– 2 000 μm; micro, 20–200 μm; nano, 2–20 μm). They feed on phytoplankton, organic debris and planktonic bacteria as primary consumers and transfer energy to higher-trophic-level organisms through the food web. Zooplankton are an important feed for many economic filter-feeding fish, affecting the material cycle and energy flow in ecosystems and occupying an important position in the trophic level of the waters (Baird et al., 2003). During the main season of juvenile fish growth, zooplankton act as bait organisms and should be widely considered. Like others, the distribution, composition and scale of zooplankton are susceptible to temperature, salinity, transparency, pH and food intake (Tasevska et al., 2012), and some zooplankton can also serve as indicator organisms for assessing the ecological quality of waters (Wen et al., 2011). Therefore, studying the zooplankton community structure is also beneficial for understanding the health status of water bodies and the grazing situation of fish and providing insights into the maintenance of ecological balance in waters. Fungi are often decomposers, parasites, and even consumers and significantly affect the growth of fish and the biogeochemical cycling of river ecosystems (Priscu, 1995). Previously, microbes were identified using the traditional cultivation method, which has disadvantages of critical cultivation, poor culturability, low resolution, and long duration. Next-generation sequencing (NGS), also known as high-throughput sequencing, which is widely used today, can overcome the preceding shortcomings. Owing to its advantages of low cost, high throughput, high accuracy, and easy operation, it has been widely affirmed by researchers in the field of life sciences. This paper used 18S rRNA gene high-throughput sequencing technology to detect eukaryotic microbes in water.
July to August is the growth conservation period for the juvenile fish in the Qiantang River, and eukaryotic microbes are the main bait for the fish. Therefore, the eukaryotic microbes from July to August were the focus of our study. 18S rRNA gene high-throughput sequencing technology was applied to explore the eukaryotic microbial differences in several major sections of the Qiantang River. This study intends to examine the basic distribution patterns of eukaryotic microbes and water quality parameters of the Qiantang River, explore the main driving factors of the eukaryotic microbial distribution, and investigate the potential relationship between the dynamics of eukaryotic microbial distribution and fisheries.
2 MATERIAL AND METHOD 2.1 Study area and sampling strategyIn July and August 2018, five sampling stations (Jiande, Tonglu, Fuyang, Jiubao, and Yanguan) from upstream to downstream were surveyed in the Qiantang River Basin. As the Tonglu and Fuyang sections are fish restocking zones, they were regarded as the main experimental stations of this research, and each station had two sections; the rest were control stations, with one sampling section each. That is, there were 4 sections of treatment groups, Tonglu 1 (T1), Tonglu 2 (T2), Fuyang 1 (F1) and Fuyang 2 (F2), and 3 sections of the control groups, Jiande (JD, upstream reference point), Jiubao (JB, downstream reference point 1) and Yanguan (YG, downstream reference point 2) (Fig. 1). According to the geographical location, each sampling was performed from upstream to downstream (JD to YG), and each sampling section had three sampling points, which were sampled on both sides and in the center of the river surface (with a depth of 0.5 m). In total, 42 samples were collected (7 sections × 3 sampling points × 2 repetitions). Sample collection, storage, pretreatment, and transportation were carried out in accordance with the methods specified in Surface Water Environmental Quality Standard GB3838- 2002.
2.2 Physicochemical parameter analysesWater temperature, salinity, pH, and dissolved oxygen were recorded in situ using an YSI multifunction water quality detector (YSI 6000, USA) at a depth of 0.5 m, and Secchi depth was estimated by a 0.2-m diameter black-white Secchi disk. The concentration of chlorophyll a was measured in situ using a chlorophyll underwater fluorescence detector (bbe FluoroProbe Ⅲ, Germany). Ammonium, nitrite, nitrate, orthophosphate, total nitrogen, total phosphorus, and hexavalent chromium were analyzed using an automated spectrophotometer (Smart-Chem 200 Discrete Analyzer, Westco Scientific Instruments, Brookfield, USA) in the laboratory. Chemical oxygen demand was further determined according to the acidic potassium permanganate method. The above analyses were completed within one week after sampling.
2.3 Eukaryotic microbes gathering and DNA analysesAdditional water from the same sites (around 1.5 L) was prefiltered through a 106-μm pore-size sieve and subsequently filtered onto 0.2-μm pore-size polycarbonate membranes (47 mm in diameter, Millipore, Boston, MA, USA) on the sampling day, and duplications were made to preserve. The membranes were immediately frozen at -80 ℃ until they were needed.
After cutting up the membranes by sterilized scissors, microbial DNA was extracted directly from the membranes using Power Soil® DNA Isolation kits (MO Laboratories, Carlsbad, CA, USA) according to the manufacturer's protocol. Sequentially, the DNA concentration and purity of the extracts were analyzed under the wavelength of 260/280 nm and 260/230 nm using a spectrophotometer (ND-1000, NanoDrop Technologies Inc., Wilmington, DE, USA). The acquired eligible DNA extracts were preserved at -80 ℃. PCR was completed under a 30-μL reaction system, and 10 ng of the purified DNA of each sample was used as a PCR template, and the primer pair used 528F (5′-GCGGTAATTCCAGCTCCAA-3′) and 706R (5′-AATCCRAGAATTTCACCTCT-3′) (Peng et al., 2019). The V4 region of the eukaryotic microbial 18S rRNA gene was amplified, and three biological replicates were set for each PCR sample. The PCR conditions were as follows: firstly a predenaturation at 98 ℃ for 1 min; secondly 30 cycles of denaturation at 98 ℃ for 10 s, annealing at 50 ℃ for 30 s and extension at 72 ℃ for 30 s; finally extension at 72 ℃ for 5 min. The PCR products were then detected by operating electrophoresis on 2% agarose gel, and were extracted again using AxyPrep PCR Cleanup Kit (AXYGEN, Life Science Research). Furthermore, the PCR products were purified by using PCR fragment purification kits (Takara Biotech, Japan). After that, we quantified the purified products using Qubit dsDNA HS Assay kits (Invitrogen, Life technologies) with the Promega QuantiFluor system and picked out those whose concentration was exceeding 2 nmol/L. Finally, moderate equimolar products were degenerated to single streams by sodium hydroxide and were sequenced on the Ion S5TM XL single-end sequencing platform (Thermo Fisher Scientific - CN).
2.4 Processing of original sequencing dataSingle-end reads of 303-308 bp (average length of a single sample) were generated and assigned to samples, and the primer sequences were cut off. These matched raw FASTQ data were then processed using the Quantitative Insights Into Microbial Ecology pipeline (QIIME 1.9.0, http://qiime.org/tutorials/tutorial.html). The chimera sequences of the raw reads were detected and truncated by USEARCH 61 to obtain clean reads. Subsequently, phylogenetic types were identified by UCLUST, and sequences were assigned to operational taxonomic units (OTUs) at a 97% similarity level (Edgar, 2010). The most abundant sequences of each phylogenetic type were screened as representative sequences and taxonomically assigned to the SILVA 119 database by PyNAST. We obtained 1 342 019 clean reads and 21 147 to 41 758 reads per sample (31 953±4 473, mean±standard deviation) after quality control, yielding 8 844 original OTUs. To minimize random errors, OTUs that accumulated in all samples at a number below five (perhaps some sequencing errors, approximately 0.001% of the total) (Bokulich et al., 2013) and that were not affiliated with eukaryotes were also removed from the dataset. Additionally, all samples were rarefied to 20 500 sequences to normalize the unequal sequencing depth. Finally, 3 407 valid OTUs were selected, and the number in each sample was used to represent species richness. Microbial alpha-diversity indices (Shannon diversity index, observed species richness index and Pielou J evenness index) and the beta-diversity index (Jaccard distance) were computed in the R environment (http://www.r-project.org).
2.5 Statistical analysesBefore ecological analyses, OTU data were Hellinger transformed, and the environmental parameter data were normalized to improve normality and homoscedasticity. Nonmetric multidimensional scaling (NMDS) based on the Jaccard distance of OTUs was applied to visualize overall differences in microbial community structure among sites. The reliability of NMDS was tested by the stress value (Kruskal's stress formula), which should be lower than 0.2 to minimize misinterpretation (Clarke and Warwick, 2001). The significance and distinctness of differences among groups were assessed by the R-value of ANOSIM (analysis of similarity). Recognition orders were selected by random forest (RF) classification, and 10-fold cross-validation was also implemented. The RF classifier is associated with its Gini that is an index of RF and represents the feature importance of the species. The first axis length by detrended correspondence analysis (DCA) of OTU data was 3.14, which showed a more linear model. Major environmental factors were selected forward and verified with Monte Carlo permutation tests (permutations=999). Then, environmental factors with strong collinearity were also omitted according to the maximum variance inflation factor (VIF).
Asymmetric eigenvector maps (AEMs) (Blanchet et al., 2008), unlike the commonly used principal coordinates of neighbor matrices (PCNM), were applied to directionally quantify the provincial patterns potentially contributing to the community structure. That was, first designing a special tree-like node-edge model (Blanchet et al., 2008) from upstream (JD) to downstream (YG) (namely, those involved from the upper were one, otherwise zero), second transforming their longitude and latitude to Cartesian coordinates (unit=10 000), third weighing their inverse number of squared Euclidean distances, and finally constructing the eigenvector using the function "aem". PCNM was also applied for comparison. The variation partitioning approach (VPA) was applied to measure the relative importance of spatial and environmental factors on structuring the microbial community. Partial redundancy analysis (pRDA) and partial Mantel tests were applied to clarify the pure correlation between the microbial community and environmental factors. All ecological analyses were performed in the R environment unless otherwise indicated.
Molecular ecological network analyses (MENA) (http://ieg2.ou.edu/MENA) (Deng et al., 2012) based on Pearson correlation matrix and threshold approach of random matrix theory (RMT) were applied to reveal the potential microbial interactions. The topological properties of each network can also be calculated to evaluate their reliability and provide their comparability. Generally, 100 randomly rewired networks will be generated for each empirical network, and network indices are calculated for each randomized network. It is usually ecologically meaningful when the empirical network indices are beyond the randomized network indices.
One-way ANOVA followed by Duncan's multiple comparisons was performed by SPSS 17 to compare variations in the water quality parameters and alphadiversity indices among sites (the significance level was selected as 0.05).
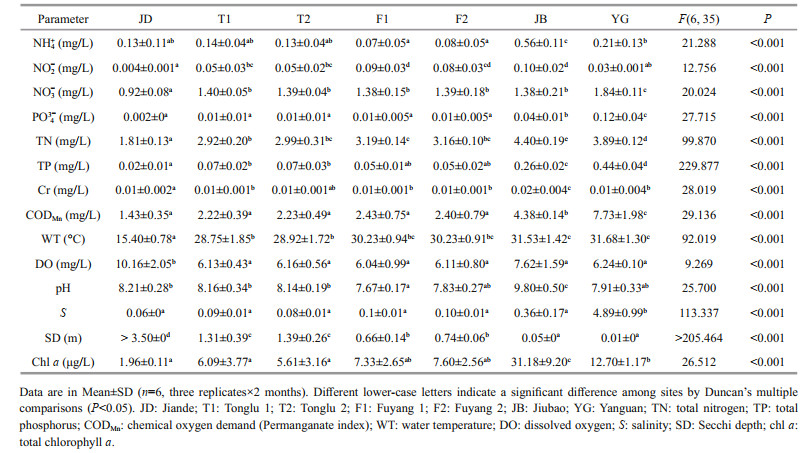
3 RESULT 3.1 Physicochemical conditionsOne-way ANOVA showed that there were significant differences in all environmental variables measured among the sampling sites (P < 0.05, Table 1). In general, nitrite, nitrate, orthophosphate, total nitrogen, total phosphorus, chromium, chemical oxygen demand, water temperature, salinity and total chlorophyll a distributions were minimal at JD and top-down increased gradually via TL (T1 and T2) and FY (F1 and F2), finally peaking at JB or YG, but transparency varied oppositely (Duncan's test, Table 1). The YG section showed the intricate and irregular variance of the environmental factor itself.
The NMDS plot clearly revealed the global differentiation of eukaryotic microbial community structure (EMCS) among groups (stress < 0.1, Fig. 2). Its corresponding ANOSIM results (R=0.918, P=0.001) indicated a high correspondence between TL and FY and their great distinctness against JD and YG and slight distinctness against JB.

|
| Fig.2 Non-metric multidimensional scaling plot of microbial community based on Jaccard distance in the river Different colors or shapes indicate samples divided into different groups. JD: Jiande; T1: Tonglu 1; T2: Tonglu 2; F1: Fuyang 1; F2: Fuyang 2; JB: Jiubao; YG: Yanguan. The first numbers after site names represent sampling replicates, and the second subsequent numbers represent the sampling months. |
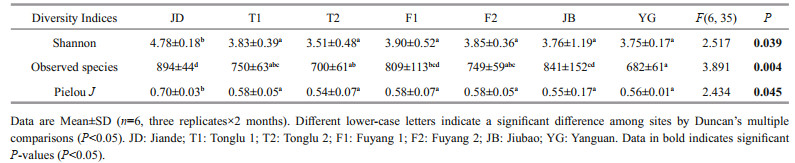
One-way ANOVA showed there were significant differences in three alpha-diversity indices among different sites with the highest indices in JD (P < 0.05, Table 2).
At the phylum level, Phaeophyta (Ochrophyta), Metazoa, Ciliophora, Cryptophyta, Chlorophyta, Heterokontophyta (Stramenopiles) Other, Dinophyta and Fungi dominated the microbial community across these areas of the Qiantang River (Fig. 3), totally accounting for 92.4% (JD), 98.1% (T1), 97.9% (T2), 97.8% (F1), 98.2% (F2), 98.1% (JB) and 92.1% (YG) of each section's OTUs on average. Specifically, Dinophyta hardly existed in TL (0.43%), FY (0.44%) and JB (0.25%) but was relatively more abundant in JD (4.84%, dominated by 68.71% of Peridiniphycidae) and YG (17.17%, dominated by 96.72% of Peridiniphycidae). It was remarkable that up to 31.14% of Gymnodiniphycidae made up the Dinophyta in JD compared to YG (only 1.45% of Gymnodiniphycidae). Similarly, fungi were significantly more abundant in JD (5.77%), JB (2.99%) and YG (4.26%) than in TL (0.62%) and FY (0.89%) (Duncan's test). In addition, Charophyta had a relatively higher abundance in the JD section (3.36%) than in the other sections (0.04%– 0.10%). However, Cryptophyta were observed to be higher in TL (10.63%) and FY (15.89%) than in JB (2.94%) and YG (4.43%) (Duncan's test); Chlorophyta were detected to be more abundant in TL (9.69%) and FY (13.99%) than in JD (3.86%), JB (5.64%) and YG (4.40%) (Duncan's test).

|
| Fig.3 The relative abundance of dominant eukaryotic microbes in the river at the phylum level JD: Jiande; T1: Tonglu 1; T2: Tonglu 2; F1: Fuyang 1; F2: Fuyang 2; JB: Jiubao; YG: Yanguan. The relative abundances are the averages of 6 data (3 replicates×2 months). |
The 20 most valid recognition orders of eukaryotic microbes were selected from 379 orders based on the top Gini of RF classification, which further validated the least error of zero by cross-validation. The 20 orders were displayed by heatmap based on their average relative abundance (square root transformed) (Fig. 4). It can be seen from the map that the eukaryotes between the left four (TL and FY) and the right 3 (JB, JD and YG) were significantly different (Fig. 4). The three top orders (Coscinodiscophytina, Chytridiomycota, and Peridiniphycidae) may act as biological indicators of JD, JB, and YG, while the four bottom orders (TKR07M. 92, Teleaula, Hafniomonas and Tetraselmis) may act as biological indicators of TL and FY (Fig. 4).

|
| Fig.4 Heatmap of the top 20 microbial orders selected by random forest |
Six sets of linearly independent spatial eigenvalues were generated by AEM. This AEM model could explain the variation in the EMCS by up to 43.7% (F=6.30, P=0.001). Permutation tests by axes showed that only the first four axes were significantly meaningful (F=14.11, 11.58, 6.24, 4.79, P=0.001, permutations=9 999).
Before the variance partitioning procedure, principal components of environmental factors and the spatial model were extracted as mentioned. Eight environmental factors were retained from 14, namely, ammonium, nitrite, nitrate, total nitrogen, water temperature, pH, salinity and total chlorophyll a, all of which were significantly meaningful by Monte Carlo permutation tests (P < 0.05, permutations=9 999) and explained the EMCS variance by 57.4% (adjusted R2, F=7.91, P=0.001). However, the eigenvalues of the AEM model and linear trend factors were all retained. The final variation partitioning analysis showed that the environmental and spatial variables could explain the variation of the EMCS by 70.2% in total (Fig. 5), and only 29.8% was unexplained. Pure environmental effects explained the EMCS variance by only 26.5% (F=4.89, P=0.001) from 57.4% (jointly). The remaining 30.9% explained by environmental factors was spatially constrained. In addition, the pure spatial effects could explain the variance by 12.8%, but the linear trend took none of it without the AEM model.

|
| Fig.5 Variance partitioning plot of microbial community structure in Qiantang River The explanatory power of the pure and shared fractions of environment factors (Env), spatial factors including linear trend and AEM (Asymmetric eigenvector maps) variables are shown as adjusted R2. The value of adjusted R2<0 was not shown. Permutation tests were applied to the variation explained by the pure fraction. ** represents a statistically significant difference (P<0.01). |
Partial Mantel test and pRDA (spatial variables as concomitant variables) were opted to reveal the pure relationship of the main environmental factors and EMCS. Permutation tests of partial RDA by axes showed that the first five axes were significantly meaningful (F=14.96, 10.64, 4.61, 3.26, 3.04, P=0.001, permutations=9 999). The ordination biplot (Fig. 6), accounting for 70.1% of the five axes, showed that the variation in the EMCS was intensively correlated with these environmental variables. However, there were no significant correlation in the samples of JB and YG with the environmental variables. In particular, total nitrogen, nitrate, nitrite, ammonium and total chlorophyll a could strongly shape the EMCS of the TL and FY sections in various directions.

|
| Fig.6 Ordination biplot using partial redundancy analysis showing the pure variations of microbial community constrained by environmental factors in the river Spatial variables are as concomitant variables. Different colors or shapes indicate samples divided into different groups. Different arrow name colors stand for different kinds of environmental factors. JD: Jiande; T1: Tonglu 1; T2: Tonglu 2; F1: Fuyang 1; F2: Fuyang 2; JB: Jiubao; YG: Yanguan. The first numbers after site names represent sampling replicates, and the second subsequent numbers represent the sampling months. TN: total nitrogen; N2: nitrite; N3: nitrate; NH: ammonium; WT: water temperature; S: salinity; Ch: total chlorophyll a. |
The partial Mantel test further validated the pure correlation of the eight main environmental factors and EMCS (Table 3). The beta diversity showed the highest positive correlation with nitrite, water temperature and pH (P < 0.05), while three alphadiversity indices all showed significant positive correlations with water temperature, ammonium, nitrate and total chlorophyll a (P < 0.05).

|
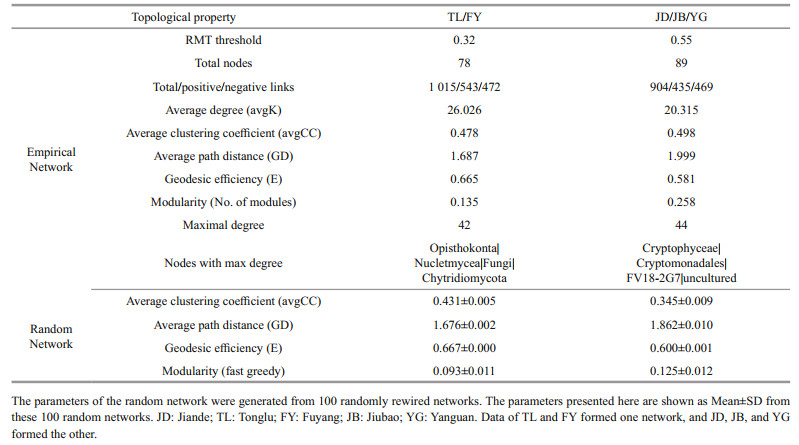
We chose the class level for simplifying the overcomplex whole networks. As TL and FY were highly similar (Figs. 2 & 4), we simply divided all classes into two groups (TL/FY and JD/JB/YG) to highlight the network difference. The network structures and properties of the two networks differed clearly (Supplementary Figs.S1 & S2, Table 4). The network of TL/FY was made up of 78 classes, 543 positive and 472 negative links, and 26.0 of average degree; the other was made up of 89 classes, 435 positive and 469 negative links, and 20.3 of average degree (Table 4). Notably, the network of TL/FY possessed fewer nodes but more links than the other, indicating stronger and more complex interspecies interactions. This pattern was also verified by key network topological properties, including more links, a greater degree and higher geodesic efficiency, and a shorter path distance in the network of TL/FY than the other (Table 4). In addition, nodes with a maximum degree were Chytridiomycota in the network of TL/ FY (42) and FV18-2G7 in the network of JD/JB/YG (44), which seemed to be keystones. Interestingly, there were more positive links in the TL/FY network than in the other network (Table 4).

|
| S1 Supplementary Fig.S1 Network of Tonglu and Fuyang at the class level |

|
| S2 Supplementary Fig.S2 Network of Jiande, Jiubao and Yanguan at the class level |
River connectivity and directionality are important for the spread of aquatic organisms (Brown and Swan, 2010; Liu et al., 2013a), especially the microbes with smaller size (Chen et al., 2019). Most studies on the metacommunities of the river have used interterrestrial distances among sites to simulate spatial processes without considering connectivity and directionality between river points, such as using the PCNM or distance decay models (Liu et al., 2013b; Zhang et al., 2018a; Isabwe et al., 2019). In this study, AEMs were used to model the spatial relationship of each river section. The AEM spatial model explained the total variation of the EMCS by 43.7% (adjusted), compared to no more than 35.6% (this value has already exceeded the full model) by the PCNM model (F=8.57, P=0.001). This result indicated that the AEM model was more suitable for this study and illustrated the importance of considering directionality in the spatial modeling process during water ecology research (Blanchet et al., 2008). In addition, the linear trend variable referred to the coordinates in the Cartesian coordinate system, which cannot explain the community variation alone in this study (Fig. 5). This was different from the study on the planktonic eukaryotic microbes in the eastern Zhejiang coast (Zhang et al., 2018a). One possible explanation was that the sampling sections were linearly distributed rather than radially distributed and that the sections were not dense enough in our study. AEM is superior to PCNM or MEM (Moran's eigenvector maps) in many cases (Vrebos et al., 2017) and has been successfully applied to river ecology (Wan et al., 2015; Isabwe et al., 2018). Thus, increasing reports are considering directionality during spatial modeling in ecology (Zhao et al., 2017; ZorzalAlmeida et al., 2018; Chen et al., 2019).
4.2 Microbial community structure affected by environmental and spatial variablesIn this study, the EMCS was significantly correlated with nitrite, nitrate, ammonium, water temperature and total chlorophyll a (Table 3), suggesting that these factors may have the most profound impacts on the EMCS of the Qiantang River. Nitrogen is an essential nutrient for phytoplankton and zooplankton, and a strong correlation between the concentration of nitrogen and the biomass of phytoplankton and zooplankton has been well documented (Zhang et al., 2018a; Shetye et al., 2019; Zhang et al., 2019). However, nitrogen is the most common but limited macronutrient in water, which could limit the primary productivity of water by regulating phytoplankton growth (Abell et al., 2010). Meanwhile, nitrogen can indirectly promote zooplankton growth, as a high level of nitrogen helps phytoplankton grow, which could provide more resources for filter-feeding zooplankton to thrive and reproduce (Zhang et al., 2019). In this study, partial RDA results also provided affirmative evidence on this (Fig. 6, e.g., ammonium, nitrite, nitrate and total nitrogen).
Water temperature is generally thought to be a vital basic environmental factor affecting EMCS (Liu et al., 2013b; Duarte et al., 2019) and prokaryotic community structure (Hu et al., 2018) in direct and/or indirect ways. Water temperature usually results in large gradient changes in physicochemical factors of aquatic ecosystems (Lv et al., 2013; Liu et al., 2015), which could easily cause a series of chain reactions of the EMCS. High temperature coupled with elevated nutrient concentrations, for example, can increase the occurrence of phytoplankton blooms (e.g., the JB section of this study) and influence the density of potential pathogens and the activation of virulence factors (Kinnula et al., 2017). However, as the sections we studied were too typical to form huge differences in water temperature, only a weak constraint by water temperature could be found according to the partial RDA plot (Fig. 6) compared with the nitrogen above.
Chlorophyll a concentration could be a measurement of phytoplankton biomass (Zhang et al., 2019), but it could not fit well in this study. This is likely because 18S rRNA gene sequencing technology has some methodological limitations; for example, cyanobacteria (also a kind of phytoplankton) were classified as prokaryotes in high-throughput sequencing. Furthermore, our bbe FluoroProbeIII detector may perform poorly or insensitively when coping with epinephelos water, as the chlorophyll a data seemed slightly exaggerated in JB and YG (Table 1). However, both correlation and partial RDA with the EMCS showed a considerable constraint by chlorophyll a. Some studies showed that a higher chlorophyll a concentration caused a concurrent increase in microbial density (DeBoer et al., 2016), but this was inconsistent with our study probably due to the complexity of the eukaryotic microbial community or the effects of the predators (e.g. juvenile fish) which feed on zooplankton. Moreover, a higher concentration of blue-green algae (i.e., cyanobacteria blooms) may enhance the bacterial ecological process, leading to increasing the abundance of bacterivores (e.g., Ciliophora and Cercozoa) and the whole eukaryotic microbial community (Xue et al., 2018). However, cyanobacteria blooms could inhibit the growth of zooplankton at times due to the toxins released (Liu et al., 2019). In addition, other detected microbes, such as fungi and aquatic larvae, may also reflect the variance of chlorophyll a concentration, thus affecting the EMCS.
Significant effects of pH on the beta diversity and Shannon index (Table 3) may be attributed to increased calcification of the plankton's cytoderm at higher pH (De Nooijer et al., 2009). In addition to these factors, other environmental variables involved only showed weaker or no correlations with the EMCS (e.g., salinity, Table 3). Besides, there were no significant correlation in the samples of JB and YG with the environmental variables (Fig. 6), which might be due to the effects of the tide, salinity, turbidity or other hydrological factors. Actually, the eukaryotic microbial community is mostly affected by stochastic processes rather than deterministic processes (e.g., environmental factors) in turbulent waters, which needs a further study (Chen et al., 2019).
Although the importance of environmental and spatial variables in controlling microbial communities has been recorded (Chust et al., 2013; Zhang et al., 2018a), it is still difficult to decide which process is dominant. Our present study also showed severely spatially structured profiles of environmental variables. The spatially structured environmental variations explained most of the EMCS variation (Fig. 5), indicating that the local environmental conditions were spatially shaped and conditioned the EMCS. However, there are many unknown factors that we did not measure, which might cause an overestimation of the current variations owing to the limited approach (Isabwe et al., 2019).
4.3 Relationship between eukaryotic microbes and fisheriesThe TL and FY sections were both fish restocking and reservation areas of the Qiantang River, and many eukaryotic microbes were important feeds for fish. The microbes in this study had an extensive range of cell sizes. Larger cells, including unicellular organisms (e.g., ciliates, diatoms and dinoflagellates) and multicellular organisms (e.g., rotifers and mollusks), generally possess much higher 18S rRNA copies per unit than those of other microalgae and protists (Gong et al., 2013), which could induce an overestimation of their relative abundance. However, this study focused more on whether specific microbes could be detected, and their relative abundance was a secondary consideration. Rotifers are important members of zooplankton, which are the initial bait of most fish larvae and the main feeds of filter-feeding Chinese carp, so they are essential for fishery production. In this study, rotifers were distributed more in the TL section. The rich and nutritious animal feeds and rotifers can provide adequate material insurance for fish larvae, which is beneficial for fish growth.
Rhizophydium of Chytridiomycetes fungi can effectively control the occurrence of cyanobacterial blooms (Frenken et al., 2017; Ortiz-Cañavate et al., 2019). A considerable number of Rhizophydium were distributed in TL and FY in this study, which played a certain role in the regulation of water quality. Healthy water rears good fish. However, some fungi (e.g., Chytridiales) can be saprophytic or parasitic on hosts (e.g., fish and diatoms) (James et al., 2006). Some fungi can even cause epidemics. For example, Aphanomyces of Oomycetes, an opportunistic pathogen, can cause epizootic ulcerative syndrome (EUS), whose mortality rate of infection is close to 100% (Saylor et al., 2010). In this study, a small amount of Aphanomyces was detected in TL and FY (but the taxonomic status belonged to the Peronosporomycetes). Therefore, that the fact that this fishery disease may be controlled by biological control methods such as Bacillus sp. strain BC01 if it occurs in TL or FY requires further study (Foysal and Lisa, 2018).
In phytoplankton, Chrysophyceae have bare cell walls, are rich in eicosapentaenoic acid (EPA) and docosahexaenoic acid (DHA), and have characteristics of good palatability and rich nutrients. Therefore, they are natural high-quality baits for aquatic animals. In this study, Chrysophyceae are widely distributed in TL and FY (Fig. 4). Cryptophytes are indicators of a healthy water quality; the difference in their distribution indicated that the water in the upper reaches of FY was better than that in the lower reaches of JB (Figs. 3 & 4). In addition, they are also excellent baits preferred by many filter-feeding fish, especially Chinese carp. In this study, Cryptomonas and Teleaulax of Cryptophytes were widely detected in TL and FY (Fig. 4). Chlorophyceae are also important baits for aquatic animal larvae and filter-feeding fish, some of which are beneficial to water quality. In this study, quite a few Tetraselmis, Chlamydomonas and Hafniomonas of Chlorophyceae were detected (Fig. 4), which were distributed mostly in TL and FY. In summary, most microbes of TL and FY were beneficial plankton; their presence could improve water quality and provide natural bait, but there were also a small number of harmful microbes that needed attention.
In this study, the environmental factors and the EMCS of TL and FY were highly consistent and significantly different from others (Figs. 2 & 4), so we can simplify all the sequences into two categories (TL/FY representing the fish reservations, JD/JB/YG representing the nonprotected areas) to highlight the overall differences in the molecular ecological network formed by different ways of management, although some secondary information might be ignored. The two networks generated also had clear general network properties (Deng et al., 2012), such as being free-scale and of small world (Table 4). Positive links (correlations) in the network may suggest similar ecological functions between the nodes, while negative links may indicate competition or predation relationships (Steele et al., 2011). Although cooperating networks are efficient, they can also be unstable; while competition may drive inefficiencies, it will dampen the unstable cooperation effects that can lead to a loss of community members (Coyte et al., 2015); in turn, it shows more stability. This study showed that the proportion of cooperative interactions (positive associations) in the TL/FY network far exceeded the proportion of JD/JB/YG (Table 4), indicating relatively lower stability in the fish reservations (TL and FY).
Another method can evaluate community stability. Interspecies interactions respond directly and instantly within a community when encountering perturbations, so the strength of interactions can also determine the stability of an ecological community (Shade et al., 2012). The network complexity (assessed by the network topological properties, Table 4) could be used to infer the strength of interspecies interactions (Faust and Raes, 2012). Generally, a more complex community means a more stable ecosystem (Neutel et al., 2007), but the exact relationship between complexity and stability remains controversial (Faust and Raes, 2012). It has been proposed that a successionally complicated network would destabilize a naturally assembling ecosystem (May, 2001), resulting in weaker stability. In this study, a more complex community brought an ecosystem of weaker stability (TL and FY). One possible explanation for this was that anthropogenic restocking behavior might upset the original ecological balance by applying survival pressure on plankton, thus resulting in a decrease in the plankton (nodes) but more intensive associations in the TL/FY network, which means unstable turnover. However, we considered the turnover to be temporary, occurring just during the transition period to a higher stability level. A series of measures would have been implemented, such as fertilization and fish harvesting, to relieve the existence pressure of the plankton. Most likely, soon the fish reservations of the Qiantang River would eventually reach a higher level of stability. These conclusions again confirmed our finding that the reservations destabilized the microbial community.
Topologically, species play diverse roles in an association (Guimerà et al., 2007). Although keystones are usually the minority of an association (based on network topology and modularity), they often play principal roles in response to external perturbations (Deng et al., 2016). For example, in this study, Chytridiomycota (only 0.65% of all sequences) were the keystones of the TL/FY network (Table 4). It has been reported that members of Chytridiomycota can regulate the number of diatoms (Ibelings et al., 2004; Lefèvre et al., 2008; Xue et al., 2018), which was consistent with this study (Supplementary Fig. S1). Pathogens can suppress the growth of phytoplankton that have been infected by specific pathogens; thus, fungal parasitism can be a vital factor controlling natural succession (Ibelings et al., 2004).
5 CONCLUSIONThis study demonstrated that the magnitude of differences in the microbial community assembly and alpha diversity differed along the selected sections of the Qiantang River, and the distinctness was significantly constrained by spatially structured environmental factors and biological interactions. The distinctions can be significantly categorized into four patterns, namely, (i) JD, (ii) TL and FY, (iii) JB, (iv) YG, perhaps owing to the relative manager's restocking measures in TL and FY. Among all the environmental factors measured, nitrogen (nitrite, nitrate and ammonium), water temperature and total chlorophyll a acted as major driving factors that controlled the eukaryotic microbial distribution. The existence of some algae (e.g., Chrysophyceae, Cryptophytes and Chlorophyceae) and some fungi (e.g., Rhizophydium) in TL and FY could be beneficial to juvenile fish growth and water quality, although some detrimental species (e.g., Aphanomyces) need attention. In addition, we also identified some potential keystone microbes, indicating their importance in regulating the microbial community along the river. These findings provide valuable information for supplementing the available knowledge on eukaryotic microbial ecology in flowing rivers with contrasting human activities using 18S rRNA gene sequencing technology.
6 DATA AVAILABILITY STATEMENTThe data that support the findings of this study are only available from the corresponding author on reasonable request, due to some limitation.
7 ACKNOWLEDGMENTWe would like to thank the Beijing Novogene Biotechnology Co., Ltd. for 18S rRNA gene sequences. The authors wish to thank the anonymous reviewers for their valuable comments and suggestions, which were helpful in improving our manuscript.
Electronic supplementary materialSupplementary material (Supplementary Figs.S1 & S2) is available in the online version of this article at https://doi.org/10.1007/s00343-020-9331-2.
Abell J M, Özkundakci D, Hamilton D P. 2010. Nitrogen and phosphorus limitation of phytoplankton growth in New Zealand lakes: implications for eutrophication control. Ecosystems, 13(7): 966-977.
DOI:10.1007/s10021-010-9367-9 |
Andrews S W, Gross E S, Hutton P H. 2017. Modeling salt intrusion in the San Francisco Estuary prior to anthropogenic influence. Cont. Shelf Res., 146: 58-81.
DOI:10.1016/j.csr.2017.07.010 |
Anthony E J, Brunier G, Besset M, Goichot M, Dussouillez P, Nguyen V L. 2015. Linking rapid erosion of the Mekong River delta to human activities. Sci. Rep., 5: 14 745.
DOI:10.1038/srep14745 |
Arrigo K R. 2004. Marine microorganisms and global nutrient cycles. Nature, 437(7057): 349-355.
DOI:10.1038/nature04159 |
Baird M E, Walker S J, Wallace B B, Webster I T, Parslow J S. 2003. The use of mechanistic descriptions of algal growth and zooplankton grazing in an estuarine eutrophication model. Estuar., Coast. Shelf Sci., 56(3-4): 685-695.
DOI:10.1016/S0272-7714(02)00219-6 |
Blanchet F G, Legendre P, Borcard D. 2008. Modelling directional spatial processes in ecological data. Ecol. Modell., 215(4): 325-336.
DOI:10.1016/j.ecolmodel.2008.04.001 |
Bokulich N A, Subramanian S, Faith J J, Gevers D, Gordon J I, Knight R, Mills D A, Caporaso J G. 2013. Qualityfiltering vastly improves diversity estimates from Illumina amplicon sequencing. Nat. Methods, 10(1): 57-59.
DOI:10.1038/nmeth.2276 |
Brown B L, Swan C M. 2010. Dendritic network structure constrains metacommunity properties in riverine ecosystems. J. Anim. Ecol., 79(3): 571-580.
DOI:10.1111/j.1365-2656.2010.01668.x |
Chen J, Gao C, Zeng X F, Xiong M, Wang Y J, Jing C, Krysanova V, Huang J L, Zhao N, Su B D. 2017. Assessing changes of river discharge under global warming of 1. 5℃ and 2℃ in the upper reaches of the Yangtze River Basin: approach by using multiple- GCMs and hydrological models. Quat. Int., 453: 63-73.
DOI:10.1016/j.quaint.2017.01.017 |
Chen W D, Ren K X, Isabwe A, Chen H H, Liu M, Yang J. 2019. Stochastic processes shape microeukaryotic community assembly in a subtropical river across wet and dry seasons. Microbiome, 7: 138.
DOI:10.1186/s40168-019-0749-8 |
Chust G, Irigoien X, Chave J, Harris R P. 2013. Latitudinal phytoplankton distribution and the neutral theory of biodiversity. Global Ecol. Biogeogr., 22(5): 531-543.
DOI:10.1111/geb.12016 |
Clarke K R, Warwick R M. 2001. A further biodiversity index applicable to species lists: variation in taxonomic distinctness. Mar. Ecol. Prog. Ser., 216: 265-278.
DOI:10.3354/meps216265 |
Coyte K Z, Schluter J, Foster K R. 2015. The ecology of the microbiome: networks, competition, and stability. Science, 350(6261): 663-666.
DOI:10.1126/science.aad2602 |
De Nooijer L J, Toyofuku T, Kitazato H. 2009. Foraminifera promote calcification by elevating their intracellular pH. Proc. Natl. Acad. Sci. USA, 106(36): 15 374-15 378.
DOI:10.1073/pnas.0904306106 |
DeBoer J A, Webber C M, Dixon T A, Pope K L. 2016. The influence of a severe reservoir drawdown on springtime zooplankton and larval fish assemblages in Red Willow Reservoir, Nebraska. J. Freshwater Ecol., 31(1): 131-146.
DOI:10.1080/02705060.2015.1055312 |
Deng Y, Jiang Y H, Yang Y F, He Z L, Luo F, Zhou J Z. 2012. Molecular ecological network analyses. BMC Bioinf., 13: 113.
DOI:10.1186/1471-2105-13-113 |
Deng Y, Zhang P, Qin Y J, Tu Q C, Yang Y F, He Z L, Schadt C W, Zhou J Z. 2016. Network succession reveals the importance of competition in response to emulsified vegetable oil amendment for uranium bioremediation. Environ. Microbiol., 18(1): 205-218.
DOI:10.1111/1462-2920.12981 |
Duarte L N, Coelho F J R C, Cleary D F R, Bonifácio D, Martins P, Gomes N C M. 2019. Bacterial and microeukaryotic plankton communities in a semiintensive aquaculture system of sea bass (Dicentrarchus labrax): a seasonal survey. Aquaculture, 503: 59-69.
DOI:10.1016/j.aquaculture.2018.12.066 |
Edgar R C. 2010. Search and clustering orders of magnitude faster than BLAST. Bioinformatics, 26(19): 2 460-2 461.
DOI:10.1093/bioinformatics/btq461 |
Faust K, Raes J. 2012. Microbial interactions: from networks to models. Nat. Rev. Microbiol., 10(8): 538-550.
DOI:10.1038/nrmicro2832 |
Foysal J, Lisa A K. 2018. Isolation and characterization of Bacillus sp. strain BC01 from soil displaying potent antagonistic activity against plant and fish pathogenic fungi and bacteria. J. Genet. Eng. Biotechnol., 16(2): 387-392.
DOI:10.1016/j.jgeb.2018.01.005 |
Frenken T, Alacid E, Berger S A, Bourne E C, Gerphagnon M, Grossart H P, Gsell A S, Ibelings B W, Kagami M, Küpper F C, Letcher P M, Loyau A, Miki T, Nejstgaard J C, Rasconi S, Reñé A, Rohrlack T, Rojas-Jimenez K, Schmeller D S, Scholz B, Seto K, Sime-Ngando T, Sukenik A, Van de Waal D B, Van den Wyngaert S, Van Donk E, Wolinska J, Wurzbacher C, Agha R. 2017. Integrating chytrid fungal parasites into plankton ecology: research gaps and needs. Environ. Microbiol., 19(10): 3 802-3 822.
DOI:10.1111/1462-2920.13827 |
Gong J, Dong J, Liu X H, Massana R. 2013. Extremely high copy numbers and polymorphisms of the rDNA operon estimated from single cell analysis of oligotrich and peritrich ciliates. Protist, 164(3): 369-379.
DOI:10.1016/j.protis.2012.11.006 |
Guimerà R, Sales-Pardo M, Amaral L A N. 2007. Classes of complex networks defined by role-to-role connectivity profiles. Nat. Phys., 3(1): 63-69.
DOI:10.1038/nphys489 |
Hong B, Sun Z Z, Zhang Y P, Zeng Z C, Tian Z Q. 2009. Evaluation on effect of fishery resource enhancement and release in Huangpujiang upstream. Fish. Sci. Technol. Inf., 36(4): 178-181.
(in Chinese) |
Hu A Y, Li S, Zhang L P, Wang H J, Yang J, Luo Z X, Rashid A, Chen S Q, Huang W X, Yu C P. 2018. Prokaryotic footprints in urban water ecosystems: a case study of urban landscape ponds in a coastal city, China. Environ. Pollut., 242: 1 729-1 739.
DOI:10.1016/j.envpol.2018.07.097 |
Huang Y L, Huang J L. 2019. Coupled effects of land use pattern and hydrological regime on composition and diversity of riverine eukaryotic community in a coastal watershed of Southeast China. Sci. Total Environ., 660: 787-798.
DOI:10.1016/j.scitotenv.2019.01.063 |
Huisman J, Matthijs H C P, Visser P M. 2005. Harmful Cyanobacteria. Springer, Dordrecht. https://doi.org/10.1007/1-4020-3022-3.
|
Ibelings B W, De Bruin A, Kagami M, Rijkeboer M, Brehm M, Van Donk E. 2004. Host parasite interactions between freshwater phytoplankton and chytrid fungi(Chytridiomycota). J. Phycol., 40(3): 437-453.
DOI:10.1111/j.1529-8817.2004.03117.x |
Isabwe A, Ren K X, Wang Y M, Peng F, Chen H H, Yang J. 2019. Community assembly mechanisms underlying the core and random bacterioplankton and microeukaryotes in a river-reservoir system. Water, 11(6): 1127.
DOI:10.3390/w11061127 |
Isabwe A, Yang J R, Wang Y M, Liu L M, Chen H H, Yang J. 2018. Community assembly processes underlying phytoplankton and bacterioplankton across a hydrologic change in a human-impacted river. Sci. Total Environ., 630: 658-667.
DOI:10.1016/j.scitotenv.2018.02.210 |
James T Y, Letcher P M, Longcore J E, Mozley-Standridge S E, Porter D, Powell M J, Griffith G W, Vilgalys R. 2006. A molecular phylogeny of the flagellated fungi(Chytridiomycota) and description of a new phylum(Blastocladiomycota). Mycologia, 98(6): 860-871.
DOI:10.3852/mycologia.98.6.860 |
Kinnula H, Mappes J, Valkonen J K, Pulkkinen K, Sundberg L R. 2017. Higher resource level promotes virulence in an environmentally transmitted bacterial fish pathogen. Evol. Appl., 10(5): 462-470.
DOI:10.1111/eva.12466 |
Lefèvre E, Roussel B, Amblard C, Sime-Ngando T. 2008. The molecular diversity of freshwater picoeukaryotes reveals high occurrence of putative parasitoids in the plankton. PLoS One, 3(6): e2324.
DOI:10.1371/journal.pone.0002324 |
Liu J, Soininen J, Han B P, Declerck S A J. 2013a. Effects of connectivity, dispersal directionality and functional traits on the metacommunity structure of river benthic diatoms. J. Biogeogr., 40(12): 2 238-2 248.
DOI:10.1111/jbi.12160 |
Liu L M, Chen H H, Liu M, Yang J R, Xiao P, Wilkinson D M, Yang J. 2019. Response of the eukaryotic plankton community to the cyanobacterial biomass cycle over 6 years in two subtropical reservoirs. ISME J., 13(9): 2 196-2 208.
DOI:10.1038/s41396-019-0417-9 |
Liu L M, Yang J, Lv H, Yu X Q, Wilkinson D M, Yang J. 2015. Phytoplankton communities exhibit a stronger response to environmental changes than bacterioplankton in three subtropical reservoirs. Environ. Sci. Technol., 49(18): 10 850-10 858.
DOI:10.1021/acs.est.5b02637 |
Liu L M, Yang J, Yu X Q, Chen G J, Yu Z. 2013b. Patterns in the composition of microbial communities from a subtropical river: effects of environmental, spatial and temporal factors. PLoS One, 8(11): e81232.
DOI:10.1371/journal.pone.0081232 |
Lv H, Yang J, Liu L M. 2013. Temporal pattern prevails over spatial variability in phytoplankton communities from a subtropical water supply reservoir. Oceanol. Hydrobiol. Stud., 42(4): 420-430.
DOI:10.2478/s13545-013-0098-3 |
May R M. 2001. Stability and Complexity in Model Ecosystems. Princeton University Press, Princeton.
|
Meyers S D, Linville A J, Luther M E. 2014. Alteration of residual circulation due to large-scale infrastructure in a coastal plain estuary. Estuar. Coast., 37(2): 493-507.
DOI:10.1007/s12237-013-9691-3 |
Neutel A M, Heesterbeek J A P, Van De Koppel J, Hoenderboom G, Vos A, Kaldeway C, Berendse F, De Ruiter P C. 2007. Reconciling complexity with stability in naturally assembling food webs. Nature, 449(7162): 599-602.
DOI:10.1038/nature06154 |
Ortiz-Cañavate B K, Wolinska J, Agha R. 2019. Fungicides at environmentally relevant concentrations can promote the proliferation of toxic bloom-forming cyanobacteria by inhibiting natural fungal parasite epidemics. Chemosphere, 229: 18-21.
DOI:10.1016/j.chemosphere.2019.04.203 |
Peng B, Wang Y N, Zhang H J, Chen C, Luo H L, Wang M. 2019. Ecological assessment of phytoplankton community via microscopic method and 18S rRNA gene sequencing in Pearl River Estuary. E3S Web Conf., 131: 01043.
DOI:10.1051/e3sconf/201913101043 |
Priscu J C. 1995. Phytoplankton nutrient deficiency in lakes of the McMurdo Dry Valleys, Antarctica. Freshwater Biol., 34(2): 215-227.
DOI:10.1111/j.1365-2427.1995.tb00882.x |
Saylor R K, Miller D L, Vandersea M W, Bevelhimer M S, Schofield P J, Bennett W A. 2010. Epizootic ulcerative syndrome caused by Aphanomyces invadans in captive bullseye snakehead Channa marulius collected from South Florida, USA. Dis. Aquat. Org., 88(2): 169-175.
DOI:10.3354/dao02158 |
Shade A, Peter H, Allison S D, Baho D L, Berga M, Bürgmann H, Huber D H, Langenheder S, Lennon J T, Martiny J B H, Matulich K L, Schmidt T M, Handelsman1 J. 2012. Fundamentals of microbial community resistance and resilience. Front. Microbiol., 3: 417.
DOI:10.3389/fmicb.2012.00417 |
Shetye S S, Kurian S, Naik H, Gauns M, Chndrasekhararao A V, Kumar A, Naik B. 2019. Variability of organic nitrogen and its role in regulating phytoplankton in the eastern Arabian Sea. Mar. Pollut. Bull., 141: 550-560.
DOI:10.1016/j.marpolbul.2019.02.036 |
Steele J A, Countway P D, Xia L, Vigil P D, Beman J M, Kim D Y, Chow C E T, Sachdeva R, Jones A C, Schwalbach M S, Rose J M, Hewson I, Patel A, Sun F Z, Caron D A, Fuhrman J A. 2011. Marine bacterial, archaeal and protistan association networks reveal ecological linkages. ISME J., 5(9): 1 414-1 425.
DOI:10.1038/ismej.2011.24 |
Su Z F, Wu J M, Liu W Y, He J J, Xu J H. 2014. Study on assessment of enhancement effect of fishery stock in Changzhou City. Mod. Agric. Sci. Technol., (12): 261-262, 264.
(in Chinese with English abstract) |
Sun W, Xia C Y, Xu M Y, Guo J, Sun G P, Wang A J. 2014. Community structure and distribution of planktonic ammonia-oxidizing Archaea and bacteria in the Dongjiang River, China. Res. Microbiol., 165(8): 657-670.
DOI:10.1016/j.resmic.2014.08.003 |
Tasevska O, Jersabek C D, Kostoski G, Gušeska D. 2012. Differences in rotifer communities in two freshwater bodies of different trophic degree (Lake Ohrid and Lake Dojran, Macedonia). Biologia, 67(3): 565-572.
DOI:10.2478/s11756-012-0041-x |
Tong Y Y. 2001. Analysis on the status and constraints of fishery resources development and utilization in the lower reaches of the Qiantang River. Chin. Fish, (4): 18-19.
(in Chinese) |
Vrebos D, Beauchard O, Meire P. 2017. The impact of land use and spatial mediated processes on the water quality in a river system. Sci. Total Environ.: 601-602.
DOI:10.1016/j.scitotenv.2017.05.217 |
Wan Y, Xu L L, Hu J, Xu C, Wan A, An S Q, Chen Y S. 2015. The role of environmental and spatial processes in structuring stream macroinvertebrates communities in a large river basin. Clean-Soil, Air, Water, 43(12): 1 633-1 639.
DOI:10.1002/clen.201300861 |
Wang Z H. 1995. Protection and exploition of fishery resources in the Qiantang River. Chin. J. Fish., 8(2): 9-17, 8.
(in Chinese) |
Wen X L, Xi Y L, Qian F P, Zhang G, Xiang X L. 2011. Comparative analysis of rotifer community structure in five subtropical shallow lakes in East China: role of physical and chemical conditions. Hydrobiologia, 661(1): 303-316.
DOI:10.1007/s10750-010-0539-6 |
Xue Y Y, Chen H H, Yang J R, Liu M, Huang B Q, Yang J. 2018. Distinct patterns and processes of abundant and rare eukaryotic plankton communities following a reservoir cyanobacterial bloom. ISME J., 12(9): 2 263-2 277.
DOI:10.1038/s41396-018-0159-0 |
Zhang A J, Liu J D, Yang Y J, Guo A H, Gu Z M. 2016. Analysis of community characteristics of macrozoobenthos in enhancement and releasing zone in Tonglu section of Qiantang River. Acta Agric. Zhejiang, 28(8): 1 323-1 331.
(in Chinese with English abstract) |
Zhang H J, Huang X L, Huang L, Bao F J, Xiong S L, Wang K, Zhang D M. 2018a. Microeukaryotic biogeography in the typical subtropical coastal waters with multiple environmental gradients. Sci. Total Environ., 635: 618-628.
DOI:10.1016/j.scitotenv.2018.04.142 |
Zhang K, Jiang F Y, Chen H, Dibar D T, Wu Q L, Zhou Z Z. 2019. Temporal and spatial variations in zooplankton communities in relation to environmental factors in four floodplain lakes located in the middle reach of the Yangtze River, China. Environ. Pollut., 251: 277-284.
DOI:10.1016/j.envpol.2019.04.139 |
Zhang X M, Wang X J, Tu Z, Zhang P D, Wang Y Z, Gao T X, Wang S J. 2009. Current status and prospect of fisheries resource enhancement in Shandong Province. Chin. Fish. Econ., 27(2): 51-58.
(in Chinese with English abstract) |
Zhang Y Z, Zheng S J, Zhang W P. 2018b. The assessment of releasing and enhancement of fishery resources in the Qiantang River. J. Zhejiang Norm. Univ. (Nat. Sci.), 41(1): 97-101.
(in Chinese with English abstract) |
Zhao K, Song K, Pan Y D, Wang L Z, Da L J, Wang Q X. 2017. Metacommunity structure of zooplankton in river networks: roles of environmental and spatial factors. Ecol. Indic., 73: 96-104.
DOI:10.1016/j.ecolind.2016.07.026 |
Zorzal-Almeida S, Salim A, Andrade M R M, de Novaes Nascimento M, Bini L M, Bicudo D C. 2018. Effects of land use and spatial processes in water and surface sediment of tropical reservoirs at local and regional scales. Sci. Total Environ., 644: 237-246.
DOI:10.1016/j.scitotenv.2018.06.361 |