 2021, Vol. 39
Institute of Oceanology, Chinese Academy of Sciences
Article Information
- SUN Yu, ZHANG Chi, TIAN Yongjun, WATANABE Yoshiro
- Age, growth, and mortality rate of the yellow goosefish Lophius litulon (Jordan, 1902) in the Yellow Sea
- Journal of Oceanology and Limnology, 39(2): 732-740
- http://dx.doi.org/10.1007/s00343-019-9216-4
Article History
- Received Aug. 24, 2019
- accepted in principle Oct. 5, 2019
- accepted for publication Nov. 21, 2019


2 Laboratory for Marine Fisheries Science and Food Production Processes, Pilot National Laboratory for Marine Science and Technology, Qingdao 266003, China;
3 Atmosphere and Ocean Research Institute, University of Tokyo, 5-1-5 Kashiwanoha, Kashiwa, Chiba 277-8564, Japan
The yellow goosefish Lophius litulon is a temperate demersal species occurring in the coastal waters of China, Japan, and Korea (Yoneda et al., 1997, 2001; Fariña et al., 2008). In China, L. litulon is distributed in mainly the Yellow Sea because of the suitable habitat provided by the Yellow Sea Cold Water Mass (YSCWM) (Fig. 1) (Wei et al., 2016) and form a regional population specific to the Yellow Sea (Yamada et al., 2007). The population seasonally migrates between inshore and offshore waters during a spawning season from February to May, and extend its range into the East China Sea during winter and spring (Yamada, 1986; Yoneda et al., 1997, 2001). As a top predator, L. litulon exerts a top-down control on the Yellow Sea ecosystem (Xu and Jin, 2005; Jin et al., 2010). The species is also important as a secondary target species in the commercial fisheries. The commercial and ecological importance of L. litulon is further increasing with the concomitant decline of conventional fisheries resources in the Yellow Sea (Jin and Tang, 1996).

|
| Fig.1 Sample areas (shaded) of L. litulon in the Yellow Sea NYS: the northern Yellow Sea; SYS: the southern Yellow Sea; YSCWN (labeled area): the Yellow Sea Cold Water Mass. |
As a marginal sea located in the northwest Pacific Ocean, the Yellow Sea has experienced dramatic environmental changes and is one of the most highly exploited of the world's large marine ecosystems (Jin et al., 2010; Park et al., 2011, 2015; Pang et al., 2018; Ma et al., 2019). Long-term fishing pressures and environmental changes have resulted in variations in species diversity, community structure, and food webs in the Yellow Sea ecosystem and also have influenced the dynamics of L. litulon directly or indirectly (Jin and Tang, 1996; Xu and Jin, 2005; Jin et al., 2010; Pang et al., 2018; Ma et al., 2019). Since 1985, length composition of L. litulon populations significantly decreased from double peaks to a single peak (Li et al., 2015). However, the length-weight relationship transformed from negative allometric growth to isometric (Li et al., 2015). In spite of increased high fishing pressure, the population distribution showed a northwards shift and the increasing relative stock density indicated a recovery potential (Li et al., 2015). These changes suggest complex population dynamics of L. litulon responding both to fishing and to environmental pressures. Therefore, an updated assessment of life history parameters and stock status for L. litulon is necessary for prudent management. Information from population dynamics, age, growth, and mortality are essential for fisheries management because stock assessment models rely on biological parameters (Hilborn and Walters, 1992; Campana, 2001). However, since Yoneda et al. (1997) reported age and growth of L. litulon in the Yellow and East China Seas (Yoneda et al., 1997), there has been no systematic study in the subsequent past two decades.
To fill the knowledge gap concerning L. litulon, we obtained length- and age- based biological data for L. litulon collected from survey and commercial trawls in the Yellow Sea. Demographics (size and age structures) and life history parameters (growth, total and natural mortality rates) were analyzed, and spatial differences were compared to identify appropriate management units for L. litulon. The aims of this work were to: 1) to estimate updated life history parameters for L. litulon in the Yellow Sea, 2) to compare these parameters with previous studies to understand changes under long-term fishing and environmental pressures, and 3) to provide recommendations for developing appropriate fisheries management strategies.
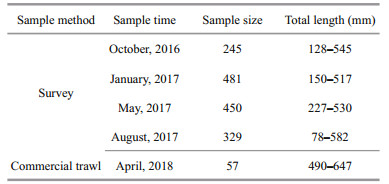
2 MATERIAL AND METHOD 2.1 Sample collectionSamples were collected from seasonal bottom trawl surveys in the central and northern Yellow Sea (35°N–38°30'N, 119°30'E–124°E) (Table 1; Fig. 1). Subsamples were randomly selected and taken back to the laboratory. In addition, larger individuals were collected from commercial bottom trawl fisheries for growth analysis (Table 1; Fig. 1), to augment the sampled size range of L. litulon. The Yellow Sea can be divided into the northern Yellow Sea (NYS) and the southern Yellow Sea (SYS) by a line drawn between Chengshantou on the Shandong Peninsula of China and Chang San-got in Korea (Wei et al., 2016). All samples were categorized as either from the NYS stock or from the SYS stock, depending on sampling site location, as a basis for analyzing spatial differences (Table 1; Fig. 1).
|
Total length (TL, mm) and body weight (W, g) of each individual was measured and sex determined in the laboratory through macroscopic examination of gonads. Sagittal otoliths were extracted through the gills, cleaned in ultrapure water, dried in the air, and then stored in plastic tubes.
2.2 Age estimationWe used the Sturge Method (Chen et al., 2008) to estimate an appropriate length frequency interval (determined to be 20 mm), and then partitioned our survey samples into length intervals for the purposes of random selection of aging samples (n ≤ 20 per interval).
Left otoliths were embedded in clear epoxy resin and a transverse section (0.5 mm) was cut through the otolith core with a precision low-speed saw (Buehler IsoMet with a diamond edged wafering blade). The section was mounted on a microscope slide and ground with waterproof abrasive paper until annual marks were clearly visible. The digital image of each section was captured using a Nikon microscope fitted with a digital camera (Fig. 2). Under transmitted light, otolith sections displayed a clear pattern of opaque and translucent zones, and one opaque and one translucent was considered as an annulus (Xu et al., 2010). Age-at-capture was determined based on the counts of completed opaque zones along the ventral ridge beside the sulcus (Fig. 2).

|
| Fig.2 Sagitta otolith section of L. litulon (TL=534 mm, 9 years old) The image displays white dots on the nine translucent zones plus one red dot on the core. Sectioned otoliths were aged along the ventral ridge beside the sulcus. |
Each sagittal otolith section was read twice with no knowledge of fish size or time of capture. When both counts were identical, the value was taken as the final age estimate. In case the two readings are inconsistent, a third reading was taken to determine a final age estimate.
2.3 Length-weight relationshipThe length-weight relationships for females and males was estimated by a non-linear least square regression method and R2 (coefficient of determination), which shows the robustness of the sample analyzed (Froese, 2006; Froese et al., 2014). Length and weight data were plotted in order to identify and exclude obvious outliers (Froese, 2006). The relationship was described with the exponential curve W=aLb that was converted into its logarithmic form log10W=log10a+blog10L, where W is the body weight (g); L is the total length (mm); a is the condition factor; and b is the allometric growth factor (Le Cren, 1951; Froese, 2006; Froese et al., 2011).
The slope b of WLRs was evaluated using a t-test at 0.05 significance level to examine whether the value was significantly different from the value 3. The comparison of WLRs between sexes was carried out using non-parametric ANOVA. All analyses were carried out using Microsoft Excel 2016 and SPSS Statistics 20.0.
2.4 Estimation of growth equation parametersLength-at-age data was fitted with the standard von Bertalanffy growth function (VBGF) (Von Bertalanffy, 1938) for females and males, NYS and SYS stocks of L. litulon respectively using non-linear regression (Haddon, 2015). The VBGF equation is as follows:
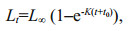
where L is mean asymptotic total length (mm), K is the curvature parameter and body growth coefficient (rate at which maximum size is attained) (/a); t is the age (years) of sample and t0 is the age at which the fish have a theoretical size of zero. The growth equation was fitted using least-squares estimation procedures embedded in the SOLVER routine that is contained in the Microsoft Excel software (Haddon, 2015; Romo-Curiel et al., 2015).
Residual sum of squares (ARSS) was used to statistically compare fitted growth curves between sexes and regions (Chen et al., 1992; Haddon, 2015).
2.5 Estimation of natural instantaneous mortality rateNatural instantaneous mortality rate, M (/a) was estimated using three age-based methods: 1. ln(M)=1.46–1.01 ln(tm) (Hoenig, 1983); 2. M=4.22/tm (Hewitt and Hoenig, 2005); 3. M=-ln(0.01)/tm (Quinn Ⅱ and Deriso, 1999), where tm is the observed maximum age in year (Gray et al., 2017). The observed maximum age of 14 years old for total samples, 14 years old for NYS stock and 13 years old for SYS stock were used in this study respectively. In addition, Pauly (1980) reported one length-based method that used regression analysis to yield the empirical estimation of a linear relationship as follows:
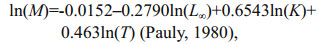
where L∞ (cm) and K (/a) are the von Bertalanffy growth function parameters, and T is the annual mean water temperature (℃) in the water layer the fish species inhabits (Gray et al., 2017). The values for T used were 17.02 ℃ and 18.15 ℃ for NYS and SYS stock respectively. Mortality rate was estimated for total samples, in which the NYS stock and SYS stock were treated separately.
2.6 Total mortality, fishing mortality and exploitation rateAge-based catch curve analysis (Ricker, 1975) was used to estimate the total instantaneous mortality rate, Z (/a). Catch curves were constructed by plotting the natural logarithm of the number of sampled fishes in each age class against their age class (t). Only age classes fully recruited to the fishing gear (modal age plus one), were used to estimate Z, which was determined as the absolute value of the slope of a linear regression equation (y=mx+b) fitted to the right limb of the curve (Beverton and Holt, 1957).
The instantaneous rate of fishing mortality F (/a) was estimated using the equation Z=M+F. The lowest and highest values of M (among the four methods) were subtracted from the corresponding values of Z (Gray et al., 2017) to obtain estimates of F. Then two estimates of exploitation ratio (E) were obtained by dividing F by Z.
3 RESULTA total of 1 505 L. litulon were analyzed in the laboratory, including 242 females, 675 males and 588 specimens with undetermined sex. The sex-ratio (males/females) is approximately 3:1. 354 otoliths were selected for section by random sampling of length intervals. Moreover, these samples were supplemented with 57 large individuals collected from commercial bottom trawlers in the SYS and NYS in April 2018. 45 sectioned otoliths from the 57 large individuals were also examined.
3.1 Length frequency distribution and length-weight relationshipFemales and males ranged in size from 173 to 582 mm and 178 to 500 mm, respectively (Fig. 3a). Females have a wider range of body length than males. No males were found over 500 mm. The average total length of females (TL=306 mm) was similar to that of males (TL=305 mm). The dominant length intervals of females (270.00–310.00 mm, 54.96%) and males (290 mm–330 mm, 64.59%) both showed a single peak.

|
| Fig.3 Frequency distribution on the total length of L. litulon a. for females and males; b. for NYS and SYS stocks. n denotes sample size used in the analysis. |
NYS and SYS stocks all have individuals larger than 500 mm (Fig. 3b). The mean total length of samples from NYS (TL=300 mm) was larger than that from SYS (TL=255 mm). The dominant length intervals of NYS showed a single peak (290–330 mm, 44.25%), while SYS showed double peaks (190–230 mm, 22.26% and 270–310 mm, 23.99%).
The relationship between TL (mm) and W (g) for females and males were as follows (Fig. 4).

|
| Fig.4 Length-weight relationship of L. litulon n: the sample size used in the analysis. |
Female: W=(2×10⁻⁶)TL3.3338 (n=239; R2=0.90);
Male: W=(1×10⁻⁵)TL3.0332 (n=635; R2=0.82).
The slope of the length-weight relationship of females (b=3.333 8) was significantly greater than 3 (t-test, P < 0.05), indicating positive allometric growth. There was no significant difference between the slope b of males (b=3.033 2) and 3 (t-test, P > 0.05), indicating no significant statistical basis for rejecting the notion of an isometric growth pattern for the males. The WLRs between sexes showed significant difference based on non-parametric ANOVA (P < 0.05).
3.2 Age compositionThe age-at-capture of 354 samples was determined by counting opaque zones of otolith sections (Fig. 2). The observed ages of fish were divided into 12 yearly age classes (Fig. 5a & b). Most of the ages were age-3 (3-year-old) (43.40%) for females while that was age-4 (28.68%) for males (Fig. 5a). The most abundant age was age-4 (22.73%) for NYS stock and age-3 (42.41%) for SYS stock (Fig. 5b). Fishes older than age-9 were much fewer in the samples.

|
| Fig.5 Age composition of L. litulon a. for females and males; b. for NYS and SYS stocks. n: the sample size used in the analysis. |
A significant difference in the growth between the sexes was detected (ARSS test: F=3.296, P=0.044) (Table 2; Fig. 6), while no significant difference was found between regions (ARSS test: F=0.077, P=0.972) (Table 2).


|
| Fig.6 The comparison of growth and length-at-age between females and males of L. litulon The growth equations: Lt=765(1–e-0.102(t+1.106)) for females and Lt=579(1–e-0.162(t+0.718)) for males. n: the sample size used in the analysis. |
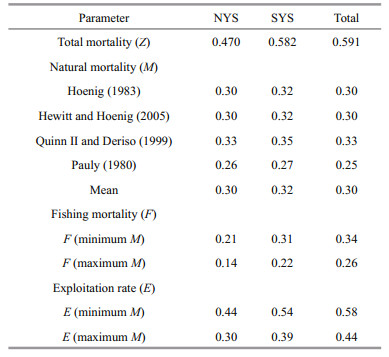
Z, M, and F were separately estimated for NYS stock, for SYS stock and for total samples (Table 3). L. litulon fully recruited to the fishing gear by age-3 for SYS and total samples, and by age-4 for NYS The growth equations: Lt=765(1–e-0.102(t+1.106)) for females and Lt=579(1–e-0.162(t+0.718)) for males. n: the sample size used in the analysis.
|
This study provides the first new information on the life history and demographics of L. litulon in the Yellow Sea since Yoneda et al. (1997), and provides the first estimates of mortality and exploitation rates for this species. The results contribute to understanding of the current stock status, of changes to stock health due to long-term fishing and environmental pressures on the regional population, and support recommendations for management.
The distribution of L. litulon has shifted northwards in recent years (Li et al., 2015), hypothetically as a first response of the population to environmental change (e.g., global climate warming). The resulting spatial unbalance could mislead resource assessment by managers, and then increase the risk of regional depletion (Link et al., 2011). In this case, life history parameters could be used as fundamental descriptors for interregional comparisons (Begg et al., 1999). Differing patterns of length frequency distribution and associate age compositions showed that both the overall total length and the ages of the NYS stock were larger than those of the SYS stock. But our analyses also finds that the NYS and SYS stocks have similar growth and mortality rates, which may suggest that the Yellow Sea population could be appropriately managed as a single unit (Begg et al., 1999). This apparent inconsistency may be related to the sampling process. It is therefore imperative to conduct more studies to better verify whether there are indeed important spatial differences arising from the northward shift of the stock distribution area.
The length distribution when both females and males were combined together showed a significant single peak, 270–310 mm individuals occupy the majority. This result is consistent with the result of Li et al. (2015), and provides a further support to the simplification of the population structure of L. litulon. However, the average total length in this study increased compared to 2000s and was similar with that found in 1985, providing another evidence for resource recovery except for the increasing relative density. Moreover, the age composition of females and males found in our study is similar to that found in 1985 (Li et al., 2015), namely, age-3 and age-4 classes appear to be the most numerous. Such relatively stable age structure could be a reason that L. litulon has been able to sustain long-term fishing pressure and recover under favorite circumstances.
The slope b of a length-weight relationship represents an allometric growth factor, which reflects heterogeneity of growth and development (Froese, 2006). Being less affected by sexual maturity, the allometric growth factor of males may better reflect the condition of the population as a whole (Li et al., 2011), suggesting that the entire population of L. litulon in central and northern Yellow Sea may have experienced isometric growth. Our results seem to support the conclusion by Li et al. (2015) that L. litulon population shows a tendency towards isometric growth (Froese, 2006), namely individuals of the same length currently being on average heavier compared to 2000s and 1990s. Condition reflects multiple factors experienced by individuals over moderate time scales (Vila-Gispert and Moreno-Amich, 2001; Lloret et al., 2002), and at the population level, a better condition may be associated with increased rates of survival, as well as with the ability to endure exploitation (Rätz and Lloret, 2003; Stevenson and Woods, 2006). Since higher-quality habitats generally yield higher condition, such a trend also suggests a potential for recovery of L. litulon. The better feeding conditions could be a reason for condition changes, since other species (e.g. Trichiurus japonicas and Cleisthenes herzensteini) declined and consequently the food competition faced by L. litulon weakened (Li, 2011). The warming temperature could also have promoted individual growth, as there is a positive relationship between annual yields of L. litulon and sea surface temperature (Li, 2011).
The VBGF differ significantly between sexes, and the estimated total length for females was greater than males (Yoneda et al., 1997; Fariña et al., 2008). Yoneda et al. (1997) reported that the VBGF for females Lt=1 547(1–e-0.064(t+0.345)) (t≤13) and males Lt=1 130(1–e-0.08(t+0.401)) (t≤8) (Table 2). Compared with the growth equation calculated in present report, it is obvious that the mean asymptotic total length L∞ decreased by about half while the curvature parameter K doubled. Such differences in L∞ and K may be related to the different calcified structures used for age estimation (Li et al., 2015). The vertebral may underestimate actual age (Takeya et al., 2017), which may lead to deviations in estimating growth parameters, but comparative validation of two calcified structures is lacked. Further research on the accuracy of otolith and vertebral of L. litulon for age estimation is still needed. Moreover, the continuing heavy fishery pressure and environmental perturbations may also be reasons for the decrease of asymptotic body length and the increase of the speed in reaching asymptotic body length of the regional population.
We used four natural mortality estimation methods to derive a relatively certain range for the real value of M (Gray et al., 2017). The optimum exploitation level of fish population is 0.5, a value of E greater than 0.5 may be indicative of a heavily fished population (Patterson, 1992; Sun et al., 2013; Gray et al., 2017). The current exploitation rate has been around 0.5, suggesting that the population of L. litulon in central and northern Yellow Sea may be sustainable. However, under the assumption that only growth and mortality need be considered, Russell (1942) reported that from the perspective of maximum yield, by the use of standard yield-per-recruitment analysis, the optimal fishing mortality rate Fmax was 0.23/a (Haddon, 2015). Thus, fishery regulators might pay more attention to L. litulon and take reasonable management strategies to reduce fishing intensity.
5 CONCLUSIONThis analysis of demographic parameters suggests that the regional population of L. litulon in the Yellow Sea has experienced a depletion-recovery process over the past 30 years. This may be the result of a variety of factors, including fishing pressure and environmental perturbations, and so further confirmation of these various impacts is needed. Although the characteristics of L. litulon itself may make it quite resilient to fishing, the fishery management department also should take effective measures to reduce fishing pressure and to ensure the restoration of population resources. These data presented here may also provide background references for a broader study of the fishery resources of the Yellow Sea ecosystem.
6 DATA AVAILABILITY STATEMENTThe data generated or analyzed during the current study are available from the corresponding author on reasonable request.
7 ACKNOWLEDGMENTWe thank the investigators who participated in the seasonal bottom trawl survey.
Begg G A, Hare J A, Sheehan D D. 1999. The role of life history parameters as indicators of stock structure. Fisheries Research, 43(1-3): 141-163.
DOI:10.1016/s0165-7836(99)00071-5 |
Beverton R J H, Holt S J. 1957. On the Dynamics of Exploited Fish Populations. Her Majestys Stationery Office, London. p. 1-533.
|
Campana S E. 2001. Accuracy, precision and quality control in age determination, including a review of the use and abuse of age validation methods. Journal of Fish Biology, 59(2): 197-242.
DOI:10.1111/j.1095-8649.2001.tb00127.x |
Chen G B, Li Y Z, Chen P M, Shu L M. 2008. Optimum interval class size of length-frequency analysis of fish. Journal of Fishery Sciences of China, 15(4): 659-666.
(in Chinese with English abstract) |
Chen Y, Jackson D A, Harvey H H. 1992. A comparison of von Bertalanffy and polynomial functions in modelling fish growth data. Canadian Journal of Fisheries and Aquatic Sciences, 49(6): 1228-1235.
DOI:10.1139/f92-138 |
Fariña A C, Azevedo M, Landa J, Duarte R, Sampedro P, Costas G, Torres M A, Cañás L. 2008. Lophius in the world: a synthesis on the common features and life strategies. ICES Journal of Marine Science, 65(7): 1272-1280.
DOI:10.1093/icesjms/fsn140 |
Froese R, Thorson J T, Reyes Jr R B. 2014. A Bayesian approach for estimating length-weight relationships in fishes. Journal of Applied Ichthyology, 30(1): 78-85.
DOI:10.1111/jai.12299 |
Froese R, Tsikliras A C, Stergiou K I. 2011. Editorial note on weight-length relations of fishes. Acta Ichthyologica et Piscatoria, 41(4): 261-263.
DOI:10.3750/aip2011.41.4.01 |
Froese R. 2006. Cube law, condition factor and weight-length relationships: history, meta-analysis and recommendations. Journal of Applied Ichthyology, 22(4): 241-253.
DOI:10.1111/j.1439-0426.2006.00805.x |
Gray C A, Barnes L M, Robbins W D, Van Der Meulen D E, Ochwada-Doyle F A, Kendall B W. 2017. Length- and age-based demographics of exploited populations of stout whiting, Sillago robusta Stead, 1908. Journal of Applied Ichthyology, 33(6): 1073-1082.
DOI:10.1111/jai.13464 |
Haddon M. 2015. Modelling and Quantitative Methods in Fisheries. Chen P M, Qin C X, Yuan H R, Jia X Y, Zhou W L, trans. 2nd edn. Ocean Press, Beijing, China. 367p. (in Chinese)
|
Hewitt D A, Hoenig J M. 2005. Comparison of two approaches for estimating natural mortality based on longevity. Fishery Bulletin, 103(2): 433-437.
|
Hilborn R, Walters C J. 1992. Quantitative Fisheries Stock Assessment: Choice, Dynamics & Uncertainty. Springer, Boston, MA. 570p.
|
Hoenig J M. 1983. Empirical use of longevity data to estimate mortality rates. Fishery Bulletin, 82(1): 898-903.
|
Jin X S, Tang Q S. 1996. Changes in fish species diversity and dominant species composition in the Yellow Sea. Fisheries Research, 26(3-4): 337-352.
DOI:10.1016/0165-7836(95)00422-X |
Jin X S, Zhang B, Xue Y. 2010. The response of the diets of four carnivorous fishes to variations in the Yellow Sea ecosystem. Deep Sea Research Part ò: Topical Studies in Oceanography, 57(11-12): 996-1000.
DOI:10.1016/j.dsr2.2010.02.001 |
Le Cren E D. 1951. The length-weight relationship and seasonal cycle in gonad weight and condition in the perch (Perca fluviatilis). Journal of Animal Ecology, 20(2): 201-219.
DOI:10.2307/1540 |
Li Z L, Jin X S, Shan X J, Dai F Q. 2011. Inter-annual changes on body weight-length relationship and relative fatness of small yellow croaker (Larimichthys polyactis). Journal of Fishery Sciences of China, 18(3): 602-610.
(in Chinese with English abstract) DOI:10.3724/SP.J.1118.2011.00602 |
Li Z L, Shan X J, Jin X S, Dai F Q, Lu H S. 2015. Interannual variations in the biological characteristics, distribution and stock density of anglerfish Lophius litulon in the central and southern Yellow Sea. Acta Ecologica Sinica, 35(12): 4007-4015.
(in Chinese with English abstract) DOI:10.5846/stxb201310262585 |
Li Z L. 2011. Interannual Changes in Biological Characteristics of Small Yellow Croaker Larimichthys polyactis, Pacific Cod Gadus macrocephalus and Anglerfish Lophius litulon in the Bohai Sea and Yellow Sea. The Institute of Oceanology, Chinese Academy of Sciences, Qingdao, China. p. 1-117. (in Chinese with English abstract)
|
Link J S, Nye J A, Hare J A. 2011. Guidelines for incorporating fish distribution shifts into a fisheries management context. Fish and Fisheries, 12(4): 461-469.
DOI:10.1111/j.1467-2979.2010.00398.x |
Lloret J, De Sola L G, Souplet A, Galzin R. 2002. Effects of large-scale habitat variability on condition of demersal exploited fish in the North-western Mediterranean. ICES Journal of Marine Science, 59(6): 1215-1227.
DOI:10.1006/jmsc.2002.1294 |
Ma S Y, Liu Y, Li J C, Fu C H, Ye Z J, Sun P, Yu H Q, Cheng J H, Tian Y J. 2019. Climate-induced long-term variations in ecosystem structure and atmosphere-ocean-ecosystem processes in the Yellow Sea and East China Sea. Progress in Oceanography, 175: 183-197.
DOI:10.1016/j.pocean.2019.04.008 |
Pang Y M, Tian Y J, Fu C H, Wang B, Li J C, Ren Y P, Wan R. 2018. Variability of coastal cephalopods in overexploited China Seas under climate change with implications on fisheries management. Fisheries Research, 208: 22-33.
DOI:10.1016/j.fishres.2018.07.004 |
Park K A, Lee E Y, Chang E, Hong S. 2015. Spatial and temporal variability of sea surface temperature and warming trends in the Yellow Sea. Journal of Marine Systems, 143: 24-38.
DOI:10.1016/j.jmarsys.2014.10.013 |
Park S, Chu P C, Lee J H. 2011. Interannual-to-interdecadal variability of the Yellow Sea Cold Water Mass in 1967-2008: characteristics and seasonal forcings. Journal of Marine Systems, 87(3-4): 177-193.
DOI:10.1016/j.jmarsys.2011.03.012 |
Patterson K. 1992. Fisheries for small pelagic species: an empirical approach to management targets. Reviews in Fish Biology and Fisheries, 2(4): 321-338.
DOI:10.1007/BF00043521 |
Pauly D. 1980. On the interrelationships between natural mortality, growth parameters, and mean environmental temperature in 175 fish stocks. ICES Journal of Marine Science, 39(2): 175-192.
DOI:10.1093/icesjms/39.2.175 |
Quinn Ⅱ T J, Deriso R B. 1999. Quantitative Fish Dynamics. Oxford University Press, Oxford. 542p.
|
Rätz H J, Lloret J. 2003. Variation in fish condition between Atlantic cod (Gadus morhua) stocks, the effect on their productivity and management implications. Fisheries Research, 60(2-3): 369-380.
DOI:10.1016/S0165-7836(02)00132-7 |
Ricker W E. 1975. Computation and interpretation of biological statistics of fish populations. Bulletin of the Fisheries Research Board of Canada, 191: 1-382.
|
Romo-Curiel A E, Herzka S Z, Sosa-Nishizaki O, Sepulveda C A, Aalbers S A. 2015. Otolith-based growth estimates and insights into population structure of White Seabass, Atractoscion nobilis, off the Pacific coast of North America. Fisheries Research, 161: 374-383.
DOI:10.1016/j.fishres.2014.09.004 |
Russell E S. 1942. The Overfishing Problem. Cambridge University Press, Cambridge.
|
Stevenson R D, Woods Jr W A. 2006. Condition indices for conservation: new uses for evolving tools. Integrative and Comparative Biology, 46(6): 1169-1190.
DOI:10.1093/icb/icl052 |
Sun G W, Shen J Z, Hu S D, Gong C, Wang H S, Huang D. 2013. Age, growth and mortality of Pseudobrama simoni (Bleeker) in Tian-e-zhou Oxbow of the Yangtze River. Freshwater Fisheries, 43(4): 29-34.
(in Chinese with English abstract) DOI:10.3969/j.issn.1000-6907.2013.04.006 |
Takeya Y, Takatsu T, Yamanaka T, Shibata Y, Nakaya M. 2017. Use of the illicium for age determination and verification of yellow goosefish Lophius litulon off Aomori Prefecture, northern Japan. Nippon Suisan Gakkaishi, 83(1): 9-17.
DOI:10.2331/suisan.16-00041 |
Vila-Gispert A, Moreno-Amich R. 2001. Fish condition analysis by a weighted least squares procedure: testing geographical differences of an endangered Iberian cyprinodontid. Journal of Fish Biology, 58(6): 1658-1666.
DOI:10.1111/j.1095-8649.2001.tb02320.x |
Von Bertalanffy L. 1938. A quantitative theory of organic growth (inquiries on growth laws. ò). Human Biology, 10(2): 181-213.
|
Wei Q S, Li X S, Wang B D, Fu M Z, Ge R F, Yu Z G. 2016. Seasonally chemical hydrology and ecological responses in frontal zone of the central southern Yellow Sea. Journal of Sea Research, 112: 1-12.
DOI:10.1016/j.seares.2016.02.004 |
Xu B D, Jin X S. 2005. Variations in fish community structure during winter in the southern Yellow Sea over the period 1985-2002. Fisheries Research, 71(1): 79-91.
DOI:10.1016/j.fishres.2004.07.011 |
Xu K D, He Z T, Li P F, Xue L J, Zhu W B. 2010. Age and growth of Lophius litulon in North of the East China Sea and south of the Yellow Sea. Progress in Fishery Sciences, 31(6): 9-14.
(in Chinese with English abstract) DOI:10.3969/j.issn.1000-7075.2010.06.002 |
Yamada U, Tokimura M, Horikawa H, Nakabo T. 2007. Fishes and fisheries of the East China and Yellow Seas. Tokai University Press, Kanagawa, Japan.
|
Yamada U. 1986. Lophiomus setigerus and Lophius litulon. In: Yamada U, Tagawa M, Kishida S, Honjo K eds. Fishes of the East China Sea and the Yellow Sea. Seikai Regional Fisheries Research Laboratory, Nagasaki, p. 106-109. (in Japanese)
|
Yoneda M, Tokimura M, Fujita H, Takeshita N, Takeshita K, Matsuyama M, Matsuura S. 2001. Reproductive cycle, fecundity, and seasonal distribution of the anglerfish Lophius litulon in the East China and Yellow seas. Fishery Bulletin, 99(2): 356-370.
|
Yoneda M, Tokimura M, Fujita H, Takeshita N, Takeshita K, Matsuyama M, Matsuura S. 1997. Age and Growth of anglerfish Lophius litulon in the East China Sea and the Yellow Sea. Fisheries Science, 63(6): 887-892.
DOI:10.2331/fishsci.63.887 |