 2021, Vol. 39
Institute of Oceanology, Chinese Academy of Sciences
Article Information
- WANG Feng, WEI Yuqiu, YUE Jiaqi, GUO Congcong, SUN Jun
- Distribution and environmental impact factors of picophytoplankton in the East China Sea during spring
- Journal of Oceanology and Limnology, 39(4): 1316-1327
- http://dx.doi.org/10.1007/s00343-020-0230-3
Article History
- Received Jun. 14, 2020
- accepted in principle Jul. 20, 2020
- accepted for publication Sep. 3, 2020


2 College of Marine Science and Technology, China University of Geosciences(Wuhan), Wuhan 430074, China;
3 Research Centre for Indian Ocean Ecosystem, Tianjin University of Science and Technology, Tianjin 300457, China
Phytoplankton is the dominant contributor to both primary production and biomass in the marine ecosystems (Metz et al., 2019). It is widely distributed in the epipelagic and photic zone in open oceanic regions (Li, 1994). In terms of the particle size, phytoplankton can be divided into three groups: microphytoplankton (20–200 μm), nanophytoplankton (2–20 μm) and picophytoplankton (Pico, 0.2–2 μm) (Takahashi and Bienfang, 1983; Hallegraeff and Jeffrey, 1984). Cells in picosized are greatly adapted to phytoplankton life, because they sink extremely slowly and are more effective at taking up nutrients and absorbing radiant energy than larger cells (Fogg, 1986). In addition, the small size makes them have higher nutrient utilization and carbon fixation ability (Guo et al., 2014). On the whole, owing to their high concentrations, wide distribution, and major contribution to nutrients and carbon cycling, Pico have been considered to play a critical role in marine ecosystems (Jiao et al., 2002) and have large impact on the global biogeochemical circulation (Wei et al., 2019b). Moreover, they have great significance for the formalization of the concept of the microbial loop (Azam et al., 1983). At least three types of Pico can be identified in the collection samples: Synechococcus (Syn), Prochlorococcus (Pro), and picoeukaryotes (PEuks) (Marie et al., 1997). At present, there are three common ways to quantify and identify the taxa of Pico, including flow cytometry (FCM) (Marie et al., 1997), electron microscopy (SEM) (Guillou et al., 1999), and molecular approaches (Wood, 1988). FCM is an instrument that used to determine the properties of single cells or other particles in suspension (Bohmer, 1987). It can reflect the cells size, shape structure, pigment types, and internal structure shown in the Pico autofluorescence. It can quickly complete quantitative and qualitative research on single-cell Pico, and even sort the cells. FCM analysis has provided significant new methodological capabilities in oceanography.
Syn and Pro are the most important primary producers in many oceanic environments among these autotrophic Pico (Chiang et al., 2002). Syn group is known to make a relatively large contribution to photosynthetic phytoplankton in nearshore or coastal waters (Jochem, 1988). In addition, Syn is one of the most important food sources for microzooplankton because of its rapid biomass cycle and high-energy conversion efficiency in the ocean microbial food web. Pro is the smallest cyanobacterial cells in oceans, it is usually dominant in stratified tropical oceanic environments, single and widely distributed, it has many adaptation mechanisms, for example, reducing cellular nutrient requirements and facilitating growth in the nutrient-poor environment (Read et al., 2017). Pro contains a unique photosynthetic pigment-divinyl chlorophyll, which can capture extremely weak light (Chisholm et al., 1992). The discovery of Pro has displaced Syn, and Pro becomes the most abundant marine autotrophs (Jiao et al., 2005). Although concentrations of the PEuks are much smaller than that of Syn and Pro, it is widely distributed in the Atlantic Ocean (Díez et al., 2001), Pactific Ocean (Short and Suttle, 2003) and the Mediterranean Sea (Díez et al., 2001). Furthermore, PEuks has turned out to be very diverse with Pico taxa distributed widely across several branches of the eukaryotic tree of life (Vaulot et al., 2008; Kuwata et al., 2018). The PEuks is more suited for efficient photosynthesis in the dim light at the bottom of the euphotic zone (Wood, 1985).
The East China Sea (ECS) is not only the largest marginal sea of the western North Pacific but also the most productive sea in China (Chiang et al., 2002; Gong and Liu, 2003; Gong et al., 2003). The entire sea area is on a continental shelf, and the average depth is about 349 m. The ECS has formed a huge low-salt water mass, which has become a eutrophic area in China offshore waters, with the salinity above 34. There are two major sources of nutrients: one is persistent upwelling located in the southern ECS, the other is Changjiang (Yangtze) River runoff (Chiang et al., 2002). In addition, the ECS was affected by oligotrophic water from the Kuroshio (Jiao et al., 2002). It thus ideally suits for ecological studies. Compared with the Bohai and the Yellow Sea, the ECS has higher temperature and salinity. Typically, the ECS has a tropical and subtropical climate. Such physicochemical and hydrographical conditions are conducive to the growth of Pico and complicate their distribution (Chen, 2000). The intrusion of the coastal current, Kuroshio into the continental shelf obviously caused variations in the distribution of temperature, salinity, nutrients and so on, and then consequently resulted in the variation of Pico community structure (Jiao et al., 2005).
Previous studies about Pico groups were obtained by epifluorescence microscopy (Vaulot and Ning, 1988), which was not as efficient, sensitive, and precise as FCM. Therefore, more efforts are needed for a better understanding of the dynamics and regulation mechanisms of Pico in such ecosystems. The purpose of this study was to investigate the structure and dynamics of these three groups as well as relevant diverse hydrographical and physicochemical conditions factors, in an attempt to understand the factors that affecting the distribution of these Pico in the ECS.
2 MATERIAL AND METHOD 2.1 Study areaThese data were obtained on the R/V Dongfanghong 2 cruise in May 2017. Our study area extended from 25°N to 30°N and from 121°E to 126°E in the ECS, and 27 stations were investigated. All stations were selected from the Changjiang River estuary to the north of Taiwan, China, and were assigned to transect A, B, and C (Fig. 1). The Changjiang River estuary was one of the important estuaries in China. The surrounding area had developed economy and prosperous industry. At the same time, it also had important fishing grounds and aquaculture areas. This water area was affected by water masses such as the Changjiang River diluted water, coastal currents, Taiwan warm current, and Kuroshio. The ecological environment was complex and changeable.

|
| Fig.1 The East China Sea sampling stations (a) and the schematic diagram of the circulation system (b) Modified from Yang et al., 2012; Noman et al., 2019. |
At each station, seawater samples were collected from 4 to 7 different depths within the upper 100-m water column using 12-L Niskin bottles equipped with a SeaBird CTD (SBE 9/11 plus). Physiochemical parameters such as salinity, temperature, and depth were also recorded in situ at the same time by the CTD sensors. For nutrients analysis, 250-mL seawater was collected and filtered through 0.45-μm cellulose acetate membrane filters and then immediately refrigerated at -20 ℃ for further analysis. Samples for FCM analysis were fixed with paraformaldehyde (final concentration: 1%), and then left to stand for 10–15 min in the dark at room temperature, so as not to loss of resolution and changes in cell counting due to fixation or freezing, then immediately freeze-trapped in liquid nitrogen until received at the laboratory (Marie et al., 1997).
2.3 Sample analysisAnalyzed for the nutrients concentrations including ammonium, phosphate, silicate, nitrate, and nitrite were performed by a Technicon AA3 Auto-Analyzer (Bran+Luebbe) according to the classical colorimetric methods. The nitrate and nitrite were measured using cadmium-copper column reduction and naphthylethylenediamine photometric method, respectively. The determination of silicate and phosphate was by silicon molybdenum blue spectrophotometry and phosphor molybdenum blue spectrophotometry, respectively (Dai et al., 2008).
FCM (Becton-Dickinson Accuri C6) was used to quantify the abundance of three Pico groups. FCM was considered very successful in the study of Pico (Troussellier et al., 1995). According to the spontaneous fluorescence characteristics of Pico, FCM can effectively detect and enumerate the Pico groups without stain fluorescein (Yentsch et al., 1983). FCM equipped with a laser emitting at 488 nm, the phycoerythrin and chlorophyll contained in Syn could be excited orange fluorescence (FL2) and red fluorescence (FL3) at 560–590 and 685 nm, respectively. Pro and PEuks contained chlorophyll only, which can emit red fluorescence only, thus Syn that can emit orange fluorescence could be distinguished out (Phinney and Cucci, 1989). At the same time, forward scatter light (FSC) was used to characterize cell size to distinguish Pro and PEuks. Pro was a small cell with weakly fluorescent, while PEuks was the group with larger cell size and stronger fluorescent (Wei et al., 2019a). We set the trigger threshold (~600) below the lowest scatter signals from surface Pro cells. It should be noted that in order to prevent the channel of FCM from being blocked by cells or impurities with larger particle size, we need to unclog and backflush the instrument when analyzing samples (Wei et al., 2019b). We collected 1.5 mL of seawater, and added 0.5 mL of paraformaldehyde, then only 196 μL of samples was used for analysis at a rate of 66 μL/min running for 3 min. Sample injection into the flow chamber is volumetric, allowing direct cell counts per μL to be obtained (Troussellier et al., 1995).
2.4 Estimation of Pico carbon biomassAt present, Pico biomass was usually estimated according to the carbon conversion coefficient of various groups. The carbon conversion coefficient commonly used in the international was adopted in this study. The carbon conversion coefficient of Syn was 250 fg C/cell, Pro was 53 fg C/cell, and that of PEuks was 2 100 fg C/cell. We had the equivalence (Crosbie and Furnas, 2001):
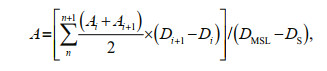
where A is the carbon biomass of Pico, n is the number of sampling layer; Ai is the Pico biomass (μg C/L) at sampling layer; Di is the depth at sampling layer i (m); DMSL is the maximum sampling layer (m), DS is the surface sampling layer (0 m) (Wei et al., 2020).
3 RESULT 3.1 Temperature and salinityDistribution of temperature and salinity in the surface water was shown in Fig. 2. The surface temperature varied from 20.03 ℃ to 31.26 ℃ and the average temperature was 23.22 ℃. The highest temperature appeared at station S03-02, and the lowest was at station S01-06. The surface salinity varied from 21.29 to 34.68, and the average salinity was 33.31. The highest salinity appeared at station S04-01, and the lowest was at station S03-02. The overall trends were that temperature was higher in the south and lower in the north, and the salinity was higher in the east than in the west. Waters of relatively high temperature (> 25 ℃) and salinity (> 32.5) occupied the northeast of Taiwan, China.

|
| Fig.2 Surface distributions of temperature (℃) (a) and salinity (b) |
In the surveyed seawater (Fig. 3), the surface concentration of ammonium ranged from 0.008 6 to 0.062 μmol/L, and the average concentration was 0.022 μmol/L. Station S04-03 had the highest concentration. The concentration of phosphate was between 0.000 2 and 0.002 4 μmol/L, and the average concentration was 0.001 2 μmol/L. Higher phosphate concentrations were mainly concentrated in section A. Station S01-07 had the highest concentration. The silicate concentration was between 0.021 and 0.286 μmol/L, with an average concentration of 0.096 μmol/L. Inshore silicate concentration was higher. Station L23-02 had the highest concentration. The nitrate concentration was between 0.003 and 0.139 μmol/L, and the average concentration was 0.035 μmol/L. Station L23-02 had the highest concentration. The concentration of nitrite was between 0.000 3 and 0.007 μmol/L, and the average concentration was 0.003 μmol/L. The distribution of nitrate and nitrite was approximately the same, with higher concentrations inshore. Station L23-02 had the highest concentration. Then we selected three sections from the study area to show the distribution of nutrients in more detail (Fig. 4), we found that nutrients were higher in the bottom, and gradually decreased from bottom to the surface layer.

|
| Fig.3 Surface distribution of nutrients in the ECS |

|
| Fig.4 Section distribution of nutrients along transects A, B, and C |
In our study, the cell abundance of different Pico groups we obtained were roughly of the same order as other studies conducted in the ECS (Pan et al., 2005). The horizontal distributions of Pico are shown in Fig. 5. Syn was the predominant group of Pico in the ECS, with a percentage of 65.32%. The PEuks and Syn were concentrated on the surface layer, and then the abundance was gradually decreased. However, Pro was concentrated in the subsurface layer. The abundance of PEuks was between 0.49×10²–1.44×10⁴ cells/mL. In the investigated sea area, PEuks group had the highest abundance in the coastal region, and then decreased in offshore. The maximum PEuks concentration was recorded at station S03-01 (10 m), and the minimum was at station S02-01 (bottom layer, 86 m). The cell abundance of Pro ranged from 1.36×10³–3.47×10⁴ cells/mL. The maximum Pro abundance was recorded at station S05-03 (30 m), and the minimum was at station S01-03 (30 m). Syn cell abundance ranged from 0.69×10³–1.15×10⁵ cells/mL. The maximum Syn concentration was recorded at station S05-06 (20 m), and the minimum was at station S01-03 (30 m). Both Pro and Syn groups had the lowest abundance in the Transect A, and then the abundance increased inshore, with the highest value appearing in the northeast of Taiwan, China. The vertical distribution of Pico abundance presented an apparent stratification phenomenon (Fig. 6). The distribution trend of Pico was first up and then down. The distribution of PEuks and Pro abundance increased gradually from 0 to 40 m depth and reached the maximum at 40 m. Thereafter, the abundance dropped to a minimum from 60 m to the bottom layer. Nevertheless, the Syn abundance reached the maximum at 20 m, and then dropped to minimum from 40 m to the bottom layer. Syn abundance was higher than PEuks and Pro.

|
| Fig.5 Horizontal distribution of different Pico taxonomic abundance (cells/mL) in the surface, middle, and bottom layers |

|
| Fig.6 Vertical distribution of Pico abundance in the study area (cells/mL) a. picoeukaryotes; b. Prochlorococcus; c. Synechococcus. |
In our study (Fig. 7), Syn was the main contributor to Pico carbon biomass, with a percentage of 52.72% in the ECS. Moreover, the proportion of Syn was more than that of PEuks (42.41%) and Pro (4.87%).

|
| Fig.7 Spatial distributions of depth-weighted average carbon biomass of picoeukaryote, Synechococcus, and Prochlorococcus |
Using RStudio to analyze the correlation between Pico and environmental factors, the result was shown in the Fig. 8. The environmental factors in this study included: temperature, salinity, depth, and nutrients (nitrate, nitrite, silicate, phosphate, and ammonium). Three Pico groups had different distribution characteristics in the marine ecosystem (Fig. 6). PEuks and Syn mainly existed in the surface layer, Pro preferred the subsurface layer. In general, temperature was necessary for the growth and reproduction of Pico. Indeed, a significant negative correlation existed between the three groups of Pico and depth. The light irradiation decreased with the increase of seawater depth, which leads to the decrease of Pico abundance. For taxa of Syn, strains showed a significant positive correlation with temperature. A recently published study found that as the temperature rose to 27 ℃, the growth rate of the Syn increased all the time without reaching a plateau (Mackey et al., 2013). Mackey et al. (2013) concluded that Syn was able to regulate photochemistry in a certain temperature range by transforming state and changing the abundance of photosynthetic proteins. Syn has developed a mechanistic of temperature acclimation strategies to be in favor of the larger geographic range of this group. According to the above foundation, the relation between Syn and temperature can be well explained. There was a significant positive correlation between PEuks and temperature, which indicated that temperature was an important control factor for PEuks distribution. Besides, PEuks group had a negative correlation with phosphate. Furthermore, temperature was a more important regulating factor than nutrients, salinity, and depth for PEuks. Meanwhile, Syn group showed a positive correlation between temperature and salinity. In addition, depth and nutrients had a strong negative impact on them, which is in agreement with previous studies conducted in the ECS that Pico abundance would increase with the increasing of temperature and salinity (Chiang et al., 2002; Jiao et al., 2005). In common, Pro group had a positive correlation between temperature and salinity, but a negative correlation with depth and nutrients. According to the research report, Pro lacked the functional genes related to the absorption and transformation of nutrients (Rocap et al., 2003). Indeed, high concentrations of nutrients in the coastal region had a toxic effect on Pro (Paytan et al., 2009). These results explain that Pro prone to oligotrophic seawater, and this was in accordance with previous studies in other tropical (Arabian Sea) and subtropical regions (North Pacific Ocean) (Liu et al., 1998; Shalapyonok et al., 2001). Compared with Pro and PEuks, Syn group had higher growth potential than the other two Pico. This was an important advantage for Syn group to be the dominator when conditions were favorable in the oligotrophic seawater. However, PEuks had high species diversity, which can keep stable in the mixing ocean (Guo et al., 2014).

|
| Fig.8 Correlation analysis of three Pico groups with associated environmental variables Temp: temperature; Sal: salinity; ***: P < 0.001; **: P < 0.01; *: P < 0.05. |
As we all know, the unique geographical location of the ECS made it more obviously affected by the currents. Four water systems (Fig. 1b), the Taiwan warm current, Kuroshio current, Coastal current and Changjiang diluted water, played a crucial role in the growth and distribution of Pico in the ECS (Pan et al., 2005). The oligotrophic Kuroshio originated from the North Equatorial Current at about 10°N–15°N, and flowed northward along the east coast of the Philippines. The Kuroshio is famous for its strong velocity, and it has high temperature and salinity. The intrusion of the Kuroshio has a huge impact on the northeastern of Taiwan, China. It is the most considerable feature of the ECS current circulation (Le et al., 2012). The Taiwan warm current has high temperature and salinity throughout the year. The Coastal current is mainly distributed in the south of the Changjiang River estuary and along the Zhejiang and Fujian coasts. One of the main characteristics of this current is low salinity. The Changjiang diluted water is one of the largest rivers in the world. A large number of nutrients and other substances are continuously imported into the river through fresh water runoff, which greatly affects the ecosystem of Pico communities in the estuary (Jiao et al., 2002). Moreover, the Changjiang diluted water extends from the estuary to the northeast, and it has low salinity.
From the temperature and salinity distribution diagrams (Fig. 2), both temperature and salinity were low in coastal areas and high in oceanic areas. Generally, the temperature and salinity parameters of the surveyed sea area were mainly affected by the current such as the Changjiang diluted water, Taiwan warm current, and Kuroshio (Chung et al., 2014). And the temperature was greatly affected by the Kuroshio and Taiwan warm current, the coastal and the Transect A had low temperature. On the other hand, the salinity was diluted by the Coastal current and Changjiang diluted water that contributed to low salinity inshore. The salinity gradually increased from the inshore to offshore. In the offshore area, the temperature and salinity were significantly higher, there was a thermohaline gradient between the coastal water and ocean. The above phenomenon indicated that the offshore area was less affected by the Changjiang diluted water, but more influenced by the Taiwan warm current and Kuroshio. In addition, the concentrations of nutrients increased with the increased of the total runoff when the Changjiang River entered the flood season in May (Li et al., 2007). There were some differences in nutrients concentration among different water layers (Fig. 4). Specifically, the concentrations of nutrients were highest in the bottom layer, followed by the middle layer and were lowest in the surface layer. The main reason for this phenomenon was that there were high concentrations of plankton in the surface and middle layers, and their growth played an important role in the consumption of nutrients. The higher nutrient concentration in the bottom seawater was due to the release of nutrients between the sediment interfaces on the sea floor, as well as the invasion of high-salinity and high-nutrient seawater, such as Taiwan warm current, upwelling, etc.
Furthermore, the mixture of currents was one of the important factors affecting the distribution of Pico (Xiu and Huang, 2006; Le et al., 2012). In spring, Kuroshio water invaded the northeast region of Taiwan, China and intruded into the continental shelf in the northeast of Taiwan, China. In our study, the surface seawater was typical features of low temperature and high salinity in the upwelling region. This can explain the phenomenon that high Pico abundance encountered in the coastal area of Fujian, the shelf sea, and the upwelling area in the northeast of Taiwan, China. As temperature increased, there was an increased in the Pico abundance, indicating that temperature was a more important regulating factor for Pico, especially when the temperature exceeded 26 ℃. The spatial differentiation of PEuks was mainly encountered in the continental shelf area. Related studies have shown that while cyanobacteria is very little diversified, at least at the genus level with a couple of taxa (Prochlorococcus, Synechococcus) dominating, eukaryotes turned out to be very diverse with picoplankton taxa distributed widely across several branches of eukaryotic tree of life (Vaulot et al., 2008). In addition to PEuks had more complex genome than Syn and Pro, it also had a greater demand for nutrients absorption and utilization. Pan et al. (2007) proved that PEuks are the most competitive among Pico in near-shore waters in the Changjiang River estuary with abundant river-borne nutrients. The coastal areas of Zhejiang and Fujian and the Changjiang River estuary were close to human activity areas and nutrients rich. Pro contained a unique photosynthetic pigment—divinyl chlorophyll, which was light dependent. It was mainly distributed in oligotrophic waters in tropical and subtropical oceans. Moreover, a large number of literature data showed that Pro tended to be more abundant in oligotrophic rather than eutrophic waters (Jiao et al., 2002; Pan et al., 2007; Wei et al., 2019a, b). From the distribution of Pro in the surface, subsurface, and bottom layer, we would infer that the warm and oligotrophic Taiwan warm current had a strong influence on the Pro. This result was consistent with previous study results (Partensky et al., 1999; Jiao et al., 2002; Le et al., 2012). In spring, there was less Pro in the coastal area. The abundance of Syn was low at latitudes above 28°N, and this phenomenon was most likely a combined consequence of the low temperature and light restrictions. In summation, Pico with high abundance and biomass was found in the upwelling area located in the northeast of Taiwan, China. On this foundation, Pico grew and reproduced rapidly under suitable physicochemical conditions (such as temperature, salinity, and nutrients), and provided abundant primary productivity for marine ecosystem, inferred from a preliminary analysis. However, the influencing factors and control mechanism of Pico still need further research.
5 CONCLUSIONSyn, PEuks, and Pro have a wide geographical distribution that cover both neritic and oceanic in the ECS. In spring, according to the abundance and distribution of Pico in the marine ecosystem, Syn was predominant in Pico groups, followed by Pro and PEuks. However, in terms of carbon biomass, Syn and PEuks were the major contributor, Pro only made up a very small part of carbon biomass. There was no uniformity in both cell size and carbon conversion factors, and this has contributed to large uncertainties in carbon biomass of Pico. In our study, the calculated carbon biomass was not compared with other seasons, or with other seas, mainly because the abundance-to-carbon conversion factors were not uniform across other studies, and the results of such comparisons were not scientifically meaningful. Temperature, salinity, and nutrients were important factors affecting the distribution of Pico in ocean. Secondly, the input of the four water systems in the ECS, and the mixing of water systems had a significant impact on the vertical stability of water, which affected the distribution of Pico and resulted in the differences from other oceans. However, the interaction between Pico communities and its influence mechanism needs to be further explored. Other approaches such as molecular biology combined with cell sorting are needed to identify organisms at the species level.
6 DATA AVAILABILITY STATEMENTThe data used to support the findings of this study are available from the corresponding author upon request.
7 ACKNOWLEDGMENTWe thank the Open Cruise Project in the East China Sea of National Nature Science Foundation of China (NORC2017-02) for sharing the ship time.
Azam F, Fenchel T, Field J G, Graf J S, Meyer-Reil L A, Thingstad F. 1983. The ecological role of water-column microbes in the sea. Marine Ecology Progress Series, 10(3): 257-263.
DOI:10.3354/meps010257 |
Bohmer R M. 1987. Flow Cytometer. US, 4702598[P], https://www.freepatentsonline.com/4702598.html.
|
Chen Y L L. 2000. Comparisons of primary productivity and phytoplankton size structure in the marginal regions of southern East China Sea. Continental Shelf Research, 20(4-5): 437-458.
DOI:10.1016/S0278-4343(99)00080-1 |
Chiang K P, Kuo M C, Chang J, Wang R H, Gong G C. 2002. Spatial and temporal variation of the Synechococcus population in the East China Sea and its contribution to phytoplankton biomass. Continental Shelf Research, 22(1): 3-13.
DOI:10.1016/S0278-4343(01)00067-X |
Chisholm S W, Frankel S L, Goericke R, Olson R J, Palenik B, Waterbury J B, West-Johnsrud L, Zettler E R. 1992. Prochlorococcus marinus nov. gen. nov. sp. : an oxyphototrophic marine prokaryote containing divinyl chlorophyll a and b. Archives of Microbiology, 157(3): 297-300.
DOI:10.1007/BF00245165 |
Chung C C, Huang C Y, Gong G C, Lin Y C. 2014. Influence of the Changjiang River flood on Synechococcus ecology in the surface waters of the East China Sea. Microbial Ecology, 67(2): 273-285.
DOI:10.1007/s00248-013-0299-8 |
Crosbie N D, Furnas M J. 2001. Abundance, distribution and flow-cytometric characterization of picophytoprokaryote populations in central (17°S) and southern (20°S) shelf waters of the Great Barrier Reef. Journal of Plankton Research, 23(8): 809-828.
DOI:10.1093/plankt/23.8.809 |
Dai M H, Wang L F, Guo X H, Zhai W, Li Q, He B, Kao S J. 2008. Nitrification and inorganic nitrogen distribution in a large perturbed river/estuarine system: the Pearl River Estuary, China. Biogeosciences, 5: 1 227-1 244.
DOI:10.5194/bg-5-1227-2008 |
Díez B, Pedrós-Alió C, Marsh T L, Massana R. 2001. Application of denaturing gradient gel electrophoresis (DGGE) to study the diversity of marine picoeukaryotic assemblages and comparison of DGGE with other molecular techniques. Applied & Environmental Microbiology, 67(7): 2 942-2 951.
DOI:10.1128/AEM.67.7.2942-2951.2001 |
Fogg G E. 1986. Review lecture: Picoplankton. Proceedings of the Royal Society B: Biological Sciences, 228(1250): 1-30.
DOI:10.1098/rspb.1986.0037 |
Gong G C, Liu G J. 2003. An empirical primary production model for the East China Sea. Continental Shelf Research, 23(2): 213-224.
DOI:10.1016/S0278-4343(02)00166-8 |
Gong G C, Wen Y H, Wang B W, Liu G J. 2003. Seasonal variation of chlorophyll a concentration, primary production and environmental conditions in the subtropical East China Sea. Deep Sea Research Part Ⅱ: Topical Studies in Oceanography, 50(6-7): 1 219-1 236.
DOI:10.1016/S0967-0645(03)00019-5 |
Guillou L, Chrétiennot-Dinet M J, Medlin L K, Claustre H, Loiseaux-de Goër S, Vaulot D. 1999. Bolidomonas: a new genus with two species belonging to a new algal class, the Bolidophyceae (Heterokonta). Journal of Phycology, 35(2): 368-381.
DOI:10.1046/j.1529-8817.1999.3520368.x |
Guo C, Liu H, Zheng L, Song S, Chen B, Huang B. 2014. Seasonal and spatial patterns of picophytoplankton growth, grazing and distribution in the East China Sea. Biogeosciences, 11(7): 1 847-1 862.
DOI:10.5194/bg-11-1847-2014 |
Hallegraeff G M, Jeffrey S W. 1984. Tropical phytoplankton species and pigments of continental shelf waters of North and North-West Australia. Marine Ecology Progress, 20: 59-74.
DOI:10.3354/meps020059 |
Jiao N Z, Yang Y H, Koshikawa H, Watanabe M. 2002. Influence of hydrographic conditions on picoplankton distribution in the East China Sea. Aquatic Microbial Ecology, 30(1): 37-48.
DOI:10.3354/ame030037 |
Jiao N Z, Yang Y H, Hong N, Ma Y, Harada S, Koshikawa H, Watanabe M. 2005. Dynamics of autotrophic picoplankton and heterotrophic bacteria in the East China Sea. Continental Shelf Research, 25(10): 1 265-1 279.
DOI:10.1016/j.csr.2005.01.002 |
Jochem F. 1988. On the distribution and importance of picocyanobacteria in a boreal inshore area (Kiel Bight, Western Baltic). Journal of Plankton Research, 10(5): 1 009-1 022.
DOI:10.1093/plankt/10.5.1009 |
Kuwata A, Yamada K, Ichinomiya M, Yoshikawa S, Tragin M, Vaulot D, dos Santos A L. 2018. Bolidophyceae, a sister picoplanktonic group of diatoms—a review. Frontiers in Marine Science, 5: 370.
DOI:10.3389/fmars.2018.00370 |
Le F F, Ning X R, Liu C G, Ni X B, Hao Q. 2012. Picoplankton abundance and biomass in the East China Sea during autumn and winter. Oceanology, 52(1): 48-59.
DOI:10.1134/S0001437011060026 |
Li M T, Xu K Q, Watanabe M, Chen Z Y. 2007. Long-term variations in dissolved silicate, nitrogen, and phosphorus flux from the Yangtze River into the East China Sea and impacts on estuarine ecosystem. Estuarine, Coastal & Shelf Science, 71(1-2): 3-12.
DOI:10.1016/j.ecss.2006.08.013 |
Li W K W. 1994. Primary Production of Prochlorophytes, Cyanobacteria, and eucaryotic ultraphytoplankton: measurements from flow cytometric sorting. Limnology & Oceanography, 39(1): 169-175.
DOI:10.4319/lo.1994.39.1.0169 |
Liu H, Campbell L, Landry M R, Nolla H A, Brown S L, Constantinou J. 1998. Prochlorococcus and Synechococcus growth rates and contributions to production in the Arabian Sea during the 1995 southwest and northeast monsoons. Deep Sea Research Part Ⅱ: Topical Studies in Oceanography, 45(10-11): 2 327-2 352.
DOI:10.1016/S0967-0645(98)00073-3 |
Mackey K R M, Paytan A, Caldeira K, Grossman A R, Moran D, McIlvin M, Saito M A. 2013. Effect of temperature on photosynthesis and growth in marine Synechococcus spp. Plant Physiology, 163(2): 815-829.
DOI:10.1104/pp.113.221937 |
Marie D, Partensky F, Jacquet S, Vaulot D. 1997. Enumeration and cell cycle analysis of natural populations of marine picoplankton by flow cytometry using the nucleic acid stain SYBR green I. Applied & Environmental Microbiology, 63(1): 186-193.
DOI:10.1128/AEM.63.1.186-193.1997 |
Metz S, Dos Santos A L, Berman M C, Bigeard E, Licursi M, Not F, Lara E, Unrein F. 2019. Diversity of photosynthetic picoeukaryotes in eutrophic shallow lakes as assessed by combining flow cytometry cell-sorting and high throughput sequencing. FEMS Microbiology Ecology, 95(5): fiz038.
DOI:10.1093/femsec/fiz038 |
Noman M A, Sun J, Gang Q, Guo C C, Islam M S, Li S J, Yue J Q. 2019. Factors regulating the phytoplankton and tintinnid microzooplankton communities in the East China Sea. Continental Shelf Research, 181: 14-24.
DOI:10.1016/j.csr.2019.05.007 |
Pan L A, Zhang J, Zhang L H. 2007. Picophytoplankton, nanophytoplankton, heterotrohpic bacteria and viruses in the Changjiang Estuary and adjacent coastal waters. Journal of Plankton Research, 29(2): 187-197.
DOI:10.1093/plankt/fbm006 |
Pan L A, Zhang L H, Zhang J, Gasol J M, Chao M. 2005. On-board flow cytometric observation of picoplankton community structure in the East China Sea during the fall of different years. FEMS Microbiology Ecology, 52(2): 243-253.
DOI:10.1016/j.femsec.2004.11.019 |
Partensky F, Hess W R, Vaulot D. 1999. Prochlorococcus, a marine photosynthetic prokaryote of global significance. Microbiology & Molecular Biology Reviews, 63(1): 106-127.
DOI:10.1128/MMBR.63.1.106-127.1999 |
Paytan A, Mackey K R M, Chen Y, Lima I D, Doney S C, Mahowald N, Labiosa R, Post A F. 2009. Toxicity of atmospheric aerosols on marine phytoplankton. Proceedings of the National Academy of Sciences of the United States of America, 106(12): 4 601-4 605.
DOI:10.1073/pnas.0811486106 |
Phinney D A, Cucci T L. 1989. Flow cytometry and phytoplankton. Cytometry, 10(5): 511-521.
DOI:10.1002/cyto.990100506 |
Read R W, Berube P M, Biller S J, Neveux I, Cubillos-Ruiz A, Chisholm S W, Grzymski J J. 2017. Nitrogen cost minimization is promoted by structural changes in the transcriptome of N-deprived Prochlorococcus cells. The ISME Journal, 11(10): 2 267-2 278.
DOI:10.1038/ismej.2017.88 |
Rocap G, Larimer F W, Lamerdin J, Malfatti S, Chain P, Ahlgren N A, Arellano A, Coleman M, Hauser L, Hess W R, Johnson Z I, Land M, Lindell D, Post A F, Regala W, Shah M, Shaw S L, Steglich C, Sullivan M B, Ting C S, Tolonen A, Webb E A, Zinser E R, Chisholm S W. 2003. Genome divergence in two Prochlorococcus ecotypes reflects oceanic niche differentiation. Nature, 424(6952): 1 042-1 047.
DOI:10.1038/nature01947 |
Shalapyonok A, Olson R J, Shalapyonok L S. 2001. Arabian Sea phytoplankton during Southwest and Northeast Monsoons 1995: composition, size structure and biomass from individual cell properties measured by flow cytometry. Deep Sea Research Part Ⅱ: Topical Studies in Oceanography, 48(6-7): 1 231-1 261.
DOI:10.1016/S0967-0645(00)00137-5 |
Short S M, Suttle C A. 2003. Temporal dynamics of natural communities of marine algal viruses and eukaryotes. Aquatic Microbial Ecology, 32: 107-119.
DOI:10.3354/ame032107 |
Takahashi M, Bienfang P K. 1983. Size structure of phytoplankton biomass and photosynthesis in subtropical Hawaiian waters. Marine Biology, 76: 203-211.
DOI:10.1007/BF00392736 |
Troussellier M, Courties C, Zettelmaier S. 1995. Flow cytometric analysis of coastal lagoon bacterioplankton and picophytoplankton: fixation and storage effects. Estuarine, Coastal & Shelf Science, 40(6): 621-633.
DOI:10.1006/ecss.1995.0042 |
Vaulot D, Eikrem W, Viprey M, Moreau H. 2008. The diversity of small eukaryotic phytoplankton (≤3 μm) in marine ecosystems. FEMS Microbiology Reviews, 32(5): 795-820.
DOI:10.1111/j.1574-6976.2008.00121.x |
Vaulot D, Ning X R. 1988. Abundance and cellular characteristics of marine Synechococcus spp. in the dilution zone of the Changjiang (Yangtze River, China). Continental Shelf Research, 8(10): 1 171-1 186.
DOI:10.1016/0278-4343(88)90018-0 |
Wei Y Q, Huang D Y, Zhang G C, Zhao Y Y, Sun J. 2020. Biogeographic variations of picophytoplankton in three contrasting seas: the Bay of Bengal, South China Sea and Western Pacific Ocean. Aquatic Microbial Ecology, 84: 91-103.
DOI:10.3354/ame01928 |
Wei Y Q, Sun J, Zhang X D, Wang J, Huang K. 2019a. Picophytoplankton size and biomass around equatorial eastern Indian Ocean. MicrobiologyOpen, 8(2): e00629.
DOI:10.1002/mbo3.629 |
Wei Y Q, Zhang G C, Chen J, Wang J, Ding C L, Zhang X D, Sun J. 2019b. Dynamic responses of picophytoplankton to physicochemical variation in the eastern Indian Ocean. Ecology & Evolution, 9(8): 5 003-5 017.
DOI:10.1002/ece3.5107 |
Wood A M. 1985. Adaptation of photosynthetic apparatus of marine ultraphytoplankton to natural light fields. Nature, 316(6025): 253-255.
DOI:10.1038/316253a0 |
Wood A M. 1988. Molecular biology, single cell analysis and quantitative genetics: new evolutionary genetic approaches in phytoplankton ecology. In: Yentsch C M, Mague F C, Horan P K eds. Immunochemical Approaches to Coastal, Estuarine and Oceanographic Questions. Springer, New York. p. 41-71, https://doi.org/10.1007/978-1-4684-7642-2_3.
|
Xiu S M, Huang H S. 2006. Study on numerical simulation for upwelling of winter off northeastern Taiwan. Journal of Hydrodynamics (Ser. A), 21(3): 331-338.
(in Chinese with English abstract) |
Yang D Z, Yin B S, Liu Z L, Bai T, Qi J F, Chen H Y. 2012. Numerical study on the pattern and origins of Kuroshio branches in the bottom water of southern East China Sea in summer. Journal of Geophysical Research, 117: C02014.
DOI:10.1029/2011JC007528 |
Yentsch C M, Horan P K, Muirhead K, Dortch Q, Haugen E, Legendre L, Murphy L S, Perry M J, Phinney D A, Pomponi S A, Spinrad R W, Wood M, Yentsch C S, Zahuranec B J. 1983. Flow cytometry and cell sorting: a technique for analysis and sorting of aquatic particles. Limnology & Oceanography, 28(6): 1 275-1 280.
DOI:10.4319/lo.1983.28.6.1275 |