 2021, Vol. 39
Institute of Oceanology, Chinese Academy of Sciences
Article Information
- WANG Qidong, SONG Jinming, LI Xuegang, MA Jun, YUAN Huamao, LI Ning, DUAN Liqin
- Characteristics and biogeochemical effects of oxygen minimum zones in typical seamount areas, Tropical Western Pacific
- Journal of Oceanology and Limnology, 39(5): 1651-1661
- http://dx.doi.org/10.1007/s00343-021-0349-x
Article History
- Received Sep. 14, 2020
- accepted in principle Nov. 17, 2020
- accepted for publication Jan. 28, 2021


2 Laboratory for Marine Ecology and Environmental Science, Pilot National Laboratory for Marine Science and Technology (Qingdao), Qingdao 266237, China;
3 University of Chinese Academy of Sciences, Beijing 100049, China;
4 Center for Ocean Mega-Science, Chinese Academy of Sciences, Qingdao 266071, China
Oxygen is a key element participating in biogeochemical cycles of carbon and nitrogen in the ocean (Li et al., 2017). The change of ocean dissolved oxygen (DO) content is also closely related to the global climate system. As a consequence of global warming, global oceanic oxygen content has been declining over the past decades, and one of the most distinctive characteristic of global ocean deoxygenation is the expansion of oxygen minimum zones (Paulmier and Ruiz-Pino, 2009; Schmidtko et al., 2017; Levin, 2018). Oxygen minimum zones (OMZs), which refer specially to oxygen deficient layers in the ocean water column (Cline and Richards, 1972), are generally distributed in 200–1 000-m water depth in open oceans, and its formation is the result of both oxygen consumption of organic matter degradation and insufficient oxygen supplement (Brandt et al., 2015; Li et al., 2017; Fennel and Testa, 2019). Although OMZs have been known for playing an essential role in global carbon and nitrogen cycles, there is neither agreement on the threshold in oxygen that defines an OMZ nor consistent method that describes the strength of OMZs (Paulmier and RuizPina, 2009; Gilly et al., 2013; Li et al., 2017).
OMZs are widely developed in the global tropical oceans, but large regional difference in OMZs existed. The most significant OMZs are found in Eastern North Pacific (ENP), Eastern South Pacific (ESP), Arabian Sea (AS) and Bay of Bengal (BB), where the minimum DO concentration is generally lower than 1 mg/L (Paulmier and Ruiz-Pino, 2009). For the Tropical Western Pacific (TWP), however, the DO concentration in the core of OMZs is basically higher than 2 mg/L (based on our previous investigations). With the aggravation of climate change, the decline of ocean oxygen and the expansion of OMZs accelerate, and those sea areas with higher DO concentration in mesopelagic zones will contribute more oxygen loss. Below the surface of the TWP lie some of the most voluminous OMZs of the world oceans (Karstensen et al., 2008). Recent studies have shown that, beside the warmer mixed-layer and reduced ocean ventilation, factors like enhancement of aerosol pollutants deposition have also accelerated the oxygen decline in TWP over the past decades (Deutsch et al., 2014; Ito et al., 2016). Yet compared with those hotspots like ENP and ESP, OMZs of the TWP have attracted much less attention.
In the TWP, a large amount of seamounts protrude from the seabed, forming relatively isolated ecosystems which may have increased nutrient concentration, chlorophyll-a content and biomass as consequences of so-called "seamount effects" (Dower et al., 1992; Genin, 2004; Clark et al., 2010; Ma et al., 2018, 2019). Over the past few years, we have comprehensively investigated several seamounts in the TWP. In this study, we mainly focus on the OMZs of typical seamounts areas in the TWP. We firstly discuss characteristics of OMZs in three seamounts areas, and then propose a parameter that could quantitatively describe the intensity of OMZs. At last, we preliminary discuss the effects of OMZs on the vertical transport of particulate organic carbon (POC).
2 MATERIAL AND METHOD 2.1 Study areaLocations of the three seamounts areas are shown in Fig. 1. The Y3 seamount area (8.76°N–9.04°N, 137.62°E–137.94°E) and M2 seamount area (11.16°N–11.41°N, 139.14°E–137.55°E) are along the Yap Trench, east of the Philippines, while Kocebu seamount area (17.17°N–17.78°N, 152.54°E–153.42°E) is on the submarine plain, northeast of Mariana Trench. The upper hydrological situation in this area is mainly affected by the North Equatorial Current (NEC) (Toole et al., 1988; Hu et al., 2015). The comprehensive investigations for Y3, M2, and Kocebu seamounts were conducted using R/V Kexue (Science in Chinese) in December 2014, March 2016, and March 2018, respectively. For each seamount, two sections (A and B) which crossed at the top of seamounts were established to carry out investigation. Totally, 15, 21, and 19 stations were investigated for Y3, M2, and Kocebu seamountareas, respectively.

|
| Fig.1 Location and sampling stations of the Y3, M2, and Kocebu seamounts |
For each station, water samples were collected at 0, 30, 75, 100, 150, 200, 300, 500, 750/800, 1 000, 1 500, 2 000 m, and the bottom layer using a Niskin water sampler (KC-Denmark, Denmark). Simultaneous determination of temperature (T) and salinity (S) was performed using a conductivity-temperature-depth (CTD) profile (Sea-bird SBE911, USA) with the water sample collection. The accuracy of T and S (calculated by conductivity) measurement were 0.001 ℃ and 0.000 3 S/m, respectively. Dissolved oxygen (DO) in seawater was measured in two ways, Winkler titration method and probe (Sea-bird SBE43) method with CTD. For Winkler method, each layer was sampled with a 120-mL brown iodine volumetric flask. After the adding of manganese sulfate (2.4 mol/L) and an alkaline potassium iodide solution (1.8 mol/L) for fixation, DO was measured with the Winkler iodometry in the field, with a relative standard deviation of ≤2% (Zuo et al., 2019). DO data from CTD probe were all calibrated by Winkler method station by station. Specifically, a linear correlation between probe data and Winkler data was calculated for each station, and all probe data were recalculated based on this correlation. The linear correlation coefficients (r) between probe data and Winkler data were above 0.98 for all stations. The POC samples were filtered onto Whatman GF/F filters (25-m diameter, 0.7-μm pore size), which were pre-combusted at 500 ℃ for 6 h in a maffle burner. For each layer, 5-L seawater from CTD bottles was filtered. After being rinsed three times with Milli-Q water, the GF/F filters were sealed and kept frozen (-20 ℃) before determination of POC content in the lab. POC content was determined using an Element Analyzer (Flash EA 1112 HT, Thermo Fisher) in the lab with an accuracy of ±0.8‰. The determination of chlorophyll-a (Chl-a) concentration was described in Dai et al. (2020). Briefly, 2 000-mL seawater was filtered with 0.7-μm filters after zooplankton was removed by 200-μm bolting silk. The filters were preserved at -20 ℃ in a dark environment. In the laboratory, Chl a was extracted with acetone for 24 h and then was analyzed using a 10-AU Turner Design fluorometer with an accuracy of 0.001 mg/L.
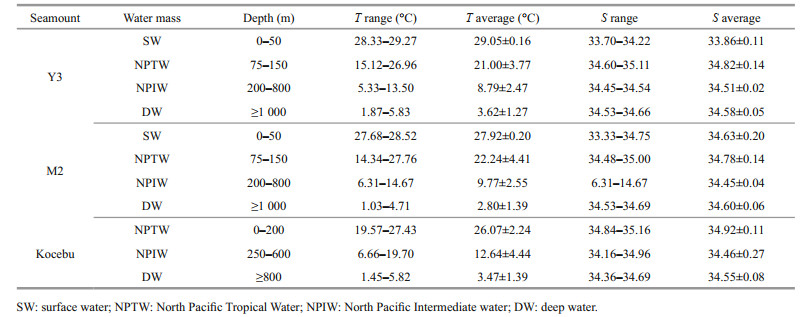
3 RESULT 3.1 Water masses in the three seamounts areasAccording to the T and S relationship graph (Fig. 2), Y3 and M2 seamounts had similar vertical water mass distribution, owing to their close location. Based on related reports (Hu et al., 2015; Ma et al., 2020a), the water masses in this area were divided into four categories, which were Surface Water (SW), North Pacific Tropical Water (NPTW), North Pacific Intermediate Water (NPIW), and Deep Water (DW), respectively. The Kocebu seamount was located at the edge of Western Pacific Warm Pool, and its water mass distribution was different from that found at Y3 and M2 (Fig. 2) and could be divided into three categories. The T-S characteristics of different water masses for the three seamount-areas are shown in Table 1.

|
| Fig.2 Distributions of water masses at different depths in the three seamounts areas SW: surface water; NPTW: North Pacific Tropical Water; NPIW: North Pacific Intermediate water; DW: deep water; σ0: potential density. Red dash line: scope of water mass; gray solid line: potential isodensity line. |
|
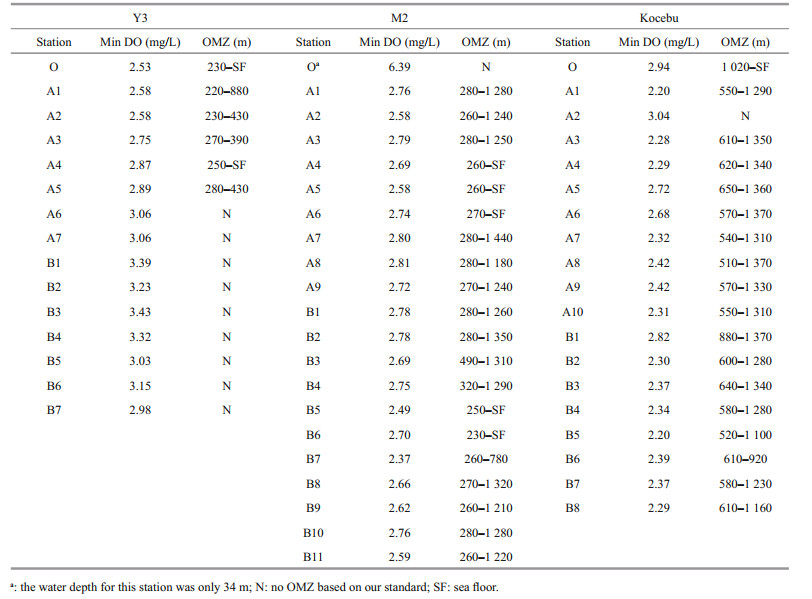
The range of DO concentration for Y3, M2, and Kocebu seamounts were 2.53–7.18, 2.37–7.05, and 2.20–7.07 mg/L, respectively. Distributions of DO in the three seamounts areas are shown in Fig. 3. Relatively, the average water depth of Y3 seamount was the shallowest while its average DO concentration was the highest. The lowest DO concentration for Y3 was around the mountaintop. For M2 and Kocebu seamounts, however, much larger parts of water bodies have the DO concentration lower than 3.0 mg/L. According to the division of water masses, low DO concentration water bodies of Kocebu seamount mainly belonged to DW, while that of Y3 and M2 seamounts mainly belonged to NPIW. What's more, water bodies with high DO concentration in the upper layer of Kocebu were much thicker than that of Y3 and M2 seamounts.

|
| Fig.3 Distributions of DO in A and B sections of the three seamounts areas Black dots show the positions of CTD measurement as well as layers for water collection. Sections (Y3-A, Y3-B, M2-A, M2-B, Kocebu-A, and Kocebu-B) are marked in Fig. 1. |
The range of POC concentration for Y3, M2, and Kocebu seamounts were 11.72–56.72, 6.19–70.52, and 9.01–34.71 μg/L, respectively. Basically, the three seamounts presented similar vertical distribution patterns of POC, in which POC decreased rapidly in the upper 300–500 m and then kept relatively stable in the deep (Fig. 3). In deep layers, the relatively stable POC concentration was around 10.00 μg/L. The topography of seamounts had some influences on the distribution of POC, especially for shallow seamounts. For example, the highest POC concentration for Y3 and M2 seamounts was just on or near the top of seamounts, where particle resuspension in shallow waters was potentially significant. In addition, in some 1 000–2 000 m water bodies of Y3 seamount, where the base of Y3 seamount showed up, the POC concentration also presented higher values (Figs. 3 & 4).

|
| Fig.4 Distributions of POC in water columns of the three seamounts areas |
Since the hypoxia stress for marine organisms and hypoxia degree for different sea areas are both widely ranged, there is no globally uniform definition of OMZ based on DO concentration (Gilly et al., 2013). For example, the OMZ of the eastern tropical South Pacific (ETSP) located off Peru and Chile has DO concentrations below the detection limit based on conventional methods, whereas the eastern tropical North Atlantic OMZ has DO concentrations typically above 1.2 mg/L (Paulmier and Ruiz-Pino, 2009; Capone and Hutchins, 2013; Brandt et al., 2015; Löscher et al., 2016). As for the TWP, however, the DO concentrations in the water column could hardly be less than 2.0 mg/L. In some studies, the term "hypoxia" was defined as a DO concentration below 3.0 mg/L (Dai et al., 2006; Chen et al., 2007; Chi et al., 2017). Therefore, we used a DO concentration of 3.0 mg/L to define the OMZ boundary in this study.
As can be seen in the DO distribution patterns shown in Fig. 3, the OMZs of the three seamounts areas had largely different characteristics. For the Y3 seamount, the OMZ was restricted to the mountain top area, with an average minimum DO concentration of 2.70 mg/L. For the M2 and Kocebu seamountareas, however, the OMZs were widespread. The average upper and lower boundaries of OMZ for M2 seamount area were 280 m and 1 240 m, meaning the thickness of OMZ was up to 960 m (Table 2). Compared with M2, the OMZ for Kocebu seamount area had a much deeper average upper boundary (600 m) and a similar average lower boundary, thus its thickness (680 m) was smaller (Table 2). Meanwhile, the average minimum DO concentration for Kocebu (2.43 mg/L) was also lower than that of M2 (2.68 mg/L).
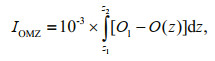
To further illustrate the difference of OMZs, one representative station (with a water depth of about 2 000 m) in each of the three seamounts areas was selected to compare, and the results are presented in Fig. 5. The cores of the OMZ for Y3-A2 and Kocebu-A4 were at about 300 m and 750 m, respectively, while the OMZ of M2-A3 presented a dual-core structure (with cores at about 350 m and 900 m, respectively). In order to describe the OMZ quantitatively, a parameter describing the intensity of OMZ is defined by the following formula:

|
| Fig.5 Comparison of OMZs for stations from different seamount area The area of shadowed part represents the IOMZ. |
where, IOMZ (multiply m2/mg to become dimensionless after calculation) is the intensity of OMZ; z (in m) is the water depth, and z1 and z2 represent the depth of the OMZ upper and lower boundaries, respectively; O(z) (in mg/L) is the DO concentration at depth z, while Ol (in mg/L) is the DO concentration at the upper and low boundaries, meaning that Ol is equal to O(z1) as well as O(z2). In this research, Ol was 3.0 mg/L, and the IOMZ for Y3–A2, M2–A3, and Kocebu–A4 were calculated to be 0.051, 0.140, and 0.259, respectively, indicating much higher OMZ intensity in the Kocebu seamount area.
Factors leading to a specific OMZ distribution pattern are complicated. For a given volume of water, the DO concentration is determined by the cumulative oxygen sources and sinks that acting on the volume. For the three seamounts areas, the existence of seamounts did not significantly change the distribution of the OMZs, except for the mountaintop station of Y3 and Kocebu (Fig. 3 & Table 2). Therefore, their significantly different distribution patterns of OMZs probably reflect that the larger-scale regions where the seamounts are located had differences in oxygen replenishment and/or consumption processes. Firstly, we looked at the oxygen replenishment processes. The subsurface seawater got oxygen replenishment through ocean ventilation. However, strong ventilation was confined above the thermocline in the tropical oceans, and ventilation below the thermocline was much weaker, resulting in a strong vertical gradient in DO. Figure 5 shows that the oxycline for Kocebu was much deeper than that of Y3 and M2, while the T-S diagram (Fig. 2) shows us that Kocebu presented much deeper thermocline. Therefore, we could infer that the area where Kocebu was located was better ventilated than the areas where Y3 and M2 were located. This might be attributed to their difference in positions away from equator or difference in circulation state. Secondly, oxygen consumption process dominated by organic matter degradation (either biological or chemical) was another key factor affecting the distribution and minimum DO concentration of OMZs. According to the investigation data, the average concentrations of Chl a in euphotic zones of the three seamounts areas were 0.056, 0.094, and 0.096 mg/m3 for Y3, M2, and Kocebu, respectively, which meant that the phytoplankton production of Y3 was much lower than the other two seamounts. It has also been reported that a much larger area covering Y3 had an average Chl-a concentration of 0.051 mg/ m3 (Zhang et al., 2016), which was close to our data for Y3. It has been found during our investigation that the presence of seamount did not promote local production because there was no significant upwelling. Thus, if the Chl-a concentrations of the three seamounts areas could represent the average level of much larger scale regions where they were located, these larger scale regions should be different in the vertical transport of POC to the mesopelagic layer, leading to different oxygen demand.
4.2 Biogeochemical effects of OMZs in seamountareasAs the mesopelagic zones of tropical oceans, OMZs extend over the euphotic layer and the deep layer. After the particles produced by biological activities move out from the euphotic layer by settlement, most of their biogeochemical changes happen in the mesopelagic zones. These biogeochemical changes are deeply influenced by the redox environment, which is mainly determined by the DO concentration (Li et al., 2017; Tian et al., 2019). Therefore, the intensity of an OMZ is a particularly important factor affecting the cycling processes of biogenic elements. POC is the main form of organic carbon during the processes of carbon fixation, migration, and export, and is closely related to the vital activities of marine organisms (Song, 2010; Ma et al., 2020b). The vertical transport efficiency of POC determines the strength of marine biological pump, and then has an effect on the level of atmospheric CO2, which is closely related to global climate change. Basically, most of the POC (about 90%) produced in euphotic layers would be respired back to inorganic carbon in the upper 1 000 m (Song et al., 2018). Yet once the POC reaches the sea floor, the probability of its long-term preservation would be greatly increased, which implies that the efficiency of biological pump is determined by sedimentation rate of particles and remineralization rate of POC. It has been reported that if the depth at which 63% of sinking POC is respired (defined as a parameter, remineralization length scales, RLS) increased by 100 m globally, the atmospheric CO2 level would decrease by (42–112)×10-6 (Kwon et al., 2009). In addition, because of lower oxidation rate of sinking organic matter, the RLSs observed in OMZs are high (Cavan et al., 2017). In this study, we focused on the effects of OMZs on the vertical transportation of POC.
The vertical distribution of POC in the water column of the three seamounts areas is shown in Fig. 4. We could see that the POC concentration decreased rapidly from surface to subsurface layers, suggesting that most particulate organic matter produced by biological activities decomposed in shallow seawater. Detailed variation and distribution of POC in upper 500 m of the three seamounts areas are shown in Fig. 6 (notice the difference in color bar). The POC presented much higher concentrations in euphotic layers (upper 200 m) for Y3 and Kocebu seamounts, while extremely high POC concentration was found around the peak of M2 seamounts. Since the depth of mountaintop of M2 was only 34 m, the resuspension of settling particles, which could affect the POC concentration directly or indirectly (e.g. by affecting the biological activities), was inevitable.

|
| Fig.6 Distributions of POC in the upper 500 m of the three seamounts areas Black dots show the positions of measurement. |
Basically, for the three seamounts areas, the distribution pattern of POC was similar with the vertical distribution pattern of DO in the upper 500 m. Indeed, significant positive correlations between POC and DO were found in all three seamounts areas (Fig. 7), but this was simply because that both POC and DO were high near the surface and lower at subsurface. However, the OMZ could have an effect on the decomposition of POC through ways like changing the zooplankton behavior or lower the oxidation rate of sinking organic matter by microbes (Devol and Hartnett, 2001; Keil et al., 2016). In the eastern tropical North Pacific, Cavan et al. (2017) found that particle fragmentation was lower in the OMZ, resulting in high remineralization length scale of POC. In this study, we try to investigate the influence of OMZs on the vertical transportation of POC based on IOMZ, the new proposed parameter to describe the intensity of OMZ. Since the layers we investigated in the field for POC were limited, here we use the difference of POC concentration between 500/1 000-m layer and the euphotic layer (average in the upper 200 m) to represent the decomposition of POC when passing through OMZs. Instead of the POC concentration at 200 m, the average POC concentration in the upper 200 m was used because one single sampling might not able to reflect the real situation of the dramatically changing euphotic layer. Besides, all stations with water depth shallower than 1 000 m were excluded. Specific results are shown in Fig. 8. We have to mention that although the OMZs for Kocebu Seamount area were all below 500 m, they were still included in Fig. 8a–b to keep consistency with Fig. 8c–d. In fact, the inclusion of data for Kocebu Seamount area did not significantly change the relationships in Fig. 8a–b. From the results, we could see that the degradation of POC tended to be lower with stronger OMZ intensity, although their negative relationship was not so significant, which perhaps was due to the limited and small gradient of data. Nevertheless, our study provides a new way to quantitatively study the impact of OMZs on the vertical transport of POC. If the negative relationship between IOMZ and the degradation of POC were true in global oceans, we could infer that expansion of OMZs would improve the vertical transport efficiency of POC, and then enhance the biological pump. However, much more targeted and detailed researches are need before a definite quantitative conclusion could be reached.

|
| Fig.7 Correlations between POC and DO of the three seamounts areas |

|
| Fig.8 Relationships between IOMZ and decomposition of POC 200a, 500, and 1 000 in this figure represent the average POC content in the upper 200 m, the POC content at 500 m and 1 000 m, respectively |
According to the distribution of DO, the three seamounts areas presented different characteristics of OMZs. The OMZ for Y3 seamount area was restricted to the mountaintop area, while OMZs for M2 and Kocebu seamount-areas were widespread. The average thicknesses of OMZs were 960 and 680 m for M2 and Kocebu, respectively. To quantitatively describe the intensity of OMZs, a parameter, IOMZ, was proposed. Based on the results of IOMZ, the order of OMZs intensities for the three seamounts areas was Kocebu>M2>Y3. The existence of seamounts did not significantly change the distribution of the DO, thus their different characteristics of OMZs probably reflected that the ventilation and productivities of the larger-scale regions where the seamounts are located are significantly different. POC content presented similar vertical distribution pattern with DO concentration in the upper 500 m. As the main DO consumption process in the subsurface layer, the degradation of POC tended to be lower with stronger OMZ intensity in the three seamounts areas. If this relationship were true in global oceans, we could infer that expansion of OMZs would improve the vertical transport efficiency of POC, and then enhance the biological pump. Yet this still needs much more relevant researches to prove.
6 DATA AVAILABILITY STATEMENTThe datasets generated during the current study are available from the corresponding author on reasonable request.
7 ACKNOWLEDGMENTThe authors thank the crews in R/V Kexue for their support in data collection and help in the cruise. We also acknowledge Prof. Xiaoxia SUN for her support in Chl-a data.
Brandt P, Bange H W, Banyte D, Dengler M, Didwischus S H, Fischer T, Greatbatch R J, Hahn J, Kanzow T, Karstensen J, Körtzinger A, Krahmann G, Schmidtko S, Stramma L, Tanhua T, Visbeck M. 2015. On the role of circulation and mixing in the ventilation of oxygen minimum zones with a focus on the eastern tropical North Atlantic. Biogeosciences, 12(2): 489-512.
DOI:10.5194/bg-12-489-2015 |
Capone D G, Hutchins D A. 2013. Microbial biogeochemistry of coastal upwelling regimes in a changing ocean. Nature Geoscience, 6(9): 711-717.
DOI:10.1038/NGEO1916 |
Cavan E L, Trimmer M, Shelley F, Sanders R. 2017. Remineralization of particulate organic carbon in an ocean oxygen minimum zone. Nature Communications, 8(1): 14 847.
DOI:10.1038/Ncomms14847 |
Chen C C, Gong G C, Shiah F K. 2007. Hypoxia in the East China Sea: one of the largest coastal low-oxygen areas in the world. Marine Environmental Research, 64(4): 399-408.
DOI:10.1016/j.marenvres.2007.01.007 |
Chi L B, Song X X, Yuan Y Q, Wang W T, Zhou P, Fan X, Cao X H, Yu Z M. 2017. Distribution and key influential factors of dissolved oxygen off the Changjiang River Estuary (CRE) and its adjacent waters in China. Marine Pollution Bulletin, 125(1-2): 440-450.
DOI:10.1016/j.marpolbul.2017.09.063 |
Clark M R, Rowden A A, Schlacher T, Williams A, Consalvey M, Stocks K L, Rogers A D, O'Hara T D, White M, Shank T M, Hall-Spencer J M. 2010. The ecology of seamounts: structure, function, and human impacts. Annual Review of Marine Science, 2: 253-278.
DOI:10.1146/annurev-marine-120308-081109 |
Cline J D, Richards F A. 1972. Oxygen deficient conditions and nitrate reduction in the Eastern Tropical North Pacific Ocean. Limnology and Oceanography, 17(6): 885-900.
DOI:10.4319/lo.1972.17.6.0885 |
Dai M H, Guo X H, Zhai W D, Yuan L Y, Wang B W, Wang L F, Cai P H, Tang T T, Cai W J. 2006. Oxygen depletion in the upper reach of the Pearl River estuary during a winter drought. Marine Chemistry, 102(1-2): 159-169.
DOI:10.1016/j.marchem.2005.09.020 |
Dai S, Zhao Y F, Li X G, Wang Z Y, Zhu M L, Liang J H, Liu H J, Tian Z Y, Sun X X. 2020. The seamount effect on phytoplankton in the tropical western Pacific. Marine Environmental Research, 162: 105094.
DOI:10.1016/j.marenvres.2020.105094 |
Deutsch C, Berelson W, Thunell R, Weber T, Tems C, McManus J, Crusius J, Ito T, Baumgartner T, Ferreira V, Mey J, van Geen A. 2014. Centennial changes in north pacific anoxia linked to tropical trade winds. Science, 345(6197): 665-668.
DOI:10.1126/science.1252332 |
Devol A H, Hartnett H E. 2001. Role of the oxygen-deficient zone in transfer of organic carbon to the deep ocean. Limnology and Oceanography, 46(7): 1 684-1 690.
DOI:10.4319/lo.2001.46.7.1684 |
Dower J, Freeland H, Juniper K. 1992. A strong biological response to oceanic flow past Cobb seamount. Deep Sea Research Part A. Oceanographic Research Papers, 39(7-8): 1 139-1 145.
DOI:10.1016/0198-0149(92)90061-W |
Fennel K, Testa J M. 2019. Biogeochemical controls on coastal hypoxia. Annual Review of Marine Science, 11: 105-130.
DOI:10.1146/annurev-marine-010318-095138 |
Genin A. 2004. Bio-physical coupling in the formation of zooplankton and fish aggregations over abrupt topographies. Journal of Marine Systems, 50(1-2): 3-20.
DOI:10.1016/j.jmarsys.2003.10.008 |
Gilly W F, Beman J M, Litvin S Y, Robison B H. 2013. Oceanographic and biological effects of shoaling of the oxygen minimum zone. Annual Review of Marine Science, 5: 393-420.
DOI:10.1146/annurevmarine-120710-100849 |
Hu D X, Wu L X, Cai W J, Gupta A S, Ganachaud A, Qiu B, Gordon A L, Lin X P, Chen Z H, Hu S J, Wang G J, Wang Q Y, Sprintall J, Qu T D, Kashino Y J, Wang F, Kessler W S. 2015. Pacific western boundary currents and their roles in climate. Nature, 522(7556): 299-308.
DOI:10.1038/nature14504 |
Ito T, Nenes A, Johnson M S, Meskhidze N, Deutsch C. 2016. Acceleration of oxygen decline in the tropical pacific over the past decades by aerosol pollutants. Nature Geoscience, 9(6): 443-447.
DOI:10.1038/NGEO2717 |
Karstensen J, Stramma L, Visbeck M. 2008. Oxygen minimum zones in the eastern tropical Atlantic and Pacific Oceans. Progress in Oceanography, 77(4): 331-350.
DOI:10.1016/j.pocean.2007.05.009 |
Keil R G, Neibauer J A, Biladeau C, van der Elst K, Devol A H. 2016. A multiproxy approach to understanding the "enhanced" flux of organic matter through the oxygen-deficient waters of the Arabian Sea. Biogeosciences, 13(7): 2 077-2 092.
DOI:10.5194/bg-13-2077-2016 |
Kwon E Y, Primeau F, Sarmiento J L. 2009. The impact of remineralization depth on the air-sea carbon balance. Nature Geoscience, 2(9): 630-635.
DOI:10.1038/NGEO612 |
Levin L A. 2018. Manifestation, drivers, and emergence of open ocean deoxygenation. Annual Review of Marine Science, 10: 229-260.
DOI:10.1146/annurevmarine-121916-063359 |
Li X G, Song J M, Yuan H M, Li N, Duan L Q, Wang Q D. 2017. The oxygen minimum zones (OMZs) and its ecoenvironmental effects in ocean. Marine Sciences, 41(12): 127-138.
(in Chinese with English abstract) DOI:10.11759/hykx20170821003 |
Löscher C R, Bange H W, Schmitz R A, Callbeck C M, Engel A, Hauss H, Kanzow T, Kiko R, Lavik G, Loginova A, Melzner F, Meyer J, Neulinger S C, Pahlow M, Riebesell U, Schunck H, Thomsen S, Wagner H. 2016. Water column biogeochemistry of oxygen minimum zones in the eastern tropical North Atlantic and eastern tropical South Pacific oceans. Biogeosciences, 13(12): 3 585-3 606.
DOI:10.5194/bg-13-3585-2016 |
Ma J, Song J M, Li X G, Li N, Wang Q D. 2018. Research progress on oceanic seamounts and their ecoenvironmental characteristics. Marine Sciences, 42(6): 150-160.
(in Chinese with English abstract) DOI:10.11759/hykx20180222001 |
Ma J, Song J M, Li X G, Yuan H M, Li N, Duan L Q, Wang Q D. 2019. Environmental characteristics in three seamount areas of the Tropical Western Pacific Ocean: focusing on nutrients. Marine Pollution Bulletin, 143: 163-174.
DOI:10.1016/j.marpolbul.2019.04.045 |
Ma J, Song J M, Li X G, Yuan H M, Li N, Duan L Q, Wang Q D. 2020a. Control factors of DIC in the Y3 seamount waters of the Western Pacific Ocean. Journal of Oceanology and Limnology, 38(4): 1 215-1 224.
DOI:10.1007/s00343-020-9314-3 |
Ma J, Song J M, Li X G, Yuan H M, Li N, Duan L Q, Wang Q D. 2020b. Geochemical characteristics of particulate organic carbon in the Kocebu Seamount waters of the Western Pacific Ocean in spring 2018. Advances in Earth Science, 35(7): 731-741.
(in Chinese with English abstract) DOI:10.11867/j.issn.1001-8166.2020.057 |
Paulmier A, Ruiz-Pino D. 2009. Oxygen minimum zones (OMZs) in the modern ocean. Progress in Oceanography, 80(3-4): 113-128.
DOI:10.1016/j.pocean.2008.08.001 |
Schmidtko S, Stramma L, Visbeck M. 2017. Decline in global oceanic oxygen content during the past five decades. Nature, 542(7641): 335-339.
DOI:10.1038/nature21399 |
Song J M, Li X G. 2018. Ecological functions and biogenic element cycling roles of marine sediment/particles. Haiyang Xuebao, 40(10): 1-13.
(in Chinese with English abstract) DOI:10.3969/j.issn.0253-4193.2018.10.001 |
Song J M. 2010. Biogeochemical Processes of Biogenic Elements in China Marginal Seas. Springer, Berlin Heidelberg. p. 1-662.
|
Tian D F, Li X G, Song J M, Li N. 2019. Process and mechanism of nitrogen loss in the ocean oxygen minimum zone. Chinese Journal of Applied Ecology, 30(3): 1 047-1 056.
(in Chinese with English abstract) DOI:10.13287/j.1001-9332.201903.038 |
Toole J M, Zou E, Millard R C. 1988. On the circulation of the upper waters in the western equatorial Pacific Ocean. Deep Sea Research Part A. Oceanographic Research Papers, 35(9): 1 451-1 482.
DOI:10.1016/0198-0149(88)90097-0 |
Zhang W J, Sun X X, Chen Y Y, Li J L, Du J. 2016. Chlorophyll a concentration and size structure of phytoplankton at Yarp Y3 seamount in Tropical West Pacific in winter 2014. Oceanologia et Limnologia Sinica, 47(4): 739-747.
(in Chinese with English abstract) DOI:10.11693/hyhz20160100020 |
Zuo J L, Song J M, Yuan H M, Li X G, Li N, Duan L Q. 2019. Impact of Kuroshio on the dissolved oxygen in the East China Sea region. Journal of Oceanology and Limnology, 37(2): 513-524.
DOI:10.1007/s00343-019-7389-5 |