 2021, Vol. 39
Institute of Oceanology, Chinese Academy of Sciences
Article Information
- GAO Wei, WANG Zhenyan, LI Xuegang, HUANG Haijun
- The increased storage of suspended particulate matter in the upper water of the tropical Western Pacific during the 2015/2016 super El Niño event
- Journal of Oceanology and Limnology, 39(5): 1675-1689
- http://dx.doi.org/10.1007/s00343-021-0362-0
Article History
- Received Sep. 26, 2020
- accepted in principle Nov. 17, 2020
- accepted for publication Jun. 8, 2021


2 Laboratory for Marine Mineral Resources, Pilot National Laboratory for Marine Science and Technology (Qingdao), Qingdao 266237, China;
3 University of Chinese Academy of Sciences, Beijing 100049, China;
4 Center for Ocean Mega-Science, Chinese Academy of Sciences, Qingdao 266071, China;
5 CAS Key Laboratory of Marine Ecology and Environmental Sciences, Institute of Oceanology, Chinese Academy of Sciences, Qingdao 266071, China
The tropical Western Pacific Ocean, featured by complicated current system and confluence of various water masses originated from different latitudes, is a significant component of both the ocean's climate system and the material circulation system (Kashino et al., 2009; Hu et al., 2015). In recent decades, the ecosystem changes in the tropical Western Pacific response to the climate change, especially the El Niño-Southern Oscillation (ENSO), and its impact on the global carbon cycle have attracted the attention of many scholars all over the world (Buesseler et al., 2007; Alonso-González et al., 2010; Laufkötter et al., 2016; Spannl et al., 2016; Távora et al., 2020). However, the effects of the complex hydroclimatic changes on the processes of oceanic carbon storage and the circulation in the tropical Western Pacific have not yet been well understood.
In recent years, especially, suspended particulate matter (SPM) have got particular interest, which were traditionally considered the most important component by which the biological pump sequesters carbon in the river and ocean water column (Buesseler et al., 2007; Qiu et al., 2017; Fender et al., 2019; Zhang et al., 2019; Li et al., 2020; Wang et al., 2020). Researchers have tried to evaluate the influence of ENSO on modern carbon cycle variations mainly using time-series data on SPM from moored sediment trap deployments in the equatorial Pacific (e.g. Dunne et al., 2000; Gupta and Kawahata, 2002; Kawahata and Gupta, 2003; Alonso-González et al., 2010). The results indicated that during an El Niño event, a significant increase in the export flux occurred in the westernmost Western Pacific Warm Pool (WPWP). However, the variability in properties of SPM in the tropical Western Pacific induced during an El Niño event has seldom been evaluated by field observations.
El Niño is an important climate phenomenon that creates strong variations in the hydrodynamic structure in the upper layer of the equatorial Pacific, leading to major climatic and societal impacts (Yeh et al., 2009). During 2014 and 2015, an El Niño signal appeared in the tropical Pacific featured by the unusual development of warm episodes. However, this El Niño signal faded in the first half of 2015. When scientists struggled to explain the aborted El Niño event in 2014, an unexpected new El Niño event attracted the attention of scientists throughout the world, as this signal developed into one of the strongest El Niño events in history, i.e., 2015/2016 "super" El Niño event (Iskandar et al., 2017; Santoso et al., 2017). Various atmospheric and oceanic structures indicate that the 2015/2016 super El Niño maximized in the Niño3.4 region, with the large region of warming over most of the Pacific and Indian Ocean (Lim et al., 2017; Timmermann et al., 2018). To further understand the role that the 2015/2016 super El Niño played in carbon storage and circulation and the variability in SPM properties in the tropical Western Pacific, we planned to use SPM data as an indicator and evaluated it variations associated with this super El Niño event.
Two cruises were conducted during Dec. 2014 and 2015 in the tropical Western Pacific, where hydrological and climatic variables are fiercely perturbed during El Niño events. In this paper, we discuss the field SPM data and hydrological parameters from the tropical Western Pacific to examine the impacts of El Niño on carbon storage and circulation in the tropical Western Pacific. Our results, although from transient observations, improve the prospect of creating long-term predictions of the impacts of a super El Niño event on the global carbon cycle and have profound implications for understanding El Niño events.
2 STUDY AREAThe study area is located in the Philippine sea, which is a part of the tropical Western Pacific, where processes an average depth of approximately 5 000 m. Waters in the shallow layer in this area are poor in nutrients because of the limited amounts of external inputs, such as rainfall, wind, and terrestrial runoff, to the surface waters (Morel et al., 2010; Hashihama et al., 2014). The sediments in the Philippine sea are mixed from the surrounding volcanic materials and the Asian wind-dust. The fine dust in the inland of Asia is imported into the North Pacific under the action of the mid-latitude westerlies and constitutes an important part of the deep-sea sediments in the study area (Wan et al., 2012; Zhao et al., 2014; Tan et al., 2017).
The complicated current system in the study area (Fig. 1a) plays a critical role in regulating regional/global heat exchange and material circulation in the oceans throughout the world (Hu et al., 2015). In the surface layer, the westward-flowing North Equatorial Current (NEC) and its two branches, the Kuroshio Current (KC) and the Mindanao Current (MC), compose the near-surface wind-driven circulation and the majority of the Western Boundary Current (WBC) system (Qiu et al., 2015). The MC retroflects off the southeastern tip of Mindanao as it feeds the North Equatorial Counter Current (NECC). Moreover, its retroflection forms the Mindanao Eddy (ME, Lukas et al., 1991), which centered near 7°N, 128°E. A large- scale upwelling structure in the tropical Western Pacific with a near-surface, wind-driven cyclonic gyre east of Mindanao Island has been recognized for over half a century; this area was first named the Mindanao Dome (MD) by Masumoto and Yamagata (1991). The MD region covers an area much larger than the ME (Tozuka et al., 2002), which usually can be distinguished by its abnormal cold temperature at the subsurface layer rather than sea surface (Udarbe-Walker and Villanoy, 2001).

|
| Fig.1 The western boundary currents in the study area and the sampling sites used in this paper a. map showing the western boundary currents. The white arrows indicate the surface currents, and the light blue arrows indicate the subsurface currents; NEC: North Equatorial Current; KC: Kuroshio Current; MC: Mindanao Current; NECC: North Equatorial Countercurrent; STCC: Subtropical Countercurrent; MD: Mindanao Dome; ME: Mindanao Eddy; NEUC: North Equatorial Undercurrent; LUC: Luzon Undercurrent; MUC: Mindanao Undercurrent; NGCUC: New Guinea Coastal Undercurrent, modified after Hu et al. (2015); b. map showing the major geographical features and the in-situ sampling sites and Argo-based section. The white box represents the study area. The red dots and blue triangles represent the sampling stations visited during the 2014 and 2015 cruises, respectively. The yellow squares represent the section S derived from the Argo-based products. |
Field data were collected from Dec. 31, 2014 to Jan. 5, 2015 (9 stations), and from Dec. 10 to 22, 2015 (12 stations) during two oceanographic expeditions in the tropical Western Pacific. Sampling stations are shown in Fig. 1b.
3.1 Field observation 3.1.1 Size distribution, mass concentration, and micrographs of SPMAn autonomous laser in-situ scattering and transmissometery-DEEP (LISST-DEEP) instrument manufactured by Sequoia Scientific, Inc. (Bellevue, WA, USA) was used to determine the in-situ effective particle size (Williams et al., 2007; Jouon et al., 2008). The particle size information was derived from laser diffraction measurements, with size-dependent light scatterers resolved into 32 logarithmically spaced size classes. Volume concentration (VC, μL/L), total volume concentration (TVC, μL/L), and mean particle size (M, μm) were derived and calculated using MATLAB v. 2016.
At each station, discrete water samples were collected for SPM determinations, usually at standard depths (surface, 30, 50, 75, 100, 150, 200, and 300 m). After collection, water samples were brought to the laboratory on board as soon as possible for filtration. The volumes of the filtered seawater samples varied but were at least 8 000 mL. The particle mass concentration (PMC, mg/L), defined as the dry mass of particles per unit volume of water, was determined using a standard gravimetric technique (Woźniak et al., 2011; Yiǧiterhan et al., 2011), which was calculated from the difference in weight before and after filtration. After filtration and drying, micrographs of each filter were obtained in the lab using an optical microscope at hard X-ray micro-focusing beamline (BL15U1) of the Shanghai Synchrotron Radiation Facility (SSRF) in Shanghai.
3.1.2 Hydrography, in-situ chlorophyll a, and nutrientsA SeaBird conductance temperature depth (CTD) profiling probe (SBE-911 plus, SBE, Inc., Bellevue, WA, USA) equipped with a fluorimeter (Wetlabs ECO_AFL/FL) was used to obtain the temperature, salinity, and in-situ chlorophyll a (Chl a) in the water column from the surface to 1 000-m depth. The CTD and fluorimeter were both calibrated in the laboratory prior to the two expeditions. The sampling frequency of the CTD was 24 Hz, and these data were averaged over each vertical meter. The concentrations of nutrients, including nitrate (NO3-), nitrite (NO2-), ammonium (NH4+), phosphate (PO43-), and dissolved silica (Si(OH)4), were measured in the laboratory with a QuAAtro-SFA autoanalyzer (SEAL Analytical Ltd.).
3.2 Open access database 3.2.1 Wind, surface current, surface chlorophyll a and heat contentWind, surface current, surface Chl-a and heat content data were developed from the Cross-Calibrated Multi-Platform (CCMP), Surface Currents from Diagnostic (SCUD) model, Climate Forecast System version 2 model, and Moderate Resolution Imaging Spectrora-diometer (MODIS) Aqua satellite products, respectively, which were all provided by the International Pacific Research Center (IPRC)/Asia-Pacific Data-Research Center (APDRC). Wind and surface currents data have a 0.25°×0.25° spatial resolution. Heat content and surface Chl-a concentration data have a 0.5°×0.5° spatial resolution.
3.2.2 Mean sea level anomalyThe altimeter products of the multi-mission gridded mean sea level anomaly (MSLA) data used in this paper were extracted from the NOAA Ocean Watch Dataset. The merged AVISO products obtained from reprocessing the TOPEX/Poseidon, Jason-1, ERS-2, and Envisat data were downloaded as global delayed-time data files. The MSLA data have a month temporal resolution and a 0.25°×0.25° spatial resolution for the sampling period investigated here.
3.2.3 PrecipitationThe precipitation products used in this study are obtained from the Climate Prediction Center (CPC) Merged Analysis of Precipitation (CMAP). Since the CMAP data were derived by merging multisource estimates, including gauge observations, five different satellite estimates, and numerical model outputs, the uncertainties contained in each individual estimate are significantly reduced. The precipitation data also have a month temporal resolution and a 0.25°×0.25° spatial resolution.
3.2.4 Argo-based dataThe gridded temperature data used in this paper were derived from the Argo products provided by the the IPRC/APDRC, which are seasonally mean fields that have been spatially averaged within 1° horizontal resolution. The Argo-based section S, which is shown with the yellow squares in Fig. 1b, was selected to display the vertical temperature variations in the tropical Western Pacific induced by the 2015/2016 super El Niño event.
4 RESULT 4.1 SPM characterization 4.1.1 Micrographs of SPMElectron microscope pictures (Fig. 2) revealed that all SPM samples had combinations of organic and inorganic particles. Although it was difficult to identify the specific types of each particle, it was easy to determine that there were many more large particles in Dec. 2015 than in Dec. 2014, and these large particles were easily recognized as organic particles in the micrographs.

|
| Fig.2 Comparison of the micrographs for the SPM filters obtained from the same sampled depths at station I-1 in Dec. 2014 and station II-1 in Dec. 2015 |
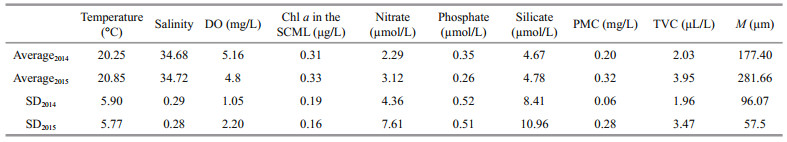
On the whole, distributions of PMC of SPM in Dec. 2014 (Fig. 3a) showed low PMC (< 0.4 mg/L), while the PMC in Dec. 2015 exhibited a significant increase (~2.0 mg/L), especially in the upper 100 m in the south part of the study area. The average values of PMC in Dec. 2014 and 2015 were 0.20 mg/L and 0.32 mg/L, respectively (Table 1). A TVC maximum layer and a M maximum layer always appeared at depths around 100 m in both Dec. 2014 and 2015. Differently, values of TVC rapidly decreased to close to zero below its maximum layer, while the values of M did not decrease sharply after reaching its maximum value. The thickness of M maximum layer was much larger than that of TVC maximum layer. Maximum values of TVC and M in Dec. 2015 were both much higher than those in Dec. 2014, especially for the stations in the south part (Fig. 3 & Table 1).

|
| Fig.3 Distributions of PMC (mg/L, a and b), TVC (μL/L, c and d), and M (μm, e and f) along two sections obtained during the Dec. 2014 cruise (left) and Dec. 2015 cruise (right), respectively The black dots represent the test points of field stations |
|
Three water masses can be identified from the thermohaline structure in the study area (Fig. 4a-d), similar to those described in previous studies (e.g., Gao et al., 2017): (1) north Pacific surface water (NPSW), extending from the surface to approximately 80-m depth in the southeast part of the study area, with salinities lower than 34.6 and temperatures higher than 28 ℃, which exhibited higher salinities in Dec. 2015 compared with that in Dec. 2014; (2) north Pacific tropical water (NPTW, Suga et al., 2000), between 80 m and 240 m with characteristic high salinities of 34.8-35.3 and temperatures of 18-28 ℃; and (3) north Pacific intermediate water (NPIW, Talley, 1993), from 240 m to 300 m in the southeast part of the study area, with salinities of 33.2-34.4 and temperatures of 10-13 ℃, which was featured by low dissolved oxygen (DO).

|
| Fig.4 Distributions of temperature (℃, a and b), salinity (c and d) and DO (mg/L, e and f) along two sections obtained during the Dec. 2014 cruise (left) and Dec. 2015 cruise (right), respectively DO data for station II-10 and II-11 were missing. |
Distributions of temperature, salinity, and DO along two sections show that an upwelling existed in the southeast of the study area, which was a typical signal of the MD upwelling system. This upwelling obviously decreased the thickness of the NPTW and NPIW. And results showed that the upwelling was slightly enhanced in Dec. 2015 compared to Dec. 2014. This enhanced-upwelling uplifted colder, fresher, and lower DO waters from deep layer to shallow layer (Table 1). Low DO (< 4.5 mg/L) waters have been lifted to sea surface in Dec. 2015, which were only lifted to about 100-m depth in Dec. 2014. In addition, another upwelling structure appeared in the northwest part of the survey section in Dec. 2014, whose scale was much smaller than the upwelling in the southeast. But it disappeared in Dec. 2015.
The upwelling featured in the southeast of the section is a typical signal of the Mindanao Dome, which uplifts large amounts of medium-salinity NPDW and decreases the thickness of both the NPTW and NPIW in the southern parts of the sections. In addition, the salinities of the NPSW in the southeast were higher in Dec. 2015 than in Dec. 2014 (Fig. 4). The seasonal temperature profiles in the Argo-based section S from Jan. 2014 to Sept. 2016 (Fig. 5) showed that the upwelling in the Mindanao Dome brought deep cold water to the shallow layer. This upwelling gradually increased beginning in Jan. 2015 and reached a peak in spring 2016. Then, it returned to a normal state in Jul.-Sep. 2016.

|
| Fig.5 Distributions of seasonal temperature (℃, a-k) and variations in the 20 ℃ contour (l) along the Argo-based section shown in Fig. 1b from Jan. 2014 to Sep. 2016 |
Distributions of in-situ Chl a in Dec.2014 and 2015 (Fig. 6a & b) showed that a well-developed subsurface chlorophyll maximum layer (SCML) existed at depths of approximately 100 m in these two years, similar to the observations in previous studies (Hopkinson and Barbeau, 2008; Gao et al., 2017). Values of in-situ Chl a in the SCML of the stations in the south were much higher than those of the stations in the north in both two years. Highest value of in-situ Chl a existed at station I-12 in Dec. 2014 and station II-8 in Dec. 2015, which were 1.20 μg/L and 1.10 μg/L, respectively.

|
| Fig.6 Distributions of in-situ Chl a (μg/L, a and b), nitrate (μmol/L, c and d), phosphate (μmol/L, e and f) and silicate (μmol/L, g and h) along two sections obtained during the Dec. 2014 cruise (left) and Dec. 2015 cruise (right), respectively |
Distributions of nutrients (Fig. 6c-h) showed that concentrations of nitrate, phosphate, and silicate did not change much in the water shallower than 100 m and then increased with depth. Meanwhile, distributions of nutrients in the southeast of the study area showed the effect of the upwelling at depths deeper than 100 m, with large-scale domed isolines (Fig. 6c-h). What's more, it showed that much more nitrate and silicate were uplifted from deep layers to the shallow layers in Dec. 2015 than those in Dec. 2014 (Table 1). The upwelling structure in the northwest, which was only existed in Dec. 2014, also showed upwelling of deep nutrients with domed isolines at depths deeper than 150 m. In addition, waters shallower than 50 m at station II-7 showed high nutrients values in Dec. 2015.
4.3 Eco-hydro-climate-related characterization and variability 4.3.1 Surface currentsDistributions of mean surface currents showed that the surface NEC-KC-MC-NECC system presented as a permanent feature in the tropical Western Pacific in Dec. 2014 and 2015 (Fig. 7a & d). Surface currents in the MD region formed a large-scale anticlockwise circulation, which was centered near Mindanao Island, i.e., the ME. It is worth noting that in Dec. 2015, this anticlockwise circulation composing the MD region was slightly enlarged and strengthened. ME featured a larger and stronger anticlockwise surface current than that in Dec. 2014. And another robust anticlockwise circulation existed in the east of the ME.

|
| Fig.7 Distributions of eco-hydro-climate-related parameters in Dec. 2014 and 2015 a & d. mean surface currents (m/s, the sky blue area represents the Mindanao Dome region, the red arrows represent the main surface currents, and the blue circles represent the anticlockwise centers); b & e. mean wind speed (m/s); c & f. mean sea level anomaly (m); g & j. mean heat content (J/m2); h & k. mean precipitation; i & l. mean surface Chl-a concentration. The red dots and blue triangles represent the sampling stations visited during the 2014 and 2015 cruises, respectively. |
Mean wind distributions (Fig. 7b & e) revealed that the wind patterns in Dec. 2014 and 2015 were almost similar. Northeasterly winds prevailed over the northeast Pacific Ocean, which deflected off the southern coast of the Philippines, and prevailed westerly winds over the equatorial Pacific.
4.3.3 Mean sea level anomalyMonthly MSLA distributions (Fig. 7c & f) showed that the equatorial Pacific was dominated by positive MSLAs in Dec. 2014. Several negative MSLA centers (MSLA < -0.20 m) and positive MSLA centers (MSLA > 0.05 m) were distributed in the northWestern Pacific. In Dec. 2015, distributions of MSLA changed dramatically. Central and southern parts of the tropical Western Pacific exhibited overall negative MSLAs, featured by three notable negative centers (MSLA < -0.35 m) in the central-west part of the study area. The northernmost extent of the study area presented obviously positive MSLAs.
4.3.4 Heat contentMonthly mean heat content distributions (Fig. 7g & j) demonstrated that a low-heat-content band existed between 5°N and 15°N both in Dec. 2014 and 2015. However, the spatial scale and value range of this low-heat-content band showed substantial differences over these two years. In Dec. 2014, it centered near 5°N, 137°E with heat content value lower than 3.56×10¹¹ J/m2. In Dec. 2015, its center extended eastward into a band, which covered nearly the whole middle study area. And its center value dropped sharply into 3.54×10¹¹ J/m2.
4.3.5 PrecipitationDistributions of mean precipitation (Fig. 7h & k) showed that mean precipitation exhibited high values in the central equatorial Pacific and extended northwest in Dec. 2014. However, in Dec. 2015, although high values of mean precipitation were also located in the central equatorial Pacific and showed a similar expand trend toward northwest, a remarkable decrease in mean precipitation occurred. The high- precipitation areas in Dec. 2014, which located off the coasts of Mindanao Island, turned into low- precipitation areas in Dec. 2015. The northeast part of the study area was an area with low precipitation in these two years.
4.3.6 Surface Chl-a concentrationIn Dec. 2014 and 2015, large portions of the northeastern study area were dominated by low surface Chl-a concentration (Fig. 7i & l). The highest value of surface Chl a was pervasive along the coasts of each continent. High values existed in the southeast of the Philippines seemed to shift toward the northeast and gradually extended eastward until throughout the MD region. Overall, high values of surface Chl a observed in the MD region in Dec. 2015 were slightly increased relative to those in Dec. 2014. While high values of surface Chl a appeared in the northwest part of the study area in Dec. 2014 happened to decrease in Dec. 2015.
5 DISCUSSION 5.1 Hydro-climatic variations in the tropical Western Pacific during the 2015/2016 super El Niño eventEvolution of temperature anomaly at sea surface and subsurface temperature anomalies along the equator in the Pacific Ocean from 2013 to 2016 are shown in Fig. 8. At the beginning of 2014, the tropical Pacific featured the unusual development of warm episodes (Fig. 8d), which indicated the potential for the occurrence of an El Niño event. However, this El Niño signal faded in the end of 2014 (Fig. 8l). When scientists were struggling to explain the aborted El Niño event in 2014, an unexpected El Niño signal developed again (Fig. 8f) and attracted the attention of scientists throughout the world. And this El Niño signal eventually evolved into one of the strongest El Niño events in history, i.e., the 2015/2016 super El Niño event (Chen et al., 2017; Timmermann et al., 2018).

|
| Fig.8 The mechanism of variation along the equatorial Pacific under normal and El Niño condition a & b. the conceptual map of overall hydro-climatic conditions during normal condition and El Niño condition; c-n: composite evolution of sea surface temperature anomalies and subsurface temperature anomalies along the equator in the Pacific Ocean from 2013 to 2016, overlaid with salinity anomalies (black contours), reflecting the thermohaline structure variations during the 2015/2016 super El Niño. The dashed black arrows represent the upwelling of cold subsurface waters. The solid red rectangles represent the study area. |
In combination with the results mentioned above, it can be discovered that samplings conducted in December 2015 was just at mature phase of the 2015/2016 super El Niño event. In this section, the main topic need to be covered is the response of the local eco-hydro-climatic conditions to the 2015/2016 super El Niño. During the 2015/2016 super El Niño, the increased westerly wind events have driven the surface warm water in the tropical Western Pacific migrated from west to east (Table 2 & Fig. 8b), making the large scales of negative MSLAs in the tropical Western Pacific (Fig. 7f) and contributing to the more active perturbance of subsurface cold water in the tropical Western Pacific. To compensate quickly the surface water loss, a huge volume of deep water was uplifted in the tropical Western Pacific. Moreover, the enhanced compensation of the deep water became the main reason for the enhancement of the upwelling observed in the southern part of the study area (Figs. 4-5). This enhanced upwelling carried much more deep cold waters into shallow layers, leading to a sudden drop in heat content of the 300-m shallow water bodies in Dec. 2015 (Fig. 8h). The sea-air exchange effects in the tropical Western Pacific in Dec. 2015 was weakened. Then the precipitation was influenced and greatly reduced (Table 2), which decreased the fresh water injection in the tropical Western Pacific region, especially in areas close to the MD region (Fig. 8i). This process resulted in higher salinities in the surface waters in Dec. 2015 than that in Dec. 2014 (Fig. 4c & d).

As a typical oligotrophic ocean, light and nutrients in the tropical Western Pacific are major factors that influence the distribution of phytoplankton (Matsumoto et al., 2014; Harding et al., 2016). As noted earlier, the nutrient distribution in the tropical Western Pacific showed a strong source from the deep sea, presenting a nitrate depletion pattern in the surface waters. Relatively depleted nitrate and total dissolved inorganic nitrogen in the surface waters due to the influence of Pacific-derived waters compared to phosphate and silicate (Codispoti et al., 2009). The nutrient supplied by deep-water upwelling and terrestrial inputs due to tropical rainfall over land support the relatively high primary productivity around the Indonesian maritime continent (Kawahata, 1999).
In the surface layer, the Chl-a concentration was obviously lower than that in the subsurface layer (Fig. 6a & b), despite the high irradiance, because of the lack of nutrients. Relatively high Chl-a concentration observed around the south corner of the Indonesian maritime continent were slightly increased in Dec. 2015 relative to Dec. 2014 (Fig. 7i & l). Based on the analysis in Section 5.1, it can be found that when 2015/2016 super El Niño event happened, the upwelling in the MD region enhanced. In addition, it uplifted deeper, colder, and more eutrophic water upward even into the upper euphotic layer (Figs. 4-6). This process changed not only the thermohaline structure but also the nutrients distribution. The enhancement of nutrients supply from deep water to the shallow water further activated the biological activities and further changed the plankton community structure in the surface waters, leading to higher surface Chl-a concentration in Dec. 2015 compared with that in Dec. 2014 (Fig. 7l).
In the subsurface layer, the SCML in Dec. 2014 and 2015 tended to develop near the pycnocline, which was a layer bounded by two discontinuous water masses, i.e., the NPSW and NPTW (Fig. 4c & d). The upwelling in the southeast of the study area uplifted deep nutrients to shallow depths, especially phosphate and silicate (Fig. 6f & h), leading to higher in-situ Chl-a values in the SCML in the southern stations than those in the northern stations (Fig. 6a & b). The pycnocline contributed to decreasing the sinking speed of phytoplanktonic cells from the surface, which is believed to be faster in nutrient-depleted surface layers (Yamaguchi et al., 2012; Gao et al., 2017). This reduced sinking rate resulted in the formation of a dense accumulation of phytoplankton (Pingree et al., 1975; Gould, 1987), forming a large marine particle-rich layer with the maximum TVC and M values (Figs. 2-3).
In Dec. 2014, the upwelling did not change the condition of the low nitrogen concentrations in the shallow waters significantly (Fig. 6c), leaving the upper tropical Western Pacific still a typical N-limited ocean. And an obvious cold temperature anomaly in the MD region exists at a depth of approximately 100 m and is present in all seasons but reaches a maximum size during winter (Udarbe-Walker and Villanoy, 2001). However, in Dec. 2015, the upwelling in the MD region was greatly enhanced, which characterized by the doming of 25 ℃ isotherms up to depths of 50 m or even shallower (Fig. 5). Much deeper, colder, and more eutrophic water was uplifted into the upper euphotic layer, changing the nutrient structure greatly, especially in terms of nitrogen (Fig. 6d). The maximum concentrations of nitrogen in the deep layer in the southeast part of the study area in Dec. 2015 were nearly three times higher than the maximum values in Dec. 2014. Therefore, the original N-limited oceanic conditions in the euphotic layer of the upper tropical Western Pacific were completely disrupted (Fig. 9), which enhanced the biological activities greatly and resulted in larger abundance and larger particle sizes in Dec. 2015 compared with that in Dec. 2014 (Figs. 2 & 3).

|
| Fig.9 Schematic diagram of the complex processes in the tropical Western Pacific related to SPM variations under normal conditions (left) and El Niño conditions (right) |
A similar significant increase in export flux in the westernmost equatorial Pacific during an El Niño event has been revealed by sediment trap mooring data from the modern observing perspective (Kawahata and Gupta, 2003). When the upper 300 m of the tropical Western Pacific (0°-22°N, 125°E-145°E) is taken as a whole to roughly estimate the mass of SPM, there was a 52% increase of SPM on average in Dec. 2015 than Dec. 2014. Considering that biogenic particles are the main components of SPM and that biogenic particles are typically present in large volumes but low masses, it can be speculated that the increase in biogenic particles in the tropical Western Pacific was remarkable during the 2015/2016 super El Niño. The total increase in carbon storage in the tropical Western Pacific during the 2015/2016 super El Niño was incredible.
6 SUMMARY AND CONCLUSIONBased on PMC, TVC, and M of SPM, temperature, salinity, chlorophyll a, and nutrients data from in-situ observations, and wind, surface current, surface chlorophyll a, heat content, mean sea level anomaly, and precipitation available from various open access database, the SPM and their influence factors in the upper tropical Western Pacific in Dec. 2014 and 2015 were investigated and characterized. Results reveal that during the mature phase of the 2015/2016 El Niño event, the upwelling in the MD region was enhanced and carried much colder but more eutrophic water upward from the deep ocean to shallow depths compared with that in Dec. 2014, even into the euphotic zone. This process disrupted the previously N-limited conditions and contributed to a remarkable phytoplankton blooms in the euphotic zone. Finally, the nitrate concentration in the euphotic zone almost tripled; and the size, mass concentration, and volume concentration of SPM increased in Dec. 2015 compared with those in Dec. 2014. To conclude, this study provides fundamental knowledge on properties of SPM, and assesses the controlling effects of the hydro-climatic variations on particle storage in the upper water of the tropical Western Pacific during the 2015/2016 super El Niño event. It has profound implications for understanding the impacts of global climate change on the global material circulation.
7 DATA AVAILABILITY STATEMENTThe Argo-based data that support the findings of this study are available from the International Pacific Research Center (IPRC)/Asia-Pacific Data-Argo Research Center (APDRC) (http://apdrc.soest.hawaii.edu). Other data that support the findings of this study are available on request from the corresponding author. The data are not publicly available due to them containing information that could compromise research participant privacy/consent.
8 ACKNOWLEDGMENTThe authors gratefully acknowledge the captain, crew members, and scientists aboard the R/V Kexue (Science in Chinese) cruise for their cooperation at sea, and also thank all the laboratory staff at hard X-ray micro-focusing beamline (BL15U1) of the Shanghai Synchrotron Radiation Facility (SSRF) in Shanghai, China.
Alonso-González I J, Arístegui J, Lee C, Sanchez-Vidal A, Calafat A, FabrFa J, Sangra P, Masqua P, HernuFabrez SynchrotBen Her-Barrios V. 2010. Role of slowly settling particles in the ocean carbon cycle. Geophysical Research Letters, 37(13): L13608.
DOI:10.1029/2010GL043827 |
Buesseler KO, Lamborg C H, Boyd P W, Lam P J, Trull T W, Bidigare RR, Bishop J K P, Casciotti K L, Dehairs F, Elskens M, Honda M, Karl D M, Siegel D A, Silver M W, Steinberg DK, Valdes J, Van Mooy B, Wilson S. 2007. Revisiting carbon flux through the ocean's twilight zone. Science, 316(5824): 567-570.
DOI:10.1126/SCIENCE.1137959 |
Chen L, Li T, Wang B, Wang L. 2017. Formation mechanism for 2015/16 Super El Niño. Scientific Reports, 7: 2 975.
DOI:10.1038/s41598-017-02926-3 |
Codispoti LA, Flagg C N, Swift J H. 2009. Hydrographic conditions during the 2004 SBI process experiments. Deep Sea Research Part Ⅱ: Topical Studies in Oceanography, 56(17): 1 144-1 163.
DOI:10.1016/J.DSR2.2008.10.013 |
Dunne JP, Murray J W, Rodier M, Hansell D A. 2000. Export flux in the western and central equatorial Pacific: zonal and temporal variability. Deep Sea Research Part I: Oceanographic Research Papers, 47(5): 901-936.
DOI:10.1016/S0967-0637(99)00089-8 |
Fender CK, Kelly T B, Guidi L, Ohman M D, Smith M C, Stukel MR. 2019. Investigating particle size-flux relationships and the biological pump across a range of plankton ecosystem states from coastal to oligotrophic. Frontiers in Marine Science, 6: 603.
DOI:10.3389/FMARS.2019.00603 |
Gao W, Wang Z Y, Zhang K N. 2017. Controlling effects of mesoscale eddies on thermohaline structure and in situ chlorophyll distribution in the western North Pacific. Journal of Marine Systems, 175: 24-35.
DOI:10.1016/J.JMARSYS.2017.07.002 |
Gould RW. 1987. The deep chlorophyll maximum in the world ocean: a review. Biologist, 66(1-4): 4-13.
|
Gupta LP, Kawahata H. 2002. Impact of ENSO variability on the flux and composition of sinking POM in the western equatorial Pacific Ocean: amino acids and hexosamines. Deep Sea Research Part Ⅱ: Topical Studies in Oceanography, 49(13-14): 2 769-2 782.
DOI:10.1016/S0967-0645(02)00057-7 |
Harding LW Jr, Gallegos C L, Perry E S, Miller W D, Adolf J E, Mallonee M E, Paerl H W. 2016. Long-term trends of nutrients and phytoplankton in Chesapeake Bay. Estuaries and Coasts, 39(3): 664-681.
DOI:10.1007/S12237-015-0023-7 |
Hashihama F, Kanda J, Maeda Y, Ogawa H, Furuya K. 2014. Selective depressions of surface silicic acid within cyclonic mesoscale eddies in the oligotrophic western North Pacific. Deep Sea Research Part I: Oceanographic Research Papers, 90: 115-124.
DOI:10.1016/J.DSR.2014.05.004 |
Hopkinson BM, Barbeau K A. 2008. Interactive influences of iron and light limitation on phytoplankton at subsurface chlorophyll maxima in the eastern North Pacific. Limnology and Oceanography, 53(4): 1 303-1 318.
DOI:10.4319/LO.2008.53.4.1303 |
Hu DX, Wu L X, Cai W J, Gupta A S, Ganachaud A, Qiu B, Gordon AL, Lin X P, Chen Z H, Hu S J, Wang G J, Wang Q Y, Sprintall J, Qu T D, Kashino J, Wang F, Kessler W S. 2015. Pacific western boundary currents and their roles in climate. Nature, 522(7556): 299-308.
DOI:10.1038/NATURE14504 |
Iskandar I, Utari P A, Lestari D O, Sari Q W, Setiabudidaya D, Khakim MY N, Yustian I, Dahlan Z. 2017. Evolution of 2015/2016 El Niño and its impact on Indonesia. AIP Conference Proceedings, 1857: 080001.
DOI:10.1063/1.4987095 |
Jouon A, Ouillon S, Douillet P, Lefebvre J P, Fernandez J M, Mari X, Froidefond J M. 2008. Spatio-temporal variability in suspended particulate matter concentration and the role of aggregation on size distribution in a coral reef lagoon. Marine Geology, 256(1-4): 36-48.
DOI:10.1016/J.MARGEO.2008.09.008 |
Kashino Y, España N, Syamsudin F, Richards K J, Jensen T, Dutrieux P, Ishida A. 2009. Observations of the North Equatorial Current, Mindanao Current, and Kuroshio current system during the 2006/07 El Niño and 2007/08 La Niña. Journal of Oceanography, 65(3): 325-333.
DOI:10.1007/S10872-009-0030-Z |
Kawahata H, Gupta L P. 2003. El Niño/Southern Oscillation (ENSO) related variations in particulate export fluxes in the Western and Central Equatorial Pacific. Journal of Oceanography, 59(5): 663-670.
DOI:10.1023/B:JOCE.0000009595.79408.13 |
Kawahata H. 1999. Fluctuations in the ocean environment within the Western Pacific Warm Pool during Late Pleistocene. Paleoceanography, 14(5): 639-652.
DOI:10.1029/1999PA900023 |
Laufkötter C, Vogt M, Gruber N, Aumont O, Bopp L, Doney S C, Dunne J P, Hauck J, John J G, Lima I D, Seferian R, Völker C. 2016. Projected decreases in future marine export production: the role of the carbon flux through the upper ocean ecosystem. Biogeosciences, 13: 4 023-4 047.
DOI:10.5194/BG-13-4023-2016 |
Li WJ, Wang Z Y, Huang H J. 2020. Indication of size distribution of suspended particulate matter for sediment transport in the South Yellow Sea. Estuarine, Coastal and Shelf Science, 235: 106619.
DOI:10.1016/J.ECSS.2020.106619 |
Lim YK, Kovach R M, Pawson S, Vernieres G. 2017. The 2015/2016 El Niño event in context of the MERRA-2 reanalysis: a comparison of the tropical pacific with 1982/1983 and 1997/1998. Journal of Climate, 30(13): 4 819-4 842.
DOI:10.1175/JCLI-D-16-0800.1 |
Lukas R, Firing E, Hacker P, Richardson P L, Collins C A, Fine R, Gammon R. 1991. Observations of the Mindanao Current during the western equatorial Pacific Ocean circulation study. Journal of Geophysical Research: Oceans, 96(C4): 7 089-7 104.
DOI:10.1029/91JC00062 |
Masumoto Y, Yamagata T. 1991. Response of the western tropical Pacific to the Asian winter monsoon: the generation of the Mindanao Dome. Journal of Physical Oceanography, 21(9): 1 386-1 398.
DOI:10.1175/1520-0485(1991)021<1386:ROTWTP>2.0.CO;2 |
Matsumoto K, Honda M C, Sasaoka K, Wakita M, Kawakami H, Watanabe S. 2014. Seasonal variability of primary production and phytoplankton biomass in the western Pacific subarctic gyre: control by light availability within the mixed layer. Journal of Geophysical Research: Oceans, 119(9): 6 523-6 534.
DOI:10.1002/2014JC009982 |
Morel A, Claustre H, Gentili B. 2010. The most oligotrophic subtropical zones of the global ocean: similarities and differences in terms of chlorophyll and yellow substance. Biogeosciences, 7: 3 139-3 151.
DOI:10.5194/BG-7-3139-2010 |
Pingree RD, Pugh P R, Holligan P M, Forster G R. 1975. Summer phytoplankton blooms and red tides along tidal fronts in the approaches to the English Channel. Nature, 258(5537): 672-677.
DOI:10.1038/258672A0 |
Qiu B, Chen S M, Rudnick D L, Kashino Y. 2015. A new paradigm for the north Pacific subthermocline lowlatitude western boundary current system. Journal of Physical Oceanography, 45(9): 2 407-2 423.
|
Qiu ZF, Xiao C, Perrie W, Sun D Y, Wang S Q, Shen H, Yang D Z, He Y J. 2017. Using Landsat 8 data to estimate suspended particulate matter in the Yellow River Estuary. Journal of Geophysical Research: Oceans, 122(1): 276-290.
DOI:10.1002/2016JC012412 |
Santoso A, Mcphaden M J, Cai W J. 2017. The defining characteristics of ENSO extremes and the strong 2015/2016 El Niño. Reviews of Geophysics, 55(4): 1 079-1 129.
DOI:10.1002/2017RG000560 |
Spannl S, Volland F, Pucha D, Peters T, Cueva E, Bräuning A. 2016. Climate variability, tree increment patterns and ENSO-related carbon sequestration reduction of the tropical dry forest species Loxopterygium huasango of Southern Ecuador. Trees, 30(4): 1 245-1 258.
DOI:10.1007/s00468-016-1362-0 |
Suga T, Kato A, Hanawa K. 2000. North Pacific Tropical Water: its climatology and temporal changes associated with the climate regime shift in the 1970s. Progress in Oceanography, 47(2-4): 223-256.
DOI:10.1016/S0079-6611(00)00037-9 |
Talley LD. 1993. Distribution and formation of North Pacific intermediate water. Journal of Physical Oceanography, 23(3): 517-537.
DOI:10.1175/1520-0485(1993)023<0517:DAFONP>2.0.CO;2 |
Tan S C, Li J W, Che H Z, Chen B, Wang H. 2017. Transport of East Asian dust storms to the marginal seas of China and the southern North Pacific in spring 2010. Atmospheric Environment, 148: 316-328.
DOI:10.1016/J.ATMOSENV.2016.10.054 |
Távora J, Fernandes E H, Bitencourt L P, Orozco P M S. 2020. El-Niño Southern Oscillation (ENSO) effects on the variability of Patos Lagoon suspended particulate matter. Regional Studies in Marine Science, 40: 101495.
DOI:10.1016/j.rsma.2020.101495 |
Timmermann A, An S I, Kug J S, Jin F F, Cai W J, Capotondi A, Cobb K M, Lengaigne M, McPhaden M J, Stuecker M F, Stein K, Wittenberg A T, Yun K S, Bayr T, Chen H C, Chikamoto Y, Dewitte B, Dommenget D, Grothe P, Guilyardi E, Ham Y G, Hayashi M, Ineson S, Kang D, Kim S, Kim W, Lee J Y, Li T, Luo J J, McGregor S, Planton Y, Power S, Rashid H, Ren H L, Santoso A, Takahashi K, Todd A, Wang G M, Wang G J, Xie R H, Yang W H, Yeh S W, Yoon J, Zeller E, Zhang X B. 2018. El Niño-Southern Oscillation complexity. Nature, 559(7715): 535-545.
DOI:10.1038/S41586-018-0252-6 |
Tozuka T, Kagimoto T, Masumoto Y, Yamagata T. 2002. Simulated multiscale variations in the western tropical Pacific: the Mindanao dome revisited. Journal of Physical Oceanography, 32(5): 1 338-1 359.
DOI:10.1175/1520-0485(2002)032<1338:SMVITW>2.0.CO;2 |
Udarbe-Walker M J B, Villanoy C L. 2001. Structure of potential upwelling areas in the Philippines. Deep Sea Research Part I: Oceanographic Research Papers, 48(6): 1 499-1 518.
DOI:10.1016/S0967-0637(00)00100-X |
Wan SM, Yu Z J, Clift P D, Sun H J, Li A C, Li T G. 2012. History of Asian eolian input to the West Philippine Sea over the last one million years. Palaeogeography, Palaeoclimatology, Palaeoecology, 326-328: 152-159.
DOI:10.1016/J.PALAEO.2012.02.015 |
Wang ZY, Li W J, Zhang K N, Agrawal Y C, Huang H J. 2020. Observations of the distribution and flocculation of suspended particulate matter in the North Yellow Sea cold water mass. Continental Shelf Research, 204: 104187.
DOI:10.1016/J.CSR.2020.104187 |
Williams ND, Walling D E, Leeks G J L. 2007. High temporal resolution in situ measurement of the effective particle size characteristics of fluvial suspended sediment. Water Research, 41(5): 1 081-1 093.
DOI:10.1016/j.watres.2006.11.010 |
Woźniak S B, Meler J, Lednicka B, Zdun A, Stoń-Egiert J. 2011. Inherent optical properties of suspended particulate matter in the southern Baltic Sea. Oceanologia, 53(3): 691-729.
DOI:10.5697/OC.53-3.691 |
Yamaguchi Y, Kondo M, Kobori T. 2012. Safety inspections and seismic behavior of embankment dams during the 2011 off the Pacific Coast of Tohoku earthquake. Soils and Foundations, 52(5): 945-955.
DOI:10.1016/J.SANDF.2012.11.013 |
Yeh SW, Kug J S, Dewitte B, Kwon M H, Kirtman B P, Jin F F. 2009. El Niño in a changing climate. Nature, 461(7263): 511-514.
DOI:10.1038/NATURE08316 |
Yiǧiterhan O, Murray J W, Tuǧrul S. 2011. Trace metal composition of suspended particulate matter in the water column of the Black Sea. Marine Chemistry, 126(1-4): 207-228.
DOI:10.1016/J.MARCHEM.2011.05.006 |
Zhang KN, Wang Z Y, Li W J, Yan J. 2019. Properties of coarse particles in suspended particulate matter of the North Yellow Sea during summer. Journal of Oceanology and Limnology, 37(1): 79-92.
DOI:10.1007/S00343-019-7153-X |
Zhao WC, Sun Y B, Balsam W, Lu H Y, Liu L W, Chen J, Ji J F. 2014. Hf-Nd isotopic variability in mineral dust from Chinese and Mongolian deserts: implications for sources and dispersal. Scientific Reports, 4(1): 5 837.
DOI:10.1038/SREP05837 |