 2021, Vol. 39
Institute of Oceanology, Chinese Academy of Sciences
Article Information
- WANG Wenlong, DONG Dongdong, WANG Xiujuan, ZHANG Guangxu
- Three-stage tectonic subsidence and its implications for the evolution of conjugate margins of the southwest subbasin, South China Sea
- Journal of Oceanology and Limnology, 39(5): 1854-1870
- http://dx.doi.org/10.1007/s00343-020-0259-3
Article History
- Received Jul. 7, 2020
- accepted in principle Aug. 24, 2020
- accepted for publication Oct. 21, 2020


2 Laboratory for Marine Geology, Pilot National Laboratory for Marine Science and Technology (Qingdao), Qingdao 266237, China;
3 University of Chinese Academy of Sciences, Beijing 100049, China;
4 Center of Ocean Mega-Science, Chinese Academy of Sciences, Qingdao 266071, China
Subsidence is the vertical movement of the Earth's crust and plays a dominant role in basin development. The total subsidence of basins can be partitioned into tectonic subsidence caused by driving tectonic forces and nontectonic subsidence caused by the sediment load (Lu et al., 2001; Allen and Allen, 2013). A tectonic subsidence curve generally shows two stages over the complete rifting history of a basin: (1) rapid subsidence in the rifting stage; (2) slow subsidence during the post-rift stage (Allen and Allen, 2013). Subsidence is related to the lithospheric stretch and thermal relaxation (McKenzie, 1978; Royden and Keen, 1980). We can determine the degree of crustal thinning and stretching by studying the tectonic subsidence. The total amount and rate of tectonic subsidence reflect the characteristics of basin evolution; therefore, reconstruction of the tectonic subsidence history is helpful to understand basin formation mechanisms. Numerous sedimentary basins on passive continental margins are formed by continental extension and thus tectonic subsidence analysis is significant to understand continental stretching (Franke et al., 2014; Tugend et al., 2015; Ligi et al., 2018).
The South China Sea (SCS) is a marginal basin formed by Cenozoic extension of the South China continental margin, and contains rich hydrocarbon resources (Zhang et al., 2007, 2010). Its small scale, young age, and well-preserved conjugate margins make the SCS an ideal basin in which to study continental extension and ocean crust accretion (Taylor and Hayes, 1983; Zhou and Li, 2008). The SCS conjugate continental margins are different in both south-north direction and east-west direction (Hayes and Nissen, 2005). The differences are reflected in sedimentary thicknesses, detachment fault attitudes, crustal velocity structures (Franke et al., 2011; Qiu et al., 2011; Ruan et al., 2011; Wei et al., 2011; Ding et al., 2013; Dong et al., 2014; Pichot et al., 2014; Gao et al., 2015; Lü et al., 2017) and the widths of thinning continental crust. Therefore, the extension pattern of the southwest subbasin (SWB) margin should differ from the east subbasin (EB) margin, which has been intensively studied. The SWB originates from the SW-directed propagation of SCS seafloor spreading (Li et al., 2012; Le Pourhiet et al., 2018), thus the continental margin preserves the final extensional structure of the South China margin. The SWB has the smaller scale but the wider area of thinning crust than the EB (Fig. 1). There are many previous studies of sedimentary processes, structures and tectonic evolution of the EB based on International Ocean Discovery Program (IODP) data (Li et al., 2014; Larsen et al., 2018; Lin et al., 2019; Sun et al., 2019), just a few about the SWB due to the limited data there. Up to now, there is only one site, out of 18 sites from IODP and Ocean Drilling Program (ODP) legs in the SCS, is located on the SWB continental margins. Previous studies on tectonic subsidence of the SCS continental margins also focused on limited regions (Dong et al., 2008; Zhao et al., 2011; Xie et al., 2014; Fang et al., 2017), but an integrated analysis of tectonic subsidence on the SWB conjugate continental margins has not been carried out yet. In this study, the latest high-resolution multichannel seismic profile, spanning the conjugate margins of the SWB, is used to reconstruct the tectonic subsidence history of its conjugate continental margins, and the formation mechanisms are finally proposed based on the data analysis.

|
| Fig.1 Bathymetric map of the South China Sea (Smith and Sandwell, 1997) with seismic lines L1: this study; L2: Yuan, 2009; L3: Zhao et al., 2018a; L4: Franke et al., 2014; L5: Sun et al., 2011; L6: Ding et al., 2013. The continentocean boundary (COB): Pichot et al., 2014. The spreading center: Pichot et al., 2014. ZN Fault: Zhongnan Fault; NW Sub.: Northwest subbasin; East Sub.: East subbasin; SW Sub.: Southwest subbasin; PRMB: Pearl River Mouth basin; QDNB: Qiongdongnan basin; XTB: Xisha Trough basin; ZTB: Zhongsha Trough basin; ZJNB: Zhongjiannan basin; NTB: Nansha Trough basin; JZB: Jiuzhang basin; 1: Andubei basin (ADBB); ODP1143: Ocean Drilling Program site 1143. |
The SCS is the largest marginal sea in the western Pacific Ocean with the area of approximately 3.5 million km2 and the average water depth of 1 212 m. The SCS is located between the Pacific, Eurasian, and Indo-Australian plates, and is positioned where the Pacific and Tethys tectonic domains overlap. Therefore, the tectonic evolution of the SCS region is multistage and complex.
The SCS consists of three subbasins: the SWB, the northwest subbasin (NWB), and the EB (Fig. 1). The boundary of the SWB and EB is the Zhongnan Fault, a north-south-trending fault that extends along a seamount chain near 116°E (Li et al., 2008). The oceanic basin of the SWB is V-shaped with a pair of thinning continental margins (Fig. 1). The volume of thinning SWB continental crust is greater than the EB, and thus presumably required a longer time to form (Bai et al., 2015). It is generally thought that the main body of the SCS formed by seafloor spreading from 33 to 16 Ma, but there are still large differences regarding the detailed spreading age (Taylor and Hayes, 1980, 1983; Briais et al., 1993; Li et al., 2014). Based on the latest data from IODP Exp. 349, it appears that the SWB opened at ~23.6 Ma and seafloor spreading ended at ~16 Ma, while the period of EB seafloor spreading was 33–15 Ma (Li et al., 2014).
The SCS evolved from the rifting of the South China continental margin in the late Mesozoic to subsequent seafloor spreading in the Miocene (Franke et al., 2014; Li et al., 2014; Zhang et al., 2015). The Nansha block drifted southward to its present location with the expansion of the SCS (Taylor and Hayes, 1980). According to the current formation model of the SCS, the Nansha block, the Pearl River basin, and the Zhongsha-Xisha block all belonged to the South China continental margin before rifting (Li et al., 2007). The formation mechanism of V-shaped oceanic basins is not clear. Seafloor spreading in the SWB is a propagating process (Li et al., 2012), and the far-field compression exerted by the Indochina Peninsula may have been one of the controlling factors (Le Pourhiet et al., 2018). Therefore, the structure of the SWB margins could reflect the final state of South China continental margin extension and SCS formation. As there are few studies on this topic, an integrated study on the structure and evolution of the SWB conjugate margins is significant for a better understanding of South China margin extension and SCS final formation.
3 DATA AND METHOD 3.1 Data 3.1.1 Multichannel seismic dataThe seismic data used in this study were acquired in 2013 through the cooperation between Institute of Oceanology, Chinese Academy of Sciences and China National Offshore Oil Corporation. The seismic line spans the conjugate margins of SWB, across the Qiongdongnan and Zhongjiannan basins, the oceanic basin, Jiuzhang and Andubei basins and the Nansha Trough from north to south (Fig. 1). It has a total length of 1 221 km, about 500 km in the northern margin, 481 km in the southern margin and 240 km in the oceanic basin. The acquisition streamer is 6-km long, consisting of 480 channels with the channel interval of 12.5 m. The total volume of air guns is 3 960 cubic inch (about 0.065 cubic meter). The data processing scheme includes prestack denoising, multiple suppression, amplitude recovery, predictive deconvolution, prestack time migration, and poststack filtering. Prestack depth migration is also carried out to obtain the profile in the depth domain.
3.1.2 Sequence framework and ageThe stratigraphic sequence and their ages in the Qiongdongnan basin and Nansha block have different naming systems (Wu et al., 2009; Yuan, 2009; Zhang, 2010; Sun et al., 2011; Ding et al., 2013; Qiu et al., 2014), but ages of the main sequence interfaces are comparable. In this study, we use the naming system of interface ages, i.e. S plus age in Ma to name the sequence interfaces. They were S1.9, S5.5, S10.5, S16, S18.5, and S33 respectively, and Tg for the top basement. The interface depths are obtained directly from the seismic interpretation in the depth domain.
The breakup unconformity (BU) is diachronous according to study of other scholars (Sun et al., 2011; Franke et al., 2014; Sibuet et al., 2016). The seafloor spreading in SWB started at about 23.6 Ma and ended at about 16 Ma (Li et al., 2014), which means the age of breakup unconformity changes from 23.6 to 16 Ma in SWB. There are different views about the age of BU adjacent to our study line, 27–22 Ma (Sibuet et al., 2016), 21.5 Ma (Barckhausen et al., 2014), 19 Ma (Le Pourhiet et al., 2018), 18.5 Ma (Li et al., 2012), and middle Miocene (Ding et al., 2015). The progressive seafloor spreading of SWB (Huchon et al., 2001; Li et al., 2012; Le Pourhiet et al., 2018) makes the BU becomes younger from east to west. The recognizably oldest magnetic anomaly near the line is the C5e, which is regarded as 18.5 Ma (Briais et al., 1993; Cande and Kent, 1995). Therefore, we use 18.5 Ma as the breakup age in our study area, consistent with the previous study (Li et al., 2012), and S18.5 as the breakup unconformity. In previous tectonic subsidence studies, Tg in the northern SCS margin has ever been assigned to 66 Ma (Xie et al., 2014), 55 Ma (Lei et al., 2015), 50 Ma (Dong et al., 2008), and 45 Ma (Clift et al., 2015; Zhao et al., 2018a), thus we applied 66 Ma and 45 Ma as the lower and upper limit of the basement age respectively for the calculations of subsidence rate and test the uncertainty.
3.1.3 Lithological informationThe lithological data takes into account lithological profile (Zhao et al., 2011; Qiu et al., 2014) (Fig. 2), sedimentary facies, and environments of SWB conjugate margins (Wu et al., 2009), e.g. the main period of reef growth during the Miocene (Franke et al., 2011; Ma et al., 2011; Fyhn et al., 2013; Savva et al., 2013; Steuer et al., 2014). Sandstone and mudstone are the dominant lithology from Tg to S0, and limestone developed mainly in Middle Miocene, which are both considered in the parameterization. The porosity and decompaction coefficient of each sedimentary layer are obtained by calculating the lithological data with the method of Sclater and Christie (1980). Lithological details are listed in Table 1.

|
| Fig.2 Lithologic column of the SWB margins along with a eustatic curve and tectonic events U: up; M: middle; L: low. Q: Quaternary; Mes. : Mesozoic. |
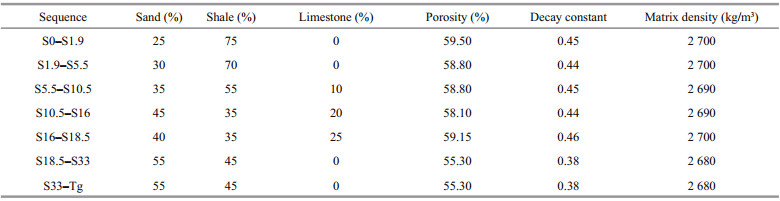
The porosity-depth relation in the study is a widely accepted exponential function Eq.1 (Sclater and Christie, 1980; Allen and Allen, 2013; Zhao et al., 2018b):
 (1)
(1)where Φ is porosity, Φ0 is the initial porosity, c is the decay constant, z is the depth from the seafloor. We used physical parameters of sediment according to the previous studies, which have been applied successfully in the study area (Fang et al., 2017; Shi et al., 2017; Mao et al., 2020). The density of mantle and seawater is 3 330 kg/m3 and 1 030 kg/m3, respectively.
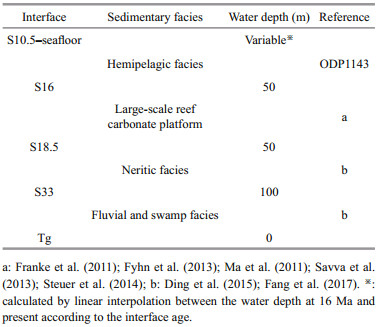
3.1.4 Paleowater depth and sea level changeRegional sedimentary facies can be used to estimate paleowater depth (Xie et al., 2006, 2014; Dong et al., 2008; Fang et al., 2017; Shi et al., 2017). Based on the terrestrial facies (Ding et al., 2015; Fang et al., 2017), the paleowater depth from Tg to 33 Ma is estimated to be 0–100 m. In Zhongjiannan basin, large-scale reef carbonate platform, the dominant structure in the study area, developed widely in the middle Miocene (Ma et al., 2011; Fyhn et al., 2013; Savva et al., 2013) and the southern margin is similar, where the Nido carbonate reef complexes developed until the middle Miocene (Franke et al., 2011; Steuer et al., 2014). It is considered a shallower water depth (50 m) for reef development from 18.5–16 Ma and an increasing water depth after 16 Ma, similar to previous studies (Fang et al., 2017). A linear interpolation is applied to the water depth from 16 Ma to the present (Table 2). A third-order global sea level change curve (Haq et al., 1987) is used for the eustatic correction (Fig. 2).
Based on previous researches (Yuan, 2009; Cullen, 2010; Zhang, 2010; Sun et al., 2011; Ding et al., 2013; Franke et al., 2014), we identify the wave group characteristics of each sequence (Fig. 3) and track them along the seismic line. In particular, the intersecting profile (Yuan, 2009) and close parallel lines (Ding et al., 2013; Zhao et al., 2018a) are referred for the seismic interpretation. Because the southernmost part of the seismic line illustrated disturbance in the southern margin by later compressional stress from the collision with Borneo, we ignored this part and focused on the extensional structures on the northern and southern margins, ca. 400 km on each side.

|
| Fig.3 Wave group characteristics of each sequence |
Previous studies on tectonic subsidence focused mostly on water-loaded subsidence (Steckler and Watts, 1978; Sclater and Christie, 1980; Shi et al., 2005; Xie et al., 2014). However, the maximum water depth in this study is more than 4 000 m and exerts an extra stress of more than 40 MPa, thus the water load effect cannot be neglected. Therefore, empty basin subsidence (i.e. tectonic subsidence) can reflect the more realistic geology. We calculated the empty basin subsidence by Eq.3 (Zhao et al., 2013), which is derived from Eq.2, a method to calculate water-loaded subsidence (Steckler and Watts, 1978).
 (2)
(2)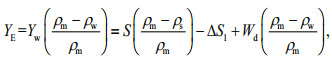 (3)
(3)where Yw, YE is the water-loaded and empty basin subsidence, respectively; S is the sediment thickness (after decompaction), ρm, ρw, and ρs is the density of mantle, water, and sediment, respectively, Wd is the paleowater depth and ΔS1 is sea level change compared with the present sea level.
3.3 Uncertainties in the calculationGenerally, there are some uncertainties in the calculation of tectonic subsidence (Xie et al., 2014; Zhao et al., 2018a), especially for the area like SWB with few accessible drilling hole, although we have combined different types of data as many as possible. If we assign the value of ρw, ρs, and ρm in Eq.3 as 1 030, 2 330, and 3 330 kg/m3, respectively, the Eq.3 is changed to Eq.4:
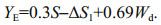 (4)
(4)Figure 2 shows that the range of sea level change (ΔSl) is less than 300 m, much smaller than the subsidence. The coefficient of S is only 0.3, which is the smallest coefficient in Eq.4. The depths of sequence boundaries from the high-resolution seismic profiles minimize the errors of sediment thickness S. Therefore, S may not be the main source of the uncertainties. Same as the previous studies, the paleo water depth is probably the major source of uncertainty (Xie et al., 2014). Considering few well is accessible here, we refer to plenty of previous studies (Table 2) for estimation of the paleo water depth, which could minimize the uncertainty.
4 RESULT 4.1 Interpretation of seismic dataFrom the seismic data, it is apparent that the water depth in the northern margin gradually deepens seaward to be more than 4 000 m in the greatest depth. The synrift sequence amounts to 3 000-m thick, while the spreading and the post-spreading sequences are relatively thinner with lateral variations. Similarly-sized faults cutting the basement are uniformly distributed along the entire seismic line, and then many horsts and grabens have developed (Fig. 4a & c). The period of faulting can be confirmed according to the age of the penetrated stratum (Zeng and Fan, 2008). The faulting was active before 18.5 Ma, but almost inactive after then.

|
| Fig.4 Depth profile of the northern (a) and southern (b) margins; seismic section illustrating the graben (c), located in the box area in (a); seismic section illustrating the half graben (d), located in the box area in (b) |
Like the northern margin, the southern margin also has increasing-seaward water depths, only with some local fluctuations in the reefs. The sequences in the southern margin are thinner than in the northern margin, but both margins have thicker sequences under S18.5 than above it. However, the southern margin is divided into smaller parts by the basement faults, forming many sedimentary sags, most of which are faulted in the south and overlapped in the north. The faults are evenly distributed along the seismic profile without significant dominant faults. According to the attitude of the sedimentary sequence, the faults in the southern part are inferred to have been active during the synrift stage and inactive after 18.5 Ma (Fig. 4b & d).
In summary, the sedimentary and tectonic characteristics of the SWB conjugate margins are: (1) greater sediment thickness in the northern margin than in the southern margin; (2) greater sediment thickness in the synrift period than the spreading and post-spreading stages; (3) uniformly distributed faults on a similar scale, with no obvious dominant faults; (4) main faulting period before 18.5 Ma; (5) many horst and graben structures in the northern margin, but a large number of half-grabens that are faulted in the south and overlapped in the north in the southern margin.
4.2 Tectonic subsidenceWe select the pseudo wells every kilometer along the seismic line for the calculation of tectonic subsidence curves. Fitting curves are generated with polynomials and display the overall trend of the line (Figs. 5 & 6).

|
| Fig.5 Tectonic subsidence curves (a) and fitting curves (b) of the northern continental margin The fitting curves are generated with polynomials and display the overall trend of the line. R2 is the determination coefficient of the fitting curve and indicates a better fit as it approaches 1. |

|
| Fig.6 Tectonic subsidence curves (a) and fitting curves (b) of the southern continental margin The fitting curves are generated with polynomials and display the overall trend of the line. R2 is the determination coefficient of the fitting curve and indicates a better fit as it approaches 1. |
The tectonic subsidence of the northern continental margin is small from Tg to 16 Ma and increases sharply after 16 Ma (Fig. 5a).
Tg–33 Ma: the tectonic subsidence is small, with a lateral change along the seismic line at 33 Ma. The tectonic subsidence of the Zhongjiannan basin is larger than the Zhongjian terrace and the continent-ocean boundary (COB; Fig. 5a). Overall, the tectonic subsidence rate is less than 20 m per million years during this period (Fig. 7a).

|
| Fig.7 Tectonic subsidence rates at different stages on the northern (a) and southern (b) continental margins The error bars are related to the basement age (lower limit 66 Ma, upper limit 45 Ma) and are shown in the curve of Tg–S33. |
33–18.5 Ma: tectonic subsidence increases slightly but is still small. The increase is larger in the southern part than in the northern Zhongjiannan basin. The tectonic subsidence at the COB increased by approximately 700 m (Fig. 5a). The tectonic subsidence rate is up to 50 m per million years along most of the margin (Fig. 7a).
18.5–16 Ma: the change in tectonic subsidence during this period is very small. In most of the northern margin, tectonic subsidence is even getting smaller during this period, shown by the curve S16 above curve S18.5 (Fig. 5a), which suggests a tectonic rebound (Fig. 7a). The same feature is seen in 21 pseudo-wells (Fig. 8a). The tectonic subsidence rate decreases from the continent to the ocean (Fig. 9).


|
| Fig.9 Tectonic subsidence rate of points in northern margin (the location can be seen in Fig. 4) Tectonic subsidence rate of points N-1 (a), N-2 (b), N-3 (c), and N-4 (d). The error from the basement age uncertainty (lower limit 66 Ma, upper limit 45 Ma) is shown in the shadowed area. |
16–10.5 Ma: the tectonic subsidence increases sharply and shows an increasing trend from the continent to the ocean. The tectonic subsidence rate shows the same trend as the overall subsidence, with a maximum value of 220 m per million years, and reaches its peak of the whole subsidence history.
10.5–0 Ma: the tectonic subsidence rate shows the same trend as the last period (Fig. 7a). The tectonic subsidence increases gradually over this period (Fig. 5a).
The tectonic subsidence center in the northern margin shifts from the continent to the ocean with basin evolution. This feature is seen clearly in the subsidence fitting curves (Fig. 5b).
4.2.2 Tectonic subsidence characteristics of the southern continental marginTectonic subsidence trend in the southern continental margin is similar to the northern margin. The whole seismic line indicates relatively small subsidence before 18.5 Ma, and the tectonic subsidence slightly increases or even decreases during 18.5–16 Ma. After 16 Ma, the tectonic subsidence increases sharply (Figs. 6a & 8b).
Tg–33 Ma: the tectonic subsidence is small, and the amount in the Andubei basin is larger than the continental margin at the COB and Jiuzhang basin (Fig. 6a). The tectonic subsidence rate is less than 20 m per million years (Fig. 7b).
33–18.5 Ma: the tectonic subsidence becomes larger with the subsidence center in the Andubei basin (Fig. 6a). The tectonic subsidence rate reaches 30 m per million years (Fig. 7b).
18.5–16 Ma: the subsidence decreases relative to the last period in most regions and is the same as the subsidence in 21 pseudo-wells (Fig. 8b). This result indicates that uplift trends are gradually increasing from the continent to the ocean (Figs. 7b & 10).

|
| Fig.10 Tectonic subsidence rate of points in southern margin (the location can be seen in Fig. 4) Tectonic subsidence rate of points S-1 (a), S-2 (b), S-3 (c), and S-4 (d). The error from the basement age uncertainty (lower limit 66 Ma, upper limit 45 Ma) is shown in the shadowed area. |
16–10.5 Ma: the margin begins to subside rapidly and shows a trend of increasing subsidence from the continent to the ocean. At this time, the tectonic subsidence center is in the Andubei basin (Fig. 6). The tectonic subsidence rate shows the same trend as the subsidence increase, with a maximum of approximately 220 m per million years at the continental margin of the COB (Fig. 7b).
10.5–0 Ma: the subsidence feature is like the northern margin. The tectonic subsidence rates show the same trend as the last period (Fig. 7b). Tectonic subsidence increases gradually during this period (Fig. 6a).
From the subsidence fitting curves, we suggest that the tectonic subsidence center of the southern margin also shifts from the continent to the ocean with evolution (Fig. 6b).
4.3 Three-stage tectonic subsidence in the SWB marginsTo analyze the tectonic subsidence in different periods more clearly, 42 pseudo-wells are extracted every 20 km along the seismic line, and the subsidence rates for 8 typical points along the line are calculated. The 8 points are all in sags, which are selected from continent to ocean in the conjugate margins. The results show that the tectonic subsidence of both SWB conjugate margins could be divided into three stages: (1) slow subsidence from Tg to 18.5 Ma (synrift stage); (2) extremely slow subsidence/uplift from 18.5 to 16 Ma (spreading stage); (3) accelerated subsidence from 16 to 0 Ma (post-spreading stage) (Figs. 8–10). The tectonic subsidence rates from 18.5 to 16 Ma decreases gradually on the conjugate margins from the continent to the ocean (Figs. 9–10).
5 DISCUSSION 5.1 Lower crust flow in the SCSThree models were used to test the effects of stratified rheology on lithospheric deformation during the synrift stage (ter Voorde et al., 1998): fully coupled, fully decoupled, and transitional style. In terms of rheological characteristics and lithospheric thermal state, lithosphere is generally fully coupled in cold and hard state while completely decoupled in abnormally hot state. When faulting occurs in fully decoupled and transitional styles, lower crustal material compensates for upper crustal thinning, and mantle material also compensates for the change in the lower crust. Brune and Ellis (1997) used a wax model to test the tectonic response of rifted lithosphere and proposed that the ductile material in the lower crust would flow to accommodate the brittle deformation in the upper crust.
The upper and lower crust in the SCS northern margin are considered decoupled, and the lower crustal flow controls the difference between the upper and lower crustal stretch factors (Bai et al., 2019). This is apparent in the Qiongdongnan basin, which has continental extension discrepancy and anomalous subsidence (Zhao et al., 2013). The numerical model of weaker lower crust was successfully used to simulate continental margin extension of the SCS (Brune et al., 2017). Crustal structure discovered by ocean bottom seismometers showed the stretching factor variation between the upper and lower crust in the SWB continental margins (Qiu et al., 2011; Pichot et al., 2014; Lü et al., 2017), indicating the decoupled crust.
The earliest quantitative subsidence analysis of the North Sea basin, an older Triassic basin (McKenzie, 1978; Sclater and Christie, 1980), laid the foundation for the classic rifted basin subsidence. The SWB margins are much younger and therefore warmer (Dong et al., 2020). For example, heat flow of the central North Sea basin is less than 50 mW/m2 (Andrews-Speed et al., 1764), while 65–105 mW/m2 in most area of SWB margins (Wang, 2015). That implies that the lower crust of the SWB margin should be prone to flow. Recently published article shows solid evidence of the lower crustal flow of northern margin of SCS based on high-resolution seismic data (Deng et al., 2020). Numerical modeling showed that margins with the weaker lower crust brought the wider thinning areas and the longer rifting time (Ros et al., 2017). The SWB has a wider thinning continental margin than the EB (Fig. 1) and experienced a longer synrift stage, therefore, the lower crust of the SWB margins is likely weaker than the EB during tectonic development due to its warmer state over time. The lower crustal flow may be crucial to the evolution of the SWB margins.
5.2 Mechanisms for three-stage tectonic subsidenceThe tectonic subsidence of classic sedimentary basins shows two distinct characteristics, rapid subsidence during the synrift stage and slow subsidence during the postrift stage (Lu et al., 2001). However, the tectonic subsidence of the SWB conjugate margins consists of three stages: (1) slow subsidence during the synrift stage; (2) extremely slow subsidence/uplift during the spreading stage; (3) accelerated subsidence during the post-spreading stage (Fig. 8). The tectonic subsidence center shifted from the proximal continental margin to the distal continental margin with basin evolution (Figs. 5b & 6b).
We propose that lower crust flow played an important role in the evolution of the rifted SWB margins. Balance among sediment loading, lower crust flow and mantle convection likely controlled the three stages of tectonic subsidence. Dynamic mechanisms for each stage are suggested based on the observation and our research results.
5.2.1 Tg–18.5 Ma: slow subsidence stageWhen the brittle upper crust of the SWB margins was thinned by faulting during the synrift stage, the lower crust flowed into the faulting center under the pressure of weakly faulted blocks on both sides (Bai et al., 2019), which compensated for the crustal thinning. At the same time, mantle material upwelled (ter Voorde et al., 1998). Under the combined effects of these two mechanisms, the tectonic subsidence rate was relatively slow during the synrift stage (Fig. 11a). The lower crust of the SWB margins is weaker than the EB, so subsidence in the EB margins during the synrift stage was not as slow as in the SWB margins (Dong et al., 2008).

|
| Fig.11 Mechanisms of tectonic subsidence and the tectonic evolution model of the SWB margins a. synrift stage, during which the lower crust flow compensated for the thinning of the upper crust caused by faulting leads to slow subsidence; b. spreading stage, during which small-scale secondary mantle convection occurred under the necking zone, raising the isotherms. The density of the continental margin decreased with increasing temperature; therefore, the buoyancy became higher and extremely slow subsidence or uplift occurred; c. post-spreading stage, during which the weaker lower crust flowed to the proximal continental margin under sediment loading. In addition, mantle convection gradually ceased because seafloor spreading stopped; therefore, the lifting effect of mantle convection vanished. The temperature of the margins decreased and then the basin entered the thermal relaxation stage. As a result, rapid subsidence occurred. |
There are many mechanisms for margins tectonic subsidence decrease, including small-scale convection (Steckler, 1985), dynamic (Braun and Beaumont, 1989; Esedo et al., 2012), regional isostatic (Braun and Beaumont, 1989), phase transition (Esedo et al., 2012), and removal of mantle lithosphere (Esedo et al., 2012). During the spreading stage, SWB continental margin rifting decreased because the extensional strain was primarily accommodated by seafloor spreading. The lithosphere under the conjugate margins formed a necking zone in the continent-ocean transitional zone. Asthenospheric material upwelled to form oceanic crust and small-scale secondary mantle convection (King and Anderson, 1998) simultaneously occurred under the necking zone (Roger Buck, 1986; Huismans and Beaumont, 2011). The secondary convection increased the temperature structure of the continental margins (Steckler, 1985), and then the buoyancy increased due to the decreased density of the margin. In addition, secondary mantle convection exerted a lifting effect on the overriding continental margin especially the distal margin. Therefore, the tectonic subsidence rate of the continental margin decreased, which promoted an extremely slow tectonic subsidence rate or even uplift (Fig. 11b).
5.2.3 16–0 Ma: accelerated subsidence stageThere was accelerated subsidence during the post-spreading stage without the development of brittle faults. Therefore, tectonic subsidence was not considered to be related to extension and thinning of the brittle upper crust. Accumulated sediments of this period shown by the seismic profile are so thick, even more than 5 km in the basin center, that they disturbed and readjusted the final stress balance. The weaker lower crust probably flowed to the proximal continental margin from distal margin because of sediment loading (Zhao et al., 2018a). The crustal thickness of the distal margins decreased. In addition, mantle convection gradually ceased with the end of seafloor spreading. Therefore, the lifting effect of mantle convection vanished. The temperature of the margins decreased, and the margins came into the thermal relaxation stage. As a result, the rapid subsidence occurred (Fig. 11c).
5.3 Tectonic evolution of the SWB marginsThe lower crust of the SWB margins was weak and prone to flow during extension because of its warm state, which played a major role in the margin extension. The brittle upper crust was extended and thinned by normal faults during the synrift stage, and lower crustal material flowed into the basin to compensate for upper crust thinning. Therefore, the continental margins were strongly extended with small tectonic subsidence. Finally, the lithosphere broke up and the oceanic basin formed by seafloor spreading. The faulting of the conjugate margins decreased sharply, and small-scale secondary mantle convection formed under the necking zone, which increased the temperature and the buoyancy. The secondary mantle convection also exerted a lifting force on the continental margins. All these factors led to extremely slow tectonic subsidence or even uplift during the spreading stage. The seafloor spreading ended at 16 Ma due to the collision between the southern continental margin and the Borneo block (Li et al., 2014). Afterwards, the secondary mantle flow gradually disappeared, and the conjugate margins experienced thermal relaxation. The lower crustal material flowed from the distal margin to the proximal margin as a result of large sediment loading. Therefore, crustal thickness of distal margin decreased, and accelerated tectonic subsidence occurred (Fig. 11).
6 CONCLUSIONWe completed sedimentary sequence interpretation, structural analysis, and tectonic subsidence calculations for the SWB conjugate margins based on a long high-resolution seismic profile. Tectonic subsidence could be divided into three stages based on rates: (1) slow subsidence from Tg–18.5 Ma (synrift stage); (2) extremely slow subsidence/uplift from 18.5–16 Ma (spreading stage); (3) accelerated uplift from 16–0 Ma (post-spreading stage). This feature is in contrast to the classic tectonic subsidence scheme for rifted basins, which exhibit rapid subsidence during the synrift stage and slow subsidence during the post-rift stage.
Based on previous studies, the lower crust of the SWB margins is considered relatively weak and prone to flow laterally due to its warm thermal state. The lower crust compensated for the thinning of the faulted upper crust, leading to slow subsidence during the synrift stage. Small-scale secondary mantle convection formed under the necking zone during the spreading stage, which raised the continental margin temperature, buoyancy and exerted a lifting effect on the overriding lithosphere. Therefore, the subsidence became very slow, or even uplift. The effect of mantle convection vanished, the total sediment became thicker, and the lower crust material flowed landward driven by the sediment loading during the post-spreading stage. Thermal relaxation, vanish of secondary mantle convection, and lower crust flow jointly lead to rapid subsidence in this stage. In summary, lower crustal flow played an important role in the tectonic evolution of the SWB continental margins.
7 DATA AVAILABILITY STATEMENTThe data that support the findings of this study are available from the corresponding author upon reasonable request.
Allen P A, Allen J R. 2013. Basin Analysis: Principles and Application to Petroleum Play Assessment. 3rd edn. John Wiley & Sons, Ltd., UK. 619p.
|
Andrews-Speed C P, Oxburgh E R, Cooper B A. 1764. Temperatures and depth-dependent heat flow in western North Sea. AAPG Bulletin, 68(11): 1 764-1 781.
DOI:10.1306/AD461999-16F7-11D7-8645000102C1865D |
Bai Y L, Dong D D, Brune S, Wu S G, Wang Z J. 2019. Crustal stretching style variations in the northern margin of the South China Sea. Tectonophysics, 751: 1-12.
DOI:10.1016/j.tecto.2018.12.012 |
Bai Y L, Wu S G, Liu Z, Müller R D, Williams S E, Zahirovic S, Dong D D. 2015. Full-fit reconstruction of the South China Sea conjugate margins. Tectonophysics, 661: 121-135.
DOI:10.1016/j.tecto.2015.08.028 |
Barckhausen U, Engels M, Franke D, Ladage S, Pubellier M. 2014. Evolution of the South China Sea: revised ages for breakup and seafloor spreading. Marine and Petroleum Geology, 58: 599-611.
DOI:10.1016/j.marpetgeo.2014.02.022 |
Braun J, Beaumont C. 1989. A physical explanation of the relation between flank uplifts and the breakup unconformity at rifted continental margins. Geology, 17(8): 760-764.
DOI:10.1130/0091-7613(1989)017<0760:apeotr>2.3.co;2 |
Briais A, Patriat P, Tapponnier P. 1993. Updated interpretation of magnetic anomalies and seafloor spreading stages in the South China Sea: implications for the Tertiary tectonics of Southeast Asia. Journal of Geophysical Research, 98(B4): 6 299-6 328.
DOI:10.1029/92jb02280 |
Brune J N, Ellis M A. 1997. Structural features in a brittle-ductile wax model of continental extension. Nature, 387(6628): 67-70.
DOI:10.1038/387067a0 |
Brune S, Heine C, Clift P D, Pérez-Gussinyé M. 2017. Rifted margin architecture and crustal rheology: reviewing Iberia-Newfoundland, Central South Atlantic, and South China Sea. Marine and Petroleum Geology, 79: 257-281.
DOI:10.1016/j.marpetgeo.2016.10.018 |
Cande S C, Kent D V. 1995. Revised calibration of the geomagnetic polarity timescale for the Late Cretaceous and Cenozoic. Journal of Geophysical Research, 100(B4): 6 093-6 095.
DOI:10.1029/94JB03098 |
Clift P D, Brune S, Quinteros J. 2015. Climate changes control offshore crustal structure at South China Sea continental margin. Earth and Planetary Science Letters, 420: 66-72.
DOI:10.1016/j.epsl.2015.03.032 |
Cullen A B. 2010. Transverse segmentation of the Baram-Balabac Basin, NW Borneo: refining the model of Borneo's tectonic evolution. Petroleum Geoscience, 16(1): 3-29.
DOI:10.1144/1354-079309-828 |
Deng H D, Ren J Y, Pang X, Rey P F, McClay K R, Watkinson I M, Zheng J Y, Luo P. 2020. South China Sea documents the transition from wide continental rift to continental break up. Nature Communications, 11: 4 583.
DOI:10.1038/s41467-020-18448-y |
Ding W W, Franke D, Li J B, Steuer S. 2013. Seismic stratigraphy and tectonic structure from a composite multi-channel seismic profile across the entire Dangerous Grounds, South China Sea. Tectonophysics, 582: 162-176.
DOI:10.1016/j.tecto.2012.09.026 |
Ding W W, Li J B, Dong C Z, Fang Y X. 2015. Oligocene-Miocene carbonates in the Reed Bank area, South China Sea, and their tectono-sedimentary evolution. Marine Geophysical Research, 36(2-3): 149-165.
DOI:10.1007/s11001-014-9237-5 |
Dong D D, Wu S G, Li J B, Lüdmann T. 2014. Tectonic contrast between the conjugate margins of the South China Sea and the implication for the differential extensional model. Science China Earth Sciences, 57(6): 1 415-1 426.
DOI:10.1007/s11430-013-4740-0 |
Dong D D, Wu S G, Zhang G C, Yuan S Q. 2008. Rifting process and formation mechanisms of syn-rift stage prolongation in the deepwater basin, northern South China Sea. Chinese Science Bulletin, 53(23): 3 715-3 725.
DOI:10.1007/s11434-008-0326-1 |
Dong M, Wu S G, Zhang J, Xu X, Gao J W, Song T R. 2020. Lithospheric structure of the Southwest South China Sea: implications for rifting and extension. International Geology Review, 62(7-8): 924-937.
DOI:10.1080/00206814.2018.1539926 |
Esedo R, van Wijk J, Coblentz D, Meyer R. 2012. Uplift prior to continental breakup: indication for removal of mantle lithosphere?. Geosphere, 8(5): 1 078-1 085.
DOI:10.1130/ges00748.1 |
Fang P G, Ding W W, Fang Y X, Zhao Z X, Feng Z B. 2017. Cenozoic tectonic subsidence in the southern continental margin, South China Sea. Frontiers of Earth Science, 11(2): 427-441.
DOI:10.1007/s11707-016-0594-z |
Franke D, Barckhausen U, Baristeas N, Engels M, Ladage S, Lutz R, Montano J, Pellejera N, Ramos E G, Schnabel M. 2011. The continent-ocean transition at the southeastern margin of the South China Sea. Marine and Petroleum Geology, 28(6): 1 187-1 204.
DOI:10.1016/j.marpetgeo.2011.01.004 |
Franke D, Savva D, Pubellier M, Steuer S, Mouly B, Auxietre J L, Meresse F, Chamot-Rooke N. 2014. The final rifting evolution in the South China Sea. Marine and Petroleum Geology, 58: 704-720.
DOI:10.1016/j.marpetgeo.2013.11.020 |
Fyhn M B W, Boldreel L O, Nielsen L H, Giang T C, Nga L H, Hong N T M, Nguyen N D, Abatzis I. 2013. Carbonate platform growth and demise offshore Central Vietnam: effects of Early Miocene transgression and subsequent onshore uplift. Journal of Asian Earth Sciences, 76: 152-168.
DOI:10.1016/j.jseaes.2013.02.023 |
Gao J W, Wu S G, Mcintosh K, Mi L J, Yao B C, Chen Z M, Jia L K. 2015. The continent-ocean transition at the mid-northern margin of the South China Sea. Tectonophysics, 654: 1-19.
DOI:10.1016/j.tecto.2015.03.003 |
Haq B U, Hardenbol J, Vail P R. 1987. Chronology of fluctuating sea levels since the Triassic. Science, 235(4793): 1 156-1 167.
DOI:10.1126/science.235.4793.1156 |
Hayes D E, Nissen S S. 2005. The South China Sea margins: implications for rifting contrasts. Earth and Planetary Science Letters, 237(3-4): 601-616.
DOI:10.1016/j.epsl.2005.06.017 |
Huchon P, Nguyen T N H, Chamot-Rooke N. 2001. Propagation of continental break-up in the southwestern South China Sea. Geological Society, London, Special Publications, 187(1): 31-50.
DOI:10.1144/gsl.sp.2001.187.01.03 |
Huismans R, Beaumont C. 2011. Depth-dependent extension, two-stage breakup and cratonic underplating at rifted margins. Nature, 473(7345): 74-78.
DOI:10.1038/nature09988 |
King S D, Anderson D L. 1998. Edge-driven convection. Earth and Planetary Science Letters, 160(3-4): 289-296.
DOI:10.1016/S0012-821X(98)00089-2 |
Larsen H C, Mohn G, Nirrengarten M, Sun Z, Stock J, Jian Z, Klaus A, Alvarez-Zarikian C A, Boaga J, Bowden S A, Briais A, Chen Y, Cukur D, Dadd K, Ding W, Dorais M, Ferré E C, Ferreira F, Furusawa A, Gewecke A, Hinojosa J, Höfig T W, Hsiung K H, Huang B, Huang E, Huang X L, Jiang S, Jin H, Johnson B G, Kurzawski R M, Lei C, Li B, Li L, Li Y, Lin J, Liu C, Liu C, Liu Z, Luna A J, Lupi C, McCarthy A, Ningthoujam L, Osono N, Peate D W, Persaud P, Qiu N, Robinson C, Satolli S, Sauermilch I, Schindlbeck J C, Skinner S, Straub S, Su X, Su C, Tian L, van der Zwan F M, Wan S, Wu H, Xiang R, Yadav R, Yi L, Yu P S, Zhang C, Zhang J, Zhang Y, Zhao N, Zhong G, Zhong L. 2018. Rapid transition from continental breakup to igneous oceanic crust in the South China Sea. Nature Geoscience, 11(10): 782-789.
DOI:10.1038/s41561-018-0198-1 |
Le Pourhiet L, Chamot-Rooke N, Delescluse M, May D A, Watremez L, Pubellier M. 2018. Continental break-up of the South China Sea stalled by far-field compression. Nature Geoscience, 11(8): 605-609.
DOI:10.1038/s41561-018-0178-5 |
Lei C, Ren J Y, Sternai P, Fox M, Willett S, Xie X N, Clift P D, Liao J H, Wang Z F. 2015. Structure and sediment budget of Yinggehai-Song Hong basin, South China Sea: implications for Cenozoic tectonics and river basin reorganization in Southeast Asia. Tectonophysics, 655: 177-190.
DOI:10.1016/j.tecto.2015.05.024 |
Li C F, Xu X, Lin J, Sun Z, Zhu J, Yao Y J, Zhao X X, Liu Q S, Kulhanek D K, Wang J, Song T R, Zhao J F, Qiu N, Guan Y X, Zhou Z Y, Williams T, Bao R, Briais A, Brown E A, Chen Y F, Clift P D, Colwell F S, Dadd K A, Ding W W, Almeida I H, Huang X L, Hyun S, Jiang T, Koppers A A P, Li Q Y, Liu C L, Liu Z F, Nagai R H, Peleo-Alampay A, Su X, Tejada M L G, Trinh H S, Yeh Y C, Zhang C L, Zhang F, Zhang G L. 2014. Ages and magnetic structures of the South China Sea constrained by deep tow magnetic surveys and IODP expedition 349. Geochemistry, Geophysics, Geosystems, 15(12): 4 958-4 983.
DOI:10.1002/2014gc005567 |
Li C F, Zhou Z Y, Li J B, Chen B, Geng J H. 2008. Magnetic zoning and seismic structure of the South China Sea ocean basin. Marine Geophysical Researches, 29(4): 223-238.
DOI:10.1007/s11001-008-9059-4 |
Li C F, Zhou Z Y, Li J B, Hao H J, Geng J H. 2007. Structures of the northeasternmost South China Sea continental margin and ocean basin: geophysical constraints and tectonic implications. Marine Geophysical Researches, 28(1): 59-79.
DOI:10.1007/s11001-007-9014-9 |
Li J B, Ding W W, Wu Z Y, Zhang J, Dong C Z. 2012. The propagation of seafloor spreading in the southwestern subbasin, South China Sea. Chinese Science Bulletin, 57(24): 3 182-3 191.
DOI:10.1007/s11434-012-5329-2 |
Ligi M, Bonatti E, Bosworth W, Cai Y, Cipriani A, Palmiotto C, Ronca S, Seyler M. 2018. Birth of an ocean in the Red Sea: oceanic-type basaltic melt intrusions precede continental rupture. Gondwana Research, 54: 150-160.
DOI:10.1016/j.gr.2017.11.002 |
Lin J, Li J B, Xu Y G, Sun Z, Xia S H, Huang X L, Xie X N, Li C F, Ding W W, Zhou Z Y, Zhang F, Luo Y M. 2019. Ocean drilling and major advances in marine geological and geophysical research of the South China Sea. Acta Oceanologica Sinica, 41(10): 125-140.
(in Chinese with English abstract) DOI:10.3969/j.issn.0253-4193.2019.10.009 |
Lü C C, Hao T Y, Lin J, Qiu X L. 2017. The role of rifting in the development of the continental margins of the southwest subbasin, South China Sea: insights from an OBS experiment. Marine Geophysical Research, 38(1-2): 105-123.
DOI:10.1007/s11001-016-9295-y |
Lu K Z, Zhu X M, Qi J F. 2001. Analysis of Petroliferous Basins. China University of Petroleum Press, Dongying.
(in Chinese)
|
Ma Y B, Wu S G, Lv F L, Dong D D, Sun Q L, Lu Y T, Gu M F. 2011. Seismic characteristics and development of the Xisha carbonate platforms, northern margin of the South China Sea. Journal of Asian Earth Sciences, 40(3): 770-783.
DOI:10.1016/j.jseaes.2010.11.003 |
Mao Y H, Zhao Z X, Sun Z. 2020. Extensional thinning mechanism of the western continental margin of the Pearl River mouth basin. Earth Science, 45(5): 1 622-1 635.
(in Chinese with English abstract) DOI:10.3799/dqkx.2019.160 |
McKenzie D. 1978. Some remarks on the development of sedimentary basins. Earth and Planetary Science Letters, 40(1): 25-32.
DOI:10.1016/0012-821X(78)90071-7 |
Pichot T, Delescluse M, Chamot-Rooke N, Pubellier M, Qiu Y, Meresse F, Sun G, Savva D, Wong K P, Watremez L, Auxiètre J L. 2014. Deep crustal structure of the conjugate margins of the SW South China Sea from wide-angle refraction seismic data. Marine and Petroleum Geology, 58: 627-643.
DOI:10.1016/j.marpetgeo.2013.10.008 |
Qiu N, Wang Z W, Wang Z F, Sun Z P, Sun Z, Zhou D. 2014. Tectonostratigraphic structure and crustal extension of the Qiongdongnan basin, northern South China Sea. Chinese Journal of Geophysics, 57(10): 3 189-3 207.
(in Chinese with English abstract) |
Qiu X L, Zhao M H, Ao W, Lü C C, Hao T Y, You Q Y, Ruan A G, Li J B. 2011. OBS survey and crustal structure of the Southwest Sub-basin and Nansha Block, South China Sea. Chinese Journal of Geophysics, 54(12): 3 117-3 128.
(in Chinese with English abstract) DOI:10.3969/j.issn.0001-5733.2011.12.012 |
Roger Buck W. 1986. Small-scale convection induced by passive rifting: the cause for uplift of rift shoulders. Earth and Planetary Science Letters, 77(3-4): 362-372.
DOI:10.1016/0012-821X(86)90146-9 |
Ros E, Pérez-Gussinyé M, Araújo M, Thoaldo Romeiro M Andrés-Martínez M, Morgan J P. 2017. Lower crustal strength controls on melting and serpentinization at magma-poor margins: potential implications for the south Atlantic. Geochemistry, Geophysics, Geosystems, 18(12): 4 538-4 557.
DOI:10.1002/2017gc007212 |
Royden L, Keen C E. 1980. Rifting process and thermal evolution of the continental margin of Eastern Canada determined from subsidence curves. Earth and Planetary Science Letters, 51(2): 343-361.
DOI:10.1016/0012-821X(80)90216-2 |
Ruan A G, Niu X W, Qiu X L, Li J B, Wu Z L, Zhao M H, Wei X D. 2011. A wide angle Ocean Bottom Seismometer profile across Liyue Bank, the southern margin of South China Sea. Chinese Journal of Geophysics, 54(12): 3 139-3 149.
(in Chinese with English abstract) DOI:10.3969/j.issn.0001-5733.2011.12.014 |
Savva D, Meresse F, Pubellier M, Chamot-Rooke N, Lavier L, Po K W, Franke D, Steuer S, Sapin F, Auxietre J L, Lamy G. 2013. Seismic evidence of hyper-stretched crust and mantle exhumation offshore Vietnam. Tectonophysics, 608: 72-83.
DOI:10.1016/j.tecto.2013.07.010 |
Sclater J G, Christie P A F. 1980. Continental stretching: an explanation of the Post-Mid-Cretaceous subsidence of the central North Sea Basin. Journal of Geophysical Research, 85(B7): 3 711-3 739.
DOI:10.1029/JB085iB07p03711 |
Shi X B, Burov E, Leroy S, Qiu X L, Xia B. 2005. Intrusion and its implication for subsidence: a case from the Baiyun Sag, on the northern margin of the South China Sea. Tectonophysics, 407(1-2): 117-134.
DOI:10.1016/j.tecto.2005.07.004 |
Shi X B, Jiang H Y, Yang J, Yang X Q, Xu H H. 2017. Models of the rapid post-rift subsidence in the eastern Qiongdongnan Basin, South China Sea: implications for the development of the deep thermal anomaly. Basin Research, 29(3): 340-362.
DOI:10.1111/bre.12179 |
Sibuet J, Yeh Y, Lee C. 2016. Geodynamics of the South China Sea. Tectonophysics, 692: 98-119.
DOI:10.1016/j.tecto.2016.02.022 |
Smith W H F, Sandwell D T. 1997. Global sea floor topography from satellite altimetry and ship depth soundings. Science, 277(5334): 1 956-1 962.
DOI:10.1126/science.277.5334.1956 |
Steckler M S, Watts A B. 1978. Subsidence of the Atlantic-type continental margin off New York. Earth and Planetary ScienceLetters, 41(1): 1-13.
DOI:10.1016/0012-821X(78)90036-5 |
Steckler M S. 1985. Uplift and extension at the Gulf of Suez: indications of induced mantle convection. Nature, 317(6033): 135-139.
DOI:10.1038/317135a0 |
Steuer S, Franke D, Meresse F, Savva D, Pubellier M, Auxietre J L. 2014. Oligocene-Miocene carbonates and their role for constraining the rifting and collision history of the Dangerous Grounds, South China Sea. Marine and Petroleum Geology, 58: 644-657.
DOI:10.1016/j.marpetgeo.2013.12.010 |
Sun Z, Lin J, Qiu N, Jian Z M, Wang P X, Pang X. 2019. The role of magmatism in the thinning and breakup of the South China Sea continental margin: special Topic: the South China Sea Ocean Drilling. National Science Review, 6(5): 871-876.
DOI:10.1093/nsr/nwz116 |
Sun Z, Zhao Z X, Li J B, Zhou D, Wang Z W. 2011. Tectonic analysis of the breakup and bollision unconformities in the Nansha block. Chinese Journal of Geophysics, 54(6): 1 069-1 083.
DOI:10.1002/cjg2.1685 |
Taylor B, Hayes D E. 1980. The tectonic evolution of the South China Basin. In: Hayes D E ed. The Tectonic and Geologic Evolution of Southeast Asian Seas and Islands. American Geophysical Union, Washington. p. 89–104, https://doi.org/10.1029/GM023p0089.
|
Taylor B, Hayes D E. 1983. Origin and history of the South China Sea basin. In: Hayes D E ed. The Tectonic and Geologic Evolution of Southeast Asian Seas and Islands: Part 2. American Geophysical Union, Washington. p. 23–56, https://doi.org/10.1029/GM027p0023.
|
ter Voorde M, van Balen R T, Bertotti G, Cloetingh S A P L. 1998. The influence of a stratified rheology on the flexural response of the lithosphere to (un)loading by extensional faulting. Geophysical Journal International, 134(3): 721-735.
DOI:10.1046/j.1365-246x.1998.00629.x |
Tugend J, Manatschal G, Kusznir N J. 2015. Spatial and temporal evolution of hyperextended rift systems: implication for the nature, kinematics, and timing of the Iberian-European plate boundary. Geology, 43(1): 15-18.
DOI:10.1130/g36072.1 |
Wang J Y. 2015. Geothermics and Its Applications. Science Press, Beijing.
(in Chinese)
|
Wei X D, Ruan A G, Zhao M H, Qiu X L, Li J B, Zhu J J, Wu Z L, Ding W W. 2011. A wide-angle OBS profile across Dongsha uplift and Chaoshan depression in the mid-northern South China Sea. Chinese Journal of Geophysics, 54(12): 3 325-3 335.
(in Chinese with English abstract) DOI:10.3969/j.issn.0001-5733.2011.12.030 |
Wu S G, Yuan S Q, Zhang G C, Ma Y B, Mi L J, Xu N. 2009. Seismic characteristics of a reef carbonate reservoir and implications for hydrocarbon exploration in deepwater of the Qiongdongnan Basin, northern South China Sea. Marine and Petroleum Geology, 26(6): 817-823.
DOI:10.1016/j.marpetgeo.2008.04.008 |
Xie H, Zhou D, Li Y P, Pang X, Li P C, Chen G H, Li F C, Cao J H. 2014. Cenozoic tectonic subsidence in deepwater sags in the Pearl River Mouth Basin, northern South China Sea. Tectonophysics, 615-616: 182-198.
DOI:10.1016/j.tecto.2014.01.010 |
Xie X N, Müller R D, Li S T, Gong Z S, Steinberger B. 2006. Origin of anomalous subsidence along the Northern South China Sea margin and its relationship to dynamic topography. Marine and Petroleum Geology, 23(7): 745-765.
DOI:10.1016/j.marpetgeo.2006.03.004 |
Yuan S Q. 2009. Sedimentary System of Deepwater Channel, the Slope Area of Northern South China Sea. Institute of Oceanology, Chinese Academy of Sciences, Qingdao. 121p. (in Chinese with English abstract)
|
Zeng Z X, Fan G M. 2008. Structural Geology. 3rd edn. China University of Geosciences Press, Wuhan. 226p. (in Chinese)
|
Zhang G C, Mi L J, Wu S G, Tao W X, He S B, Lü J J. 2007. Deepwater area—the new prospecting targets of northern continental margin of South China Sea. Acta Petrolei Sinica, 28(2): 15-21.
(in Chinese with English abstract) |
Zhang G C, Qu H J, Liu S Q, Xie X J, Zhao Z, Shen H L. 2015. Tectonic cycle of marginal sea controlled the hydrocarbon accumulation in deep-water areas of South China Sea. Acta Petrolei Sinica, 36(5): 533-545.
(in Chinese with English abstract) DOI:10.7623/syxb201505002 |
Zhang G C, Zhu W L, Mi L J. 2010. The Theory of Hydrocarbon Genernation Controlled by Source Rock and Heat from Circle Distribution of Outside-oil Fields and Inside-gas Fields in South China Sea. Acta Sedimentologica Sinica, 28(5): 987-1 005.
(in Chinese with English abstract) DOI:10.14027/j.cnki.cjxb.2010.05.017 |
Zhang G C. 2010. Tectonic evolution of deepwater area of northern continental margin in South China Sea. Acta Petrolei Sinica, 31(4): 528-533.
(in Chinese with English abstract) |
Zhao Z X, Sun Z, Chen G H, Zhang Y F. 2011. Cenozoic structural characteristics and subsidence evolution in Nansha. Earth Science—Journal of China University of Geoscience, 36(5): 815-822.
(in Chinese with English abstract) DOI:10.3799/dqkx.2011.084 |
Zhao Z X, Sun Z, Liu J B, Pérez-Gussinyé M, Zhuo H T. 2018a. The continental extension discrepancy and anomalous subsidence pattern in the western Qiongdongnan Basin, South China Sea. Earth and Planetary Science Letters, 501: 180-191.
DOI:10.1016/j.epsl.2018.08.048 |
Zhao Z X, Sun Z, Sun L T, Wang Z F, Sun Z P. 2018b. Cenozoic tectonic subsidence in the Qiongdongnan Basin, northern South China Sea. Basin Research, 30(S1): 269-288.
DOI:10.1111/bre.12220 |
Zhao Z X, Sun Z, Wang Z W, Sun Z P, Liu J B, Wang Z W, Sun L T. 2013. The dynamic mechanism of post-rift accelerated subsidence in Qiongdongnan Basin, northern South China Sea. Marine Geophysical Research, 34(3-4): 295-308.
DOI:10.1007/s11001-013-9188-2 |
Zhou Z Y, Li C F. 2008. Continental Margin Tectonics and Geodynamics. Science Press, Beijing.
(in Chinese)
|